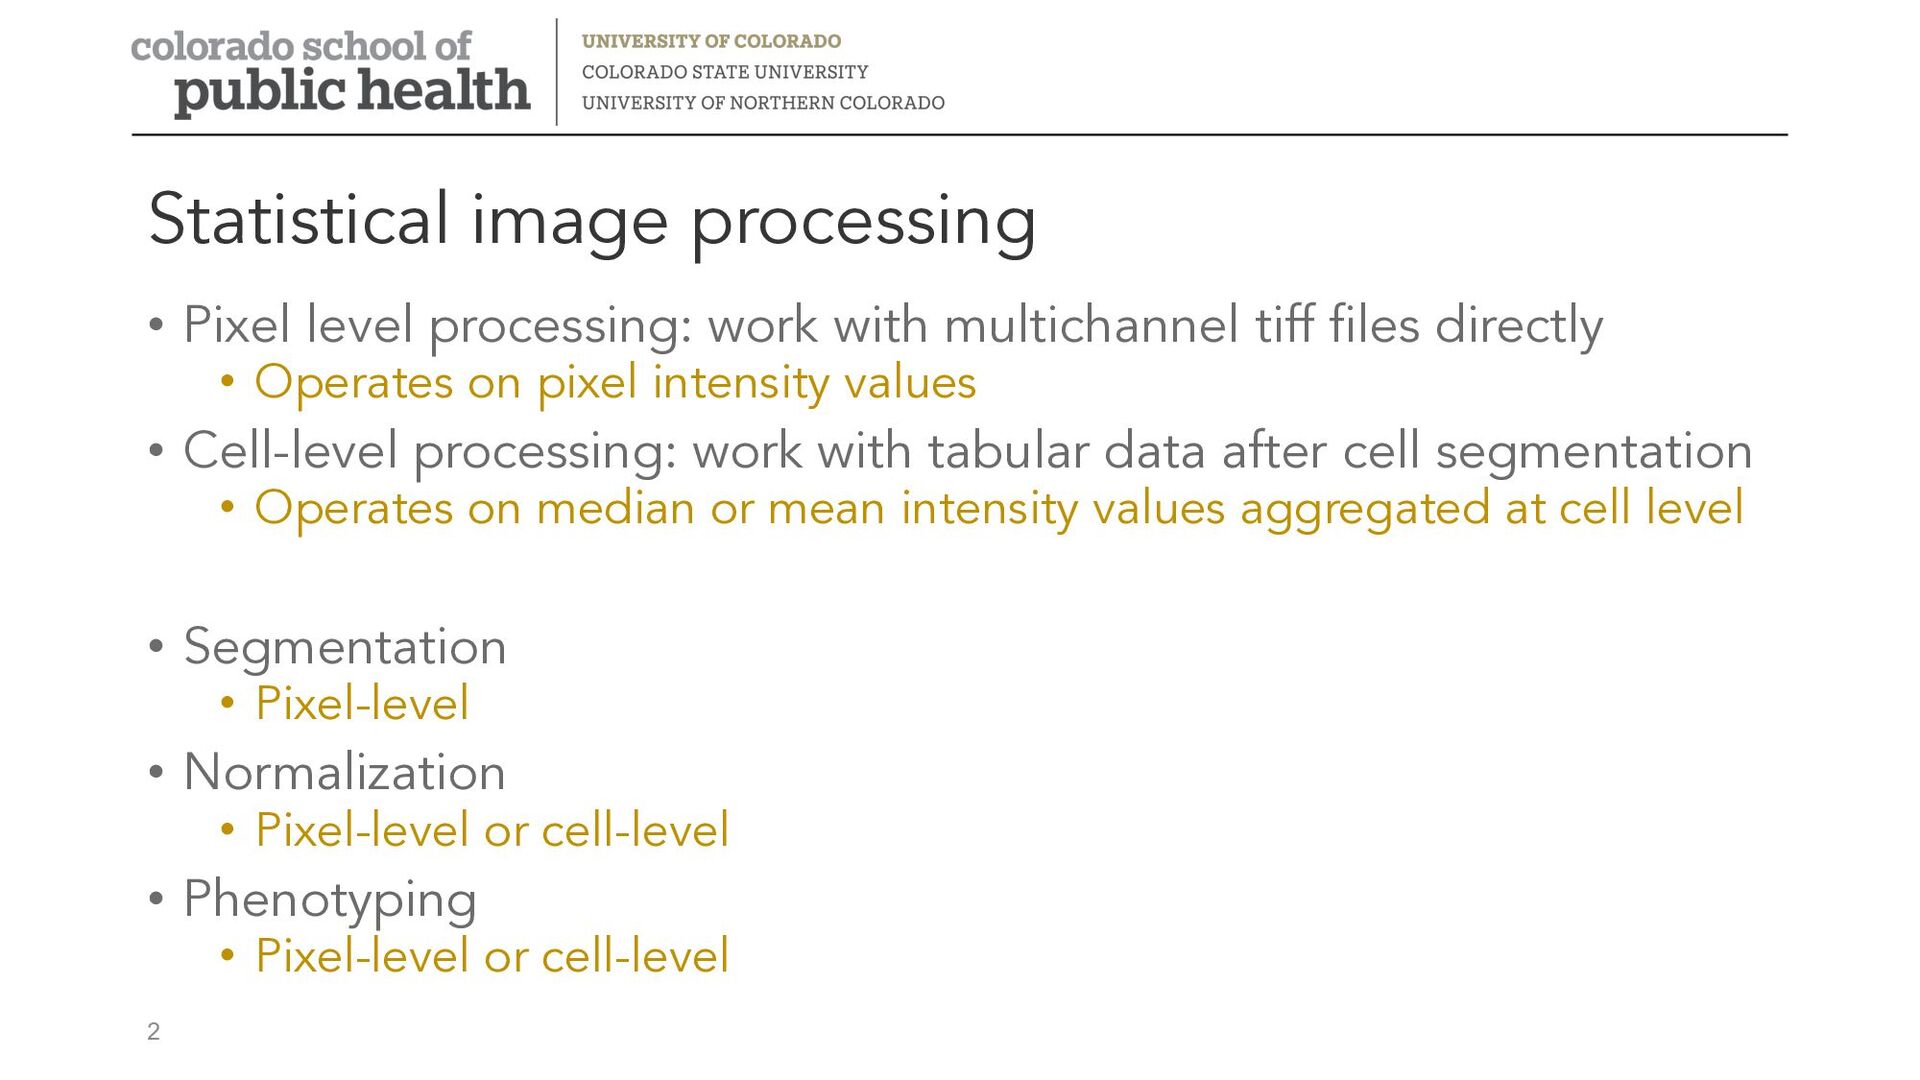
• Operates on pixel intensity values • Cell-level processing: work with tabular data after cell segmentation • Operates on median or mean intensity values aggregated at cell level • Segmentation • Pixel-level • Normalization • Pixel-level or cell-level • Phenotyping • Pixel-level or cell-level Statistical image processing 2
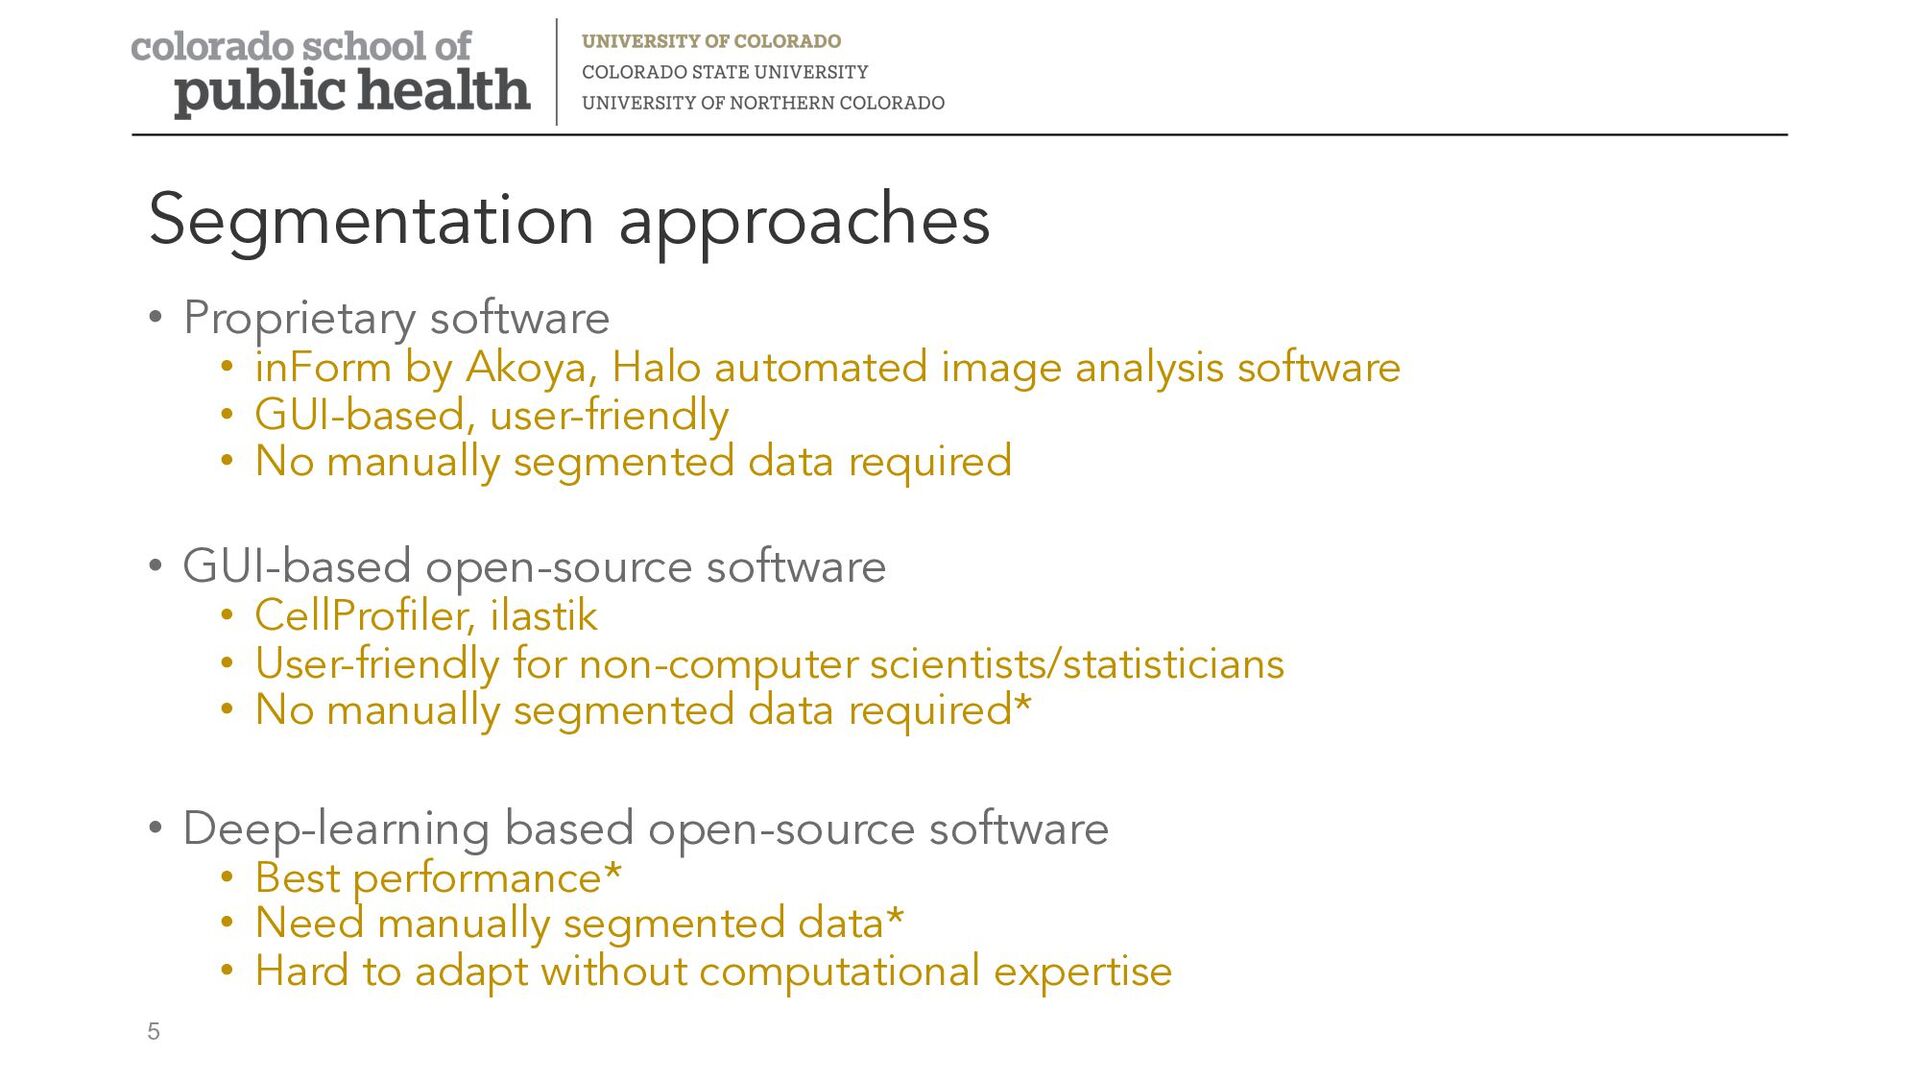
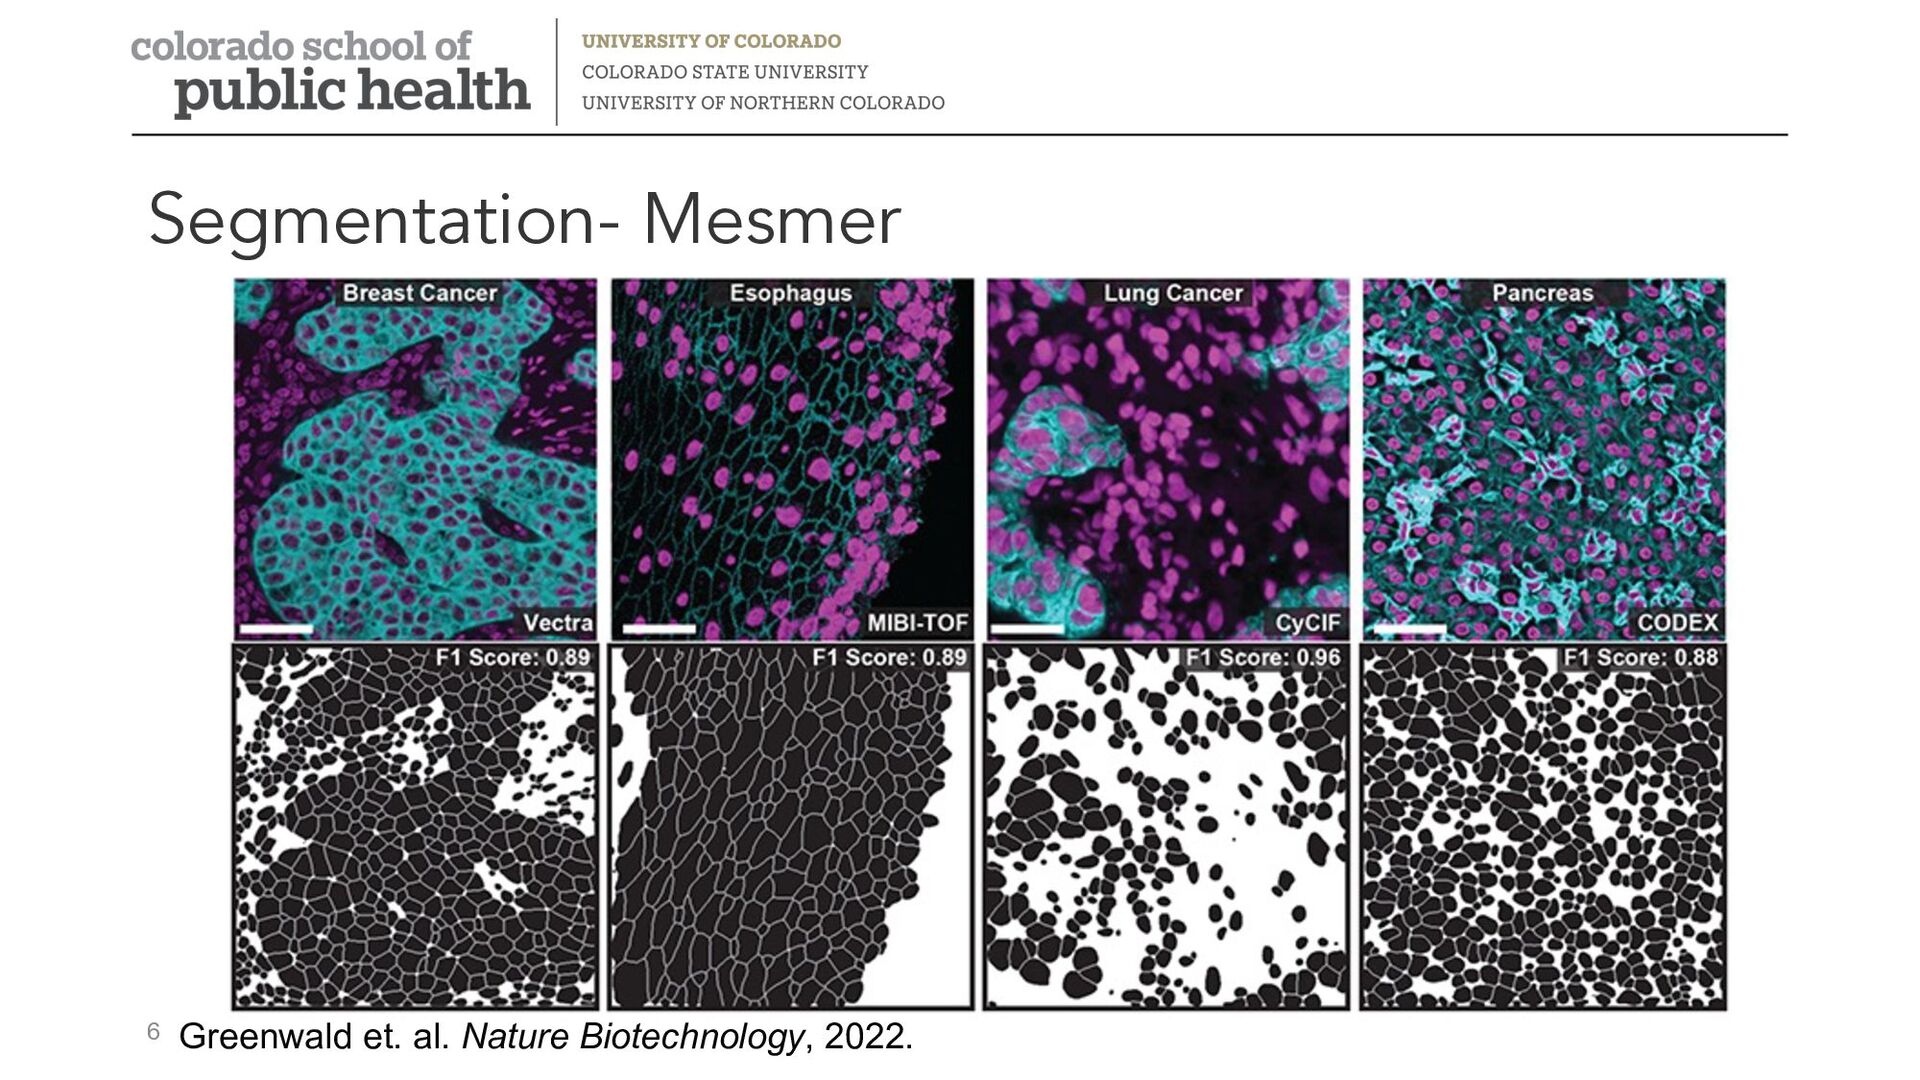
analysis software • GUI-based, user-friendly • No manually segmented data required • GUI-based open-source software • CellProfiler, ilastik • User-friendly for non-computer scientists/statisticians • No manually segmented data required* • Deep-learning based open-source software • Best performance* • Need manually segmented data* • Hard to adapt without computational expertise Segmentation approaches 5
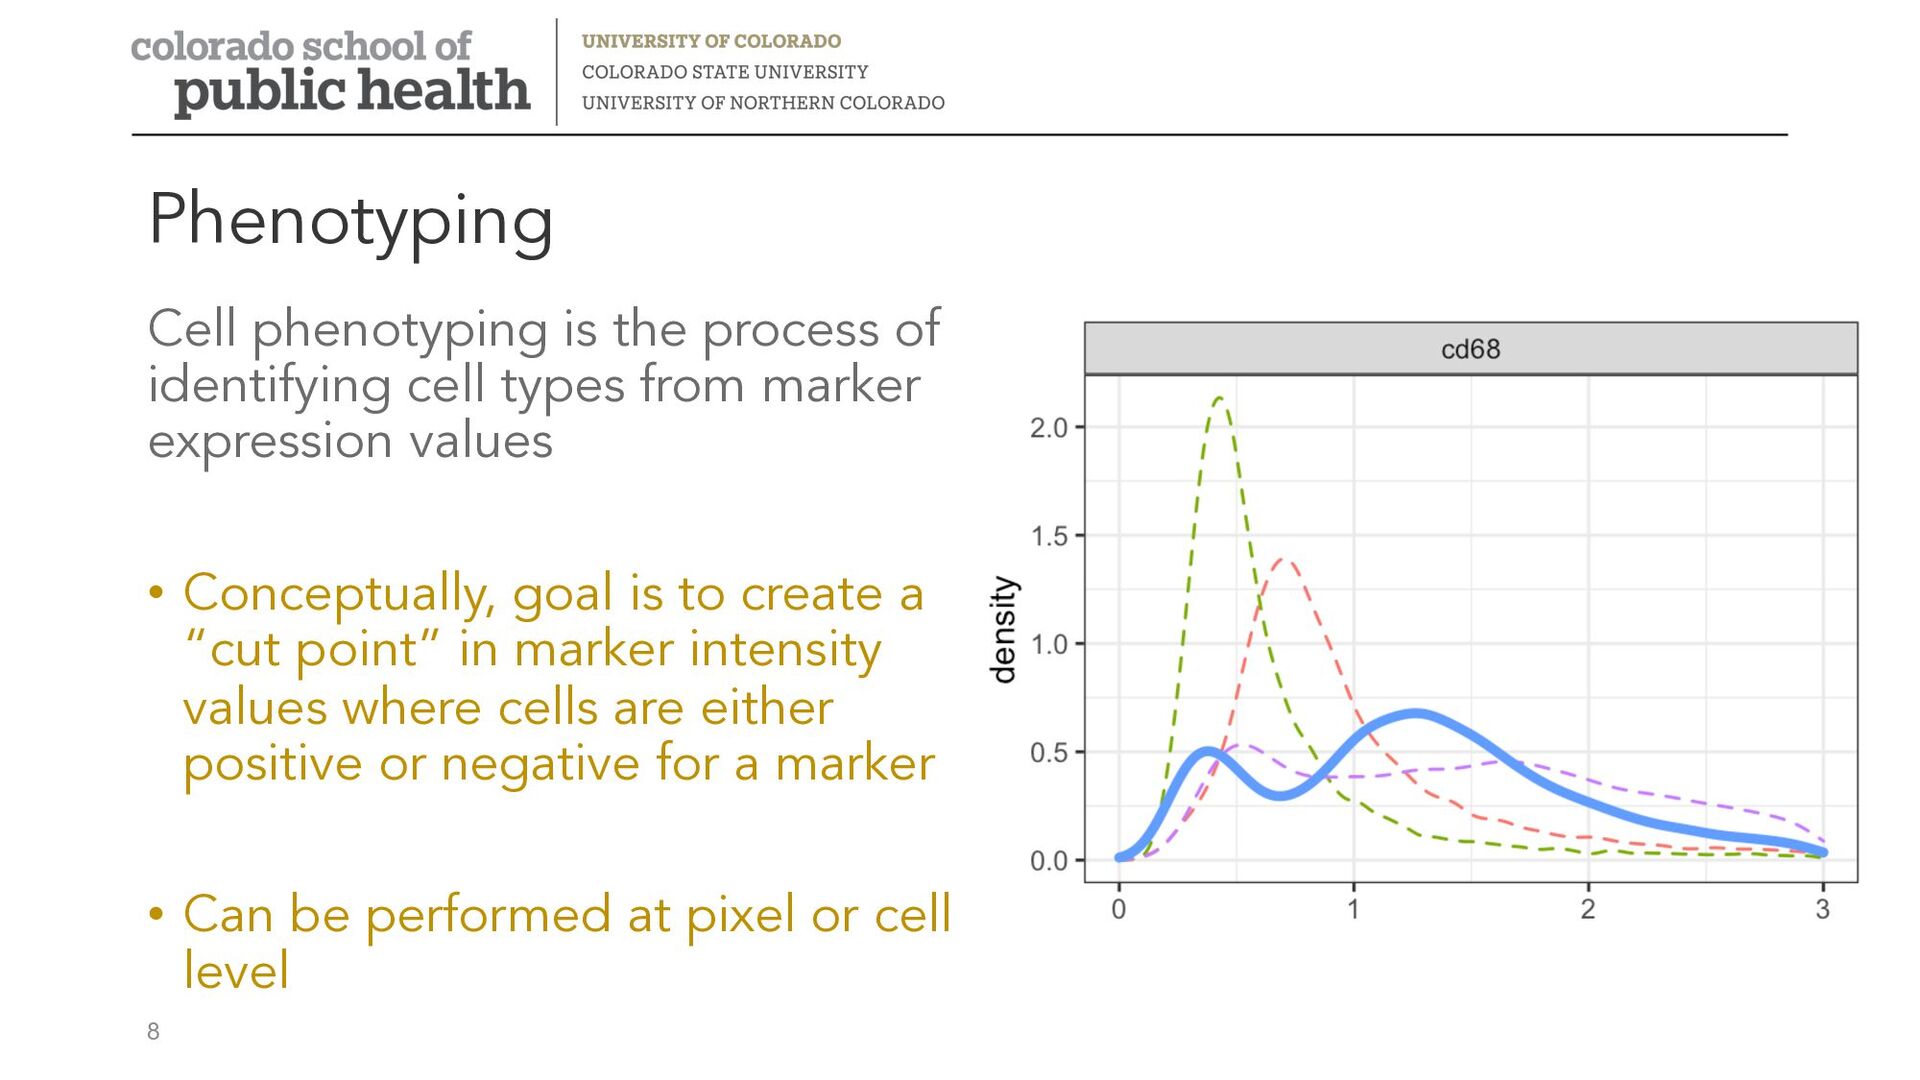
marker expression values • Conceptually, goal is to create a “cut point” in marker intensity values where cells are either positive or negative for a marker • Can be performed at pixel or cell level Phenotyping 8
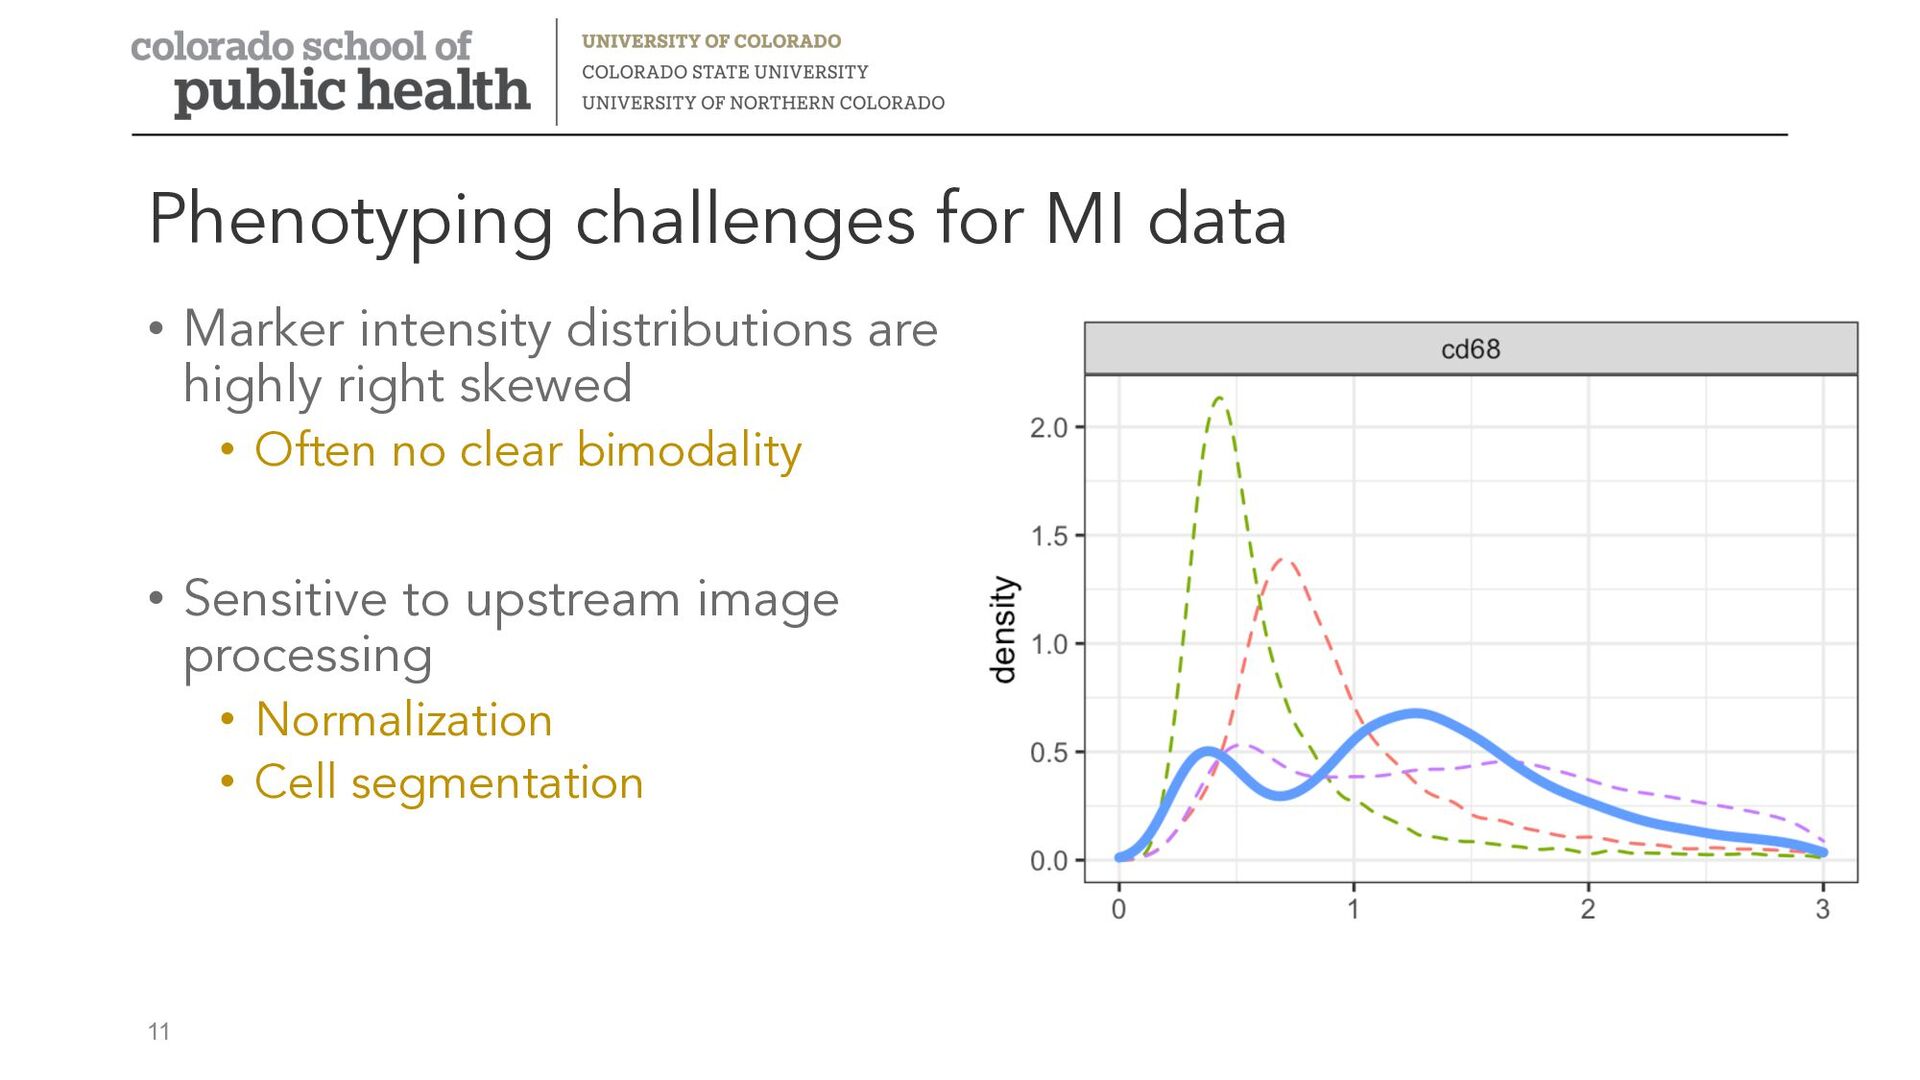
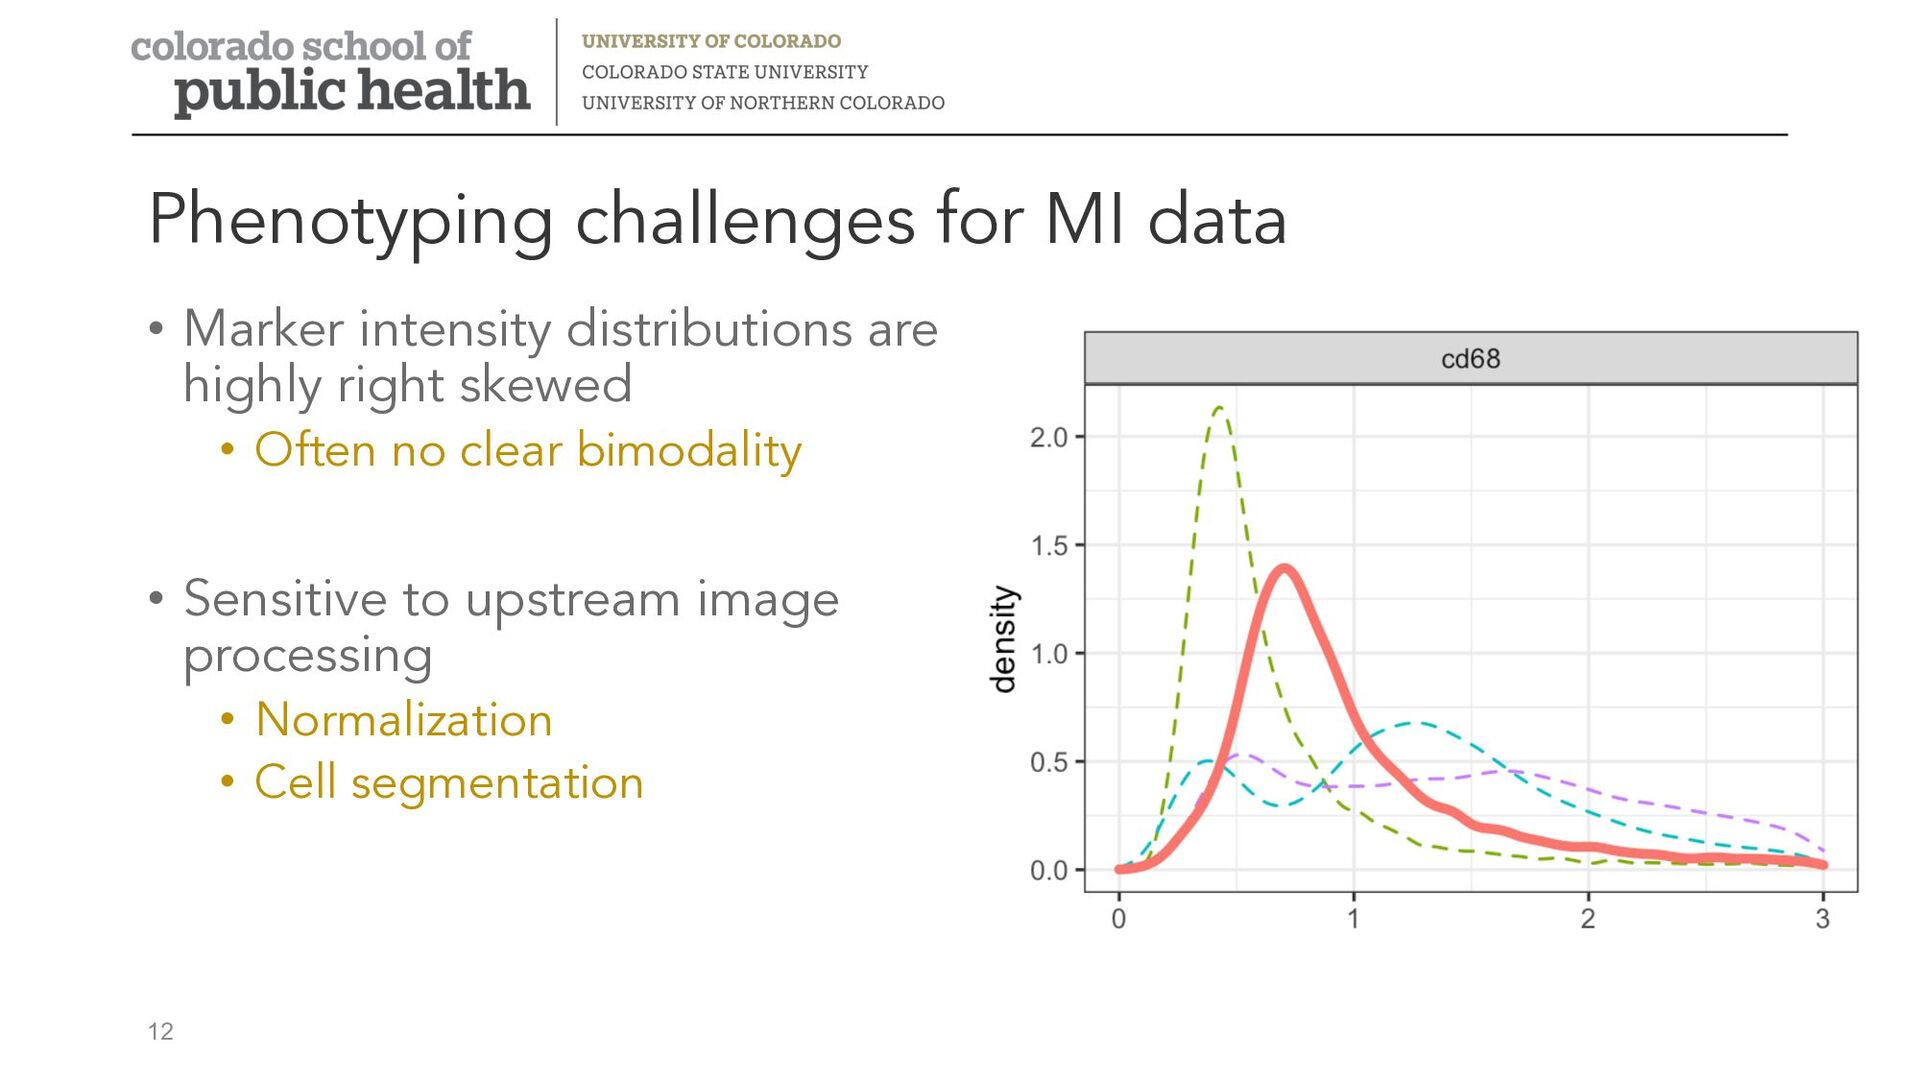
cell annotation and validation • Not specific to multiplex imaging • Flow and mass cytometry, single-cell RNA-seq • Multiplex imaging has unique challenges • Segmentation error leads to phenotyping error • Hard to differentiate between “marker positive” and “marker negative” Phenotyping 10
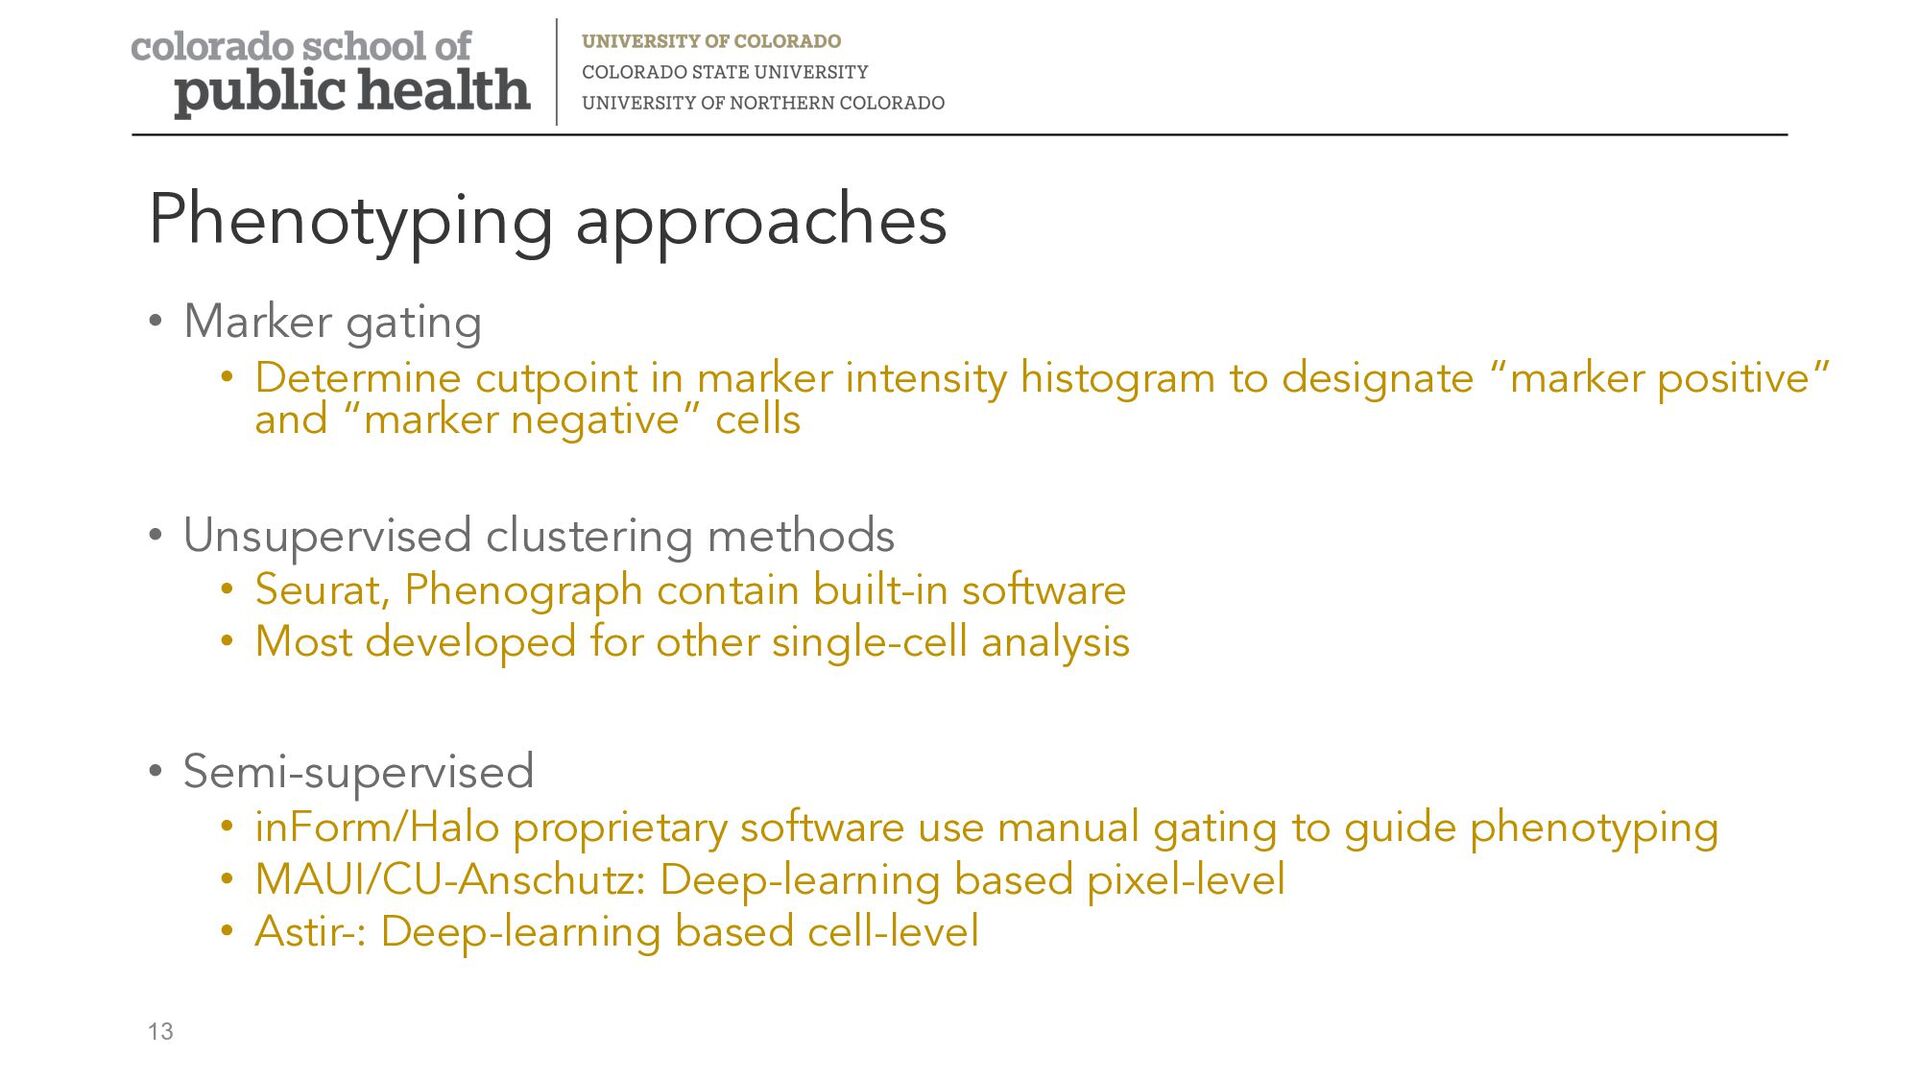
to designate “marker positive” and “marker negative” cells • Unsupervised clustering methods • Seurat, Phenograph contain built-in software • Most developed for other single-cell analysis • Semi-supervised • inForm/Halo proprietary software use manual gating to guide phenotyping • MAUI/CU-Anschutz: Deep-learning based pixel-level • Astir-: Deep-learning based cell-level Phenotyping approaches 13
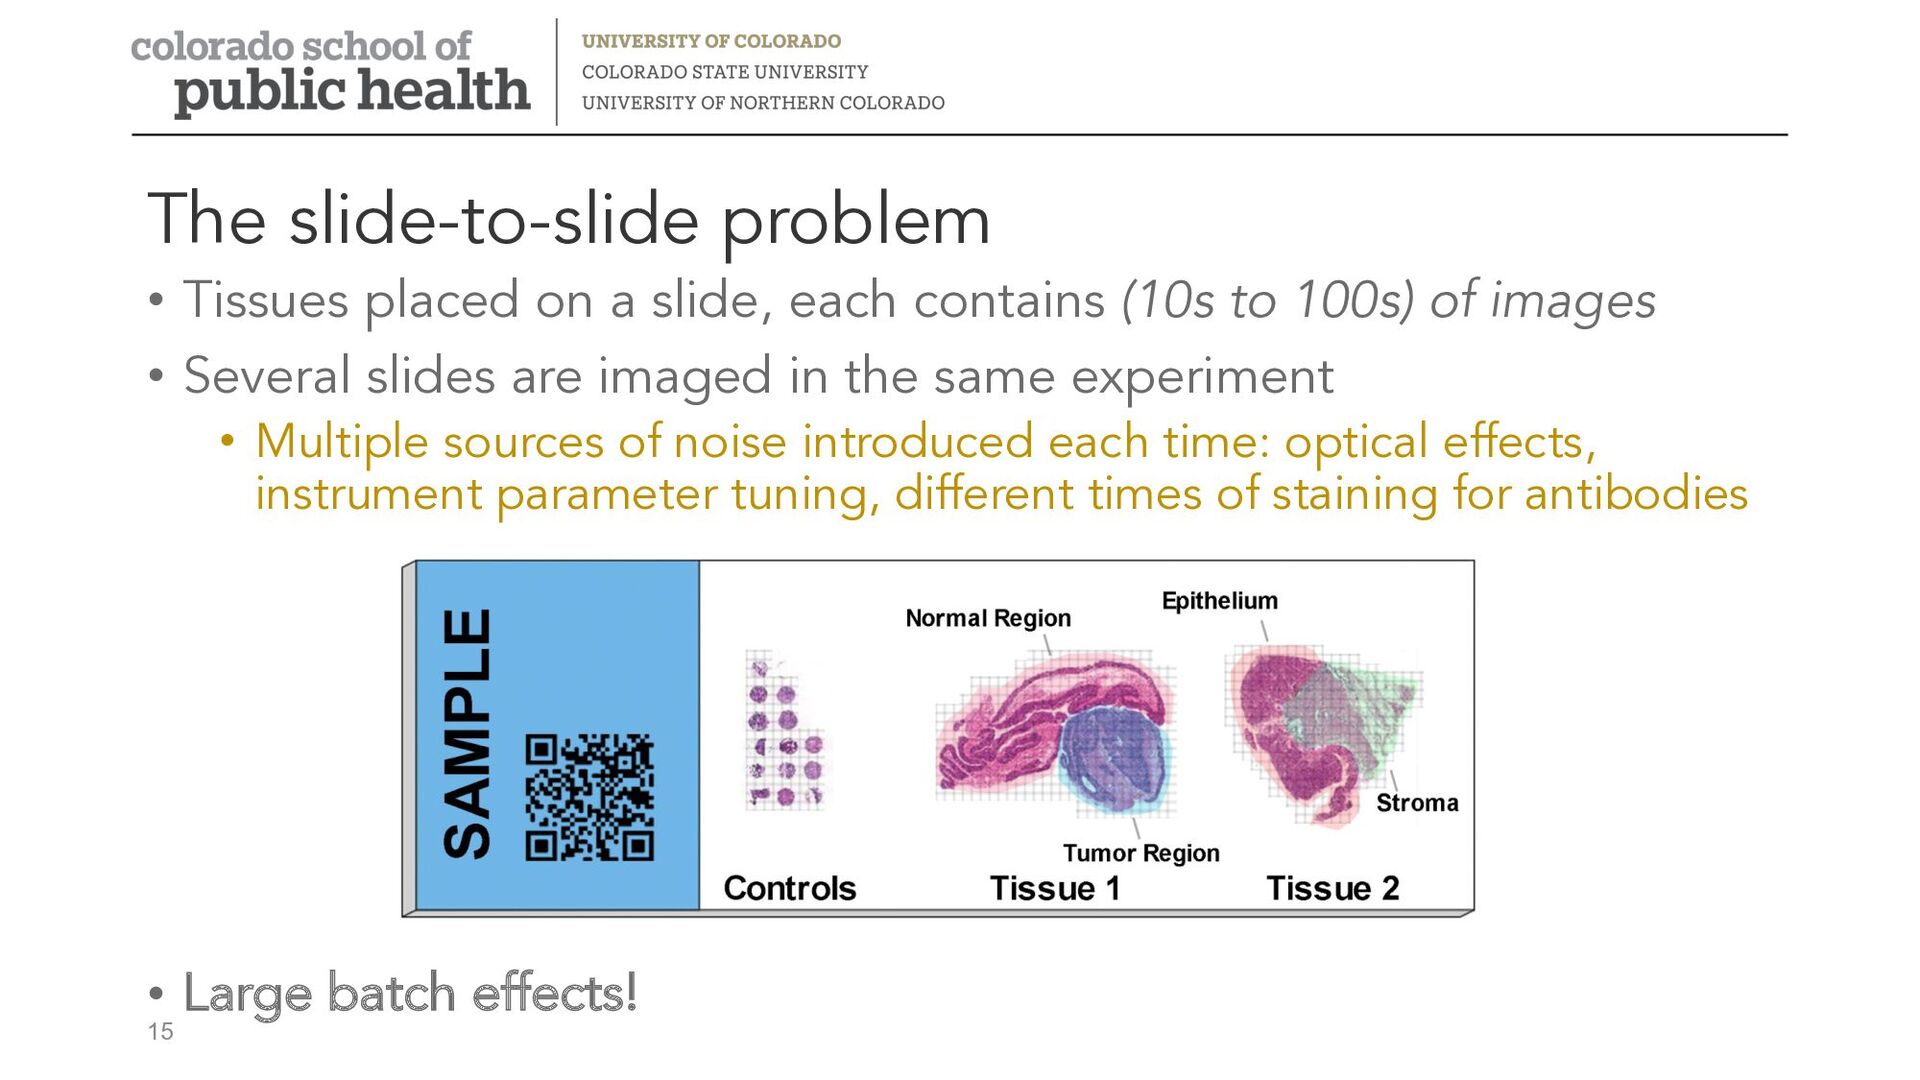
each contains (10s to 100s) of images • Several slides are imaged in the same experiment • Multiple sources of noise introduced each time: optical effects, instrument parameter tuning, different times of staining for antibodies • Large batch effects!
the data more appropriate for downstream analysis by removing non-biological biases in marker intensity distributions • Transformations: log, arcsinh, square root • Make data more normally distributed, do not adjust for systematic effects • Normalization: adjusts distribution of marker intensities in each slide, image, or channel separately to make distributions appear more similar • Batch correction: explicitly removes systematic bias using variables that account for processing steps Normalizing multiplex imaging data
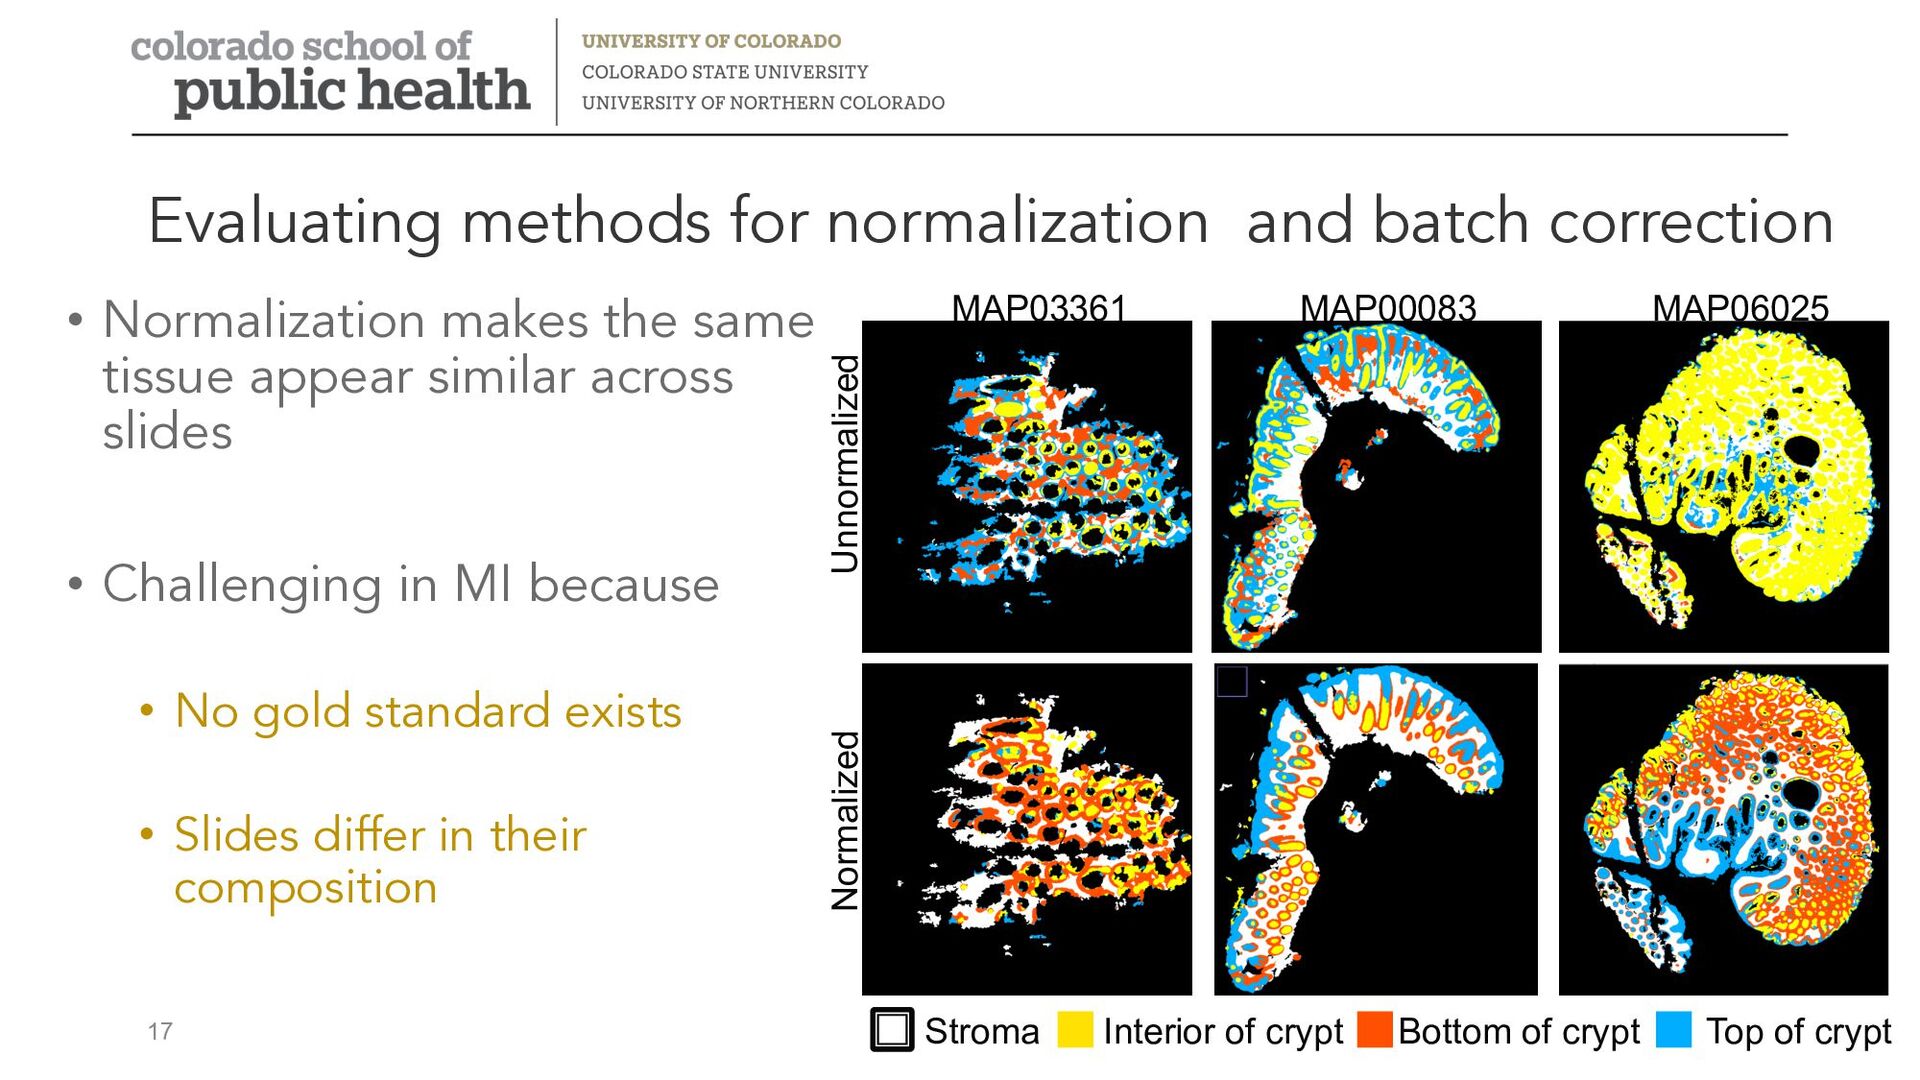
• Challenging in MI because • No gold standard exists • Slides differ in their composition Evaluating methods for normalization and batch correction 17 Unnormalized Normalized MAP06025 MAP00083 MAP03361 Bottom of crypt Interior of crypt Stroma Top of crypt
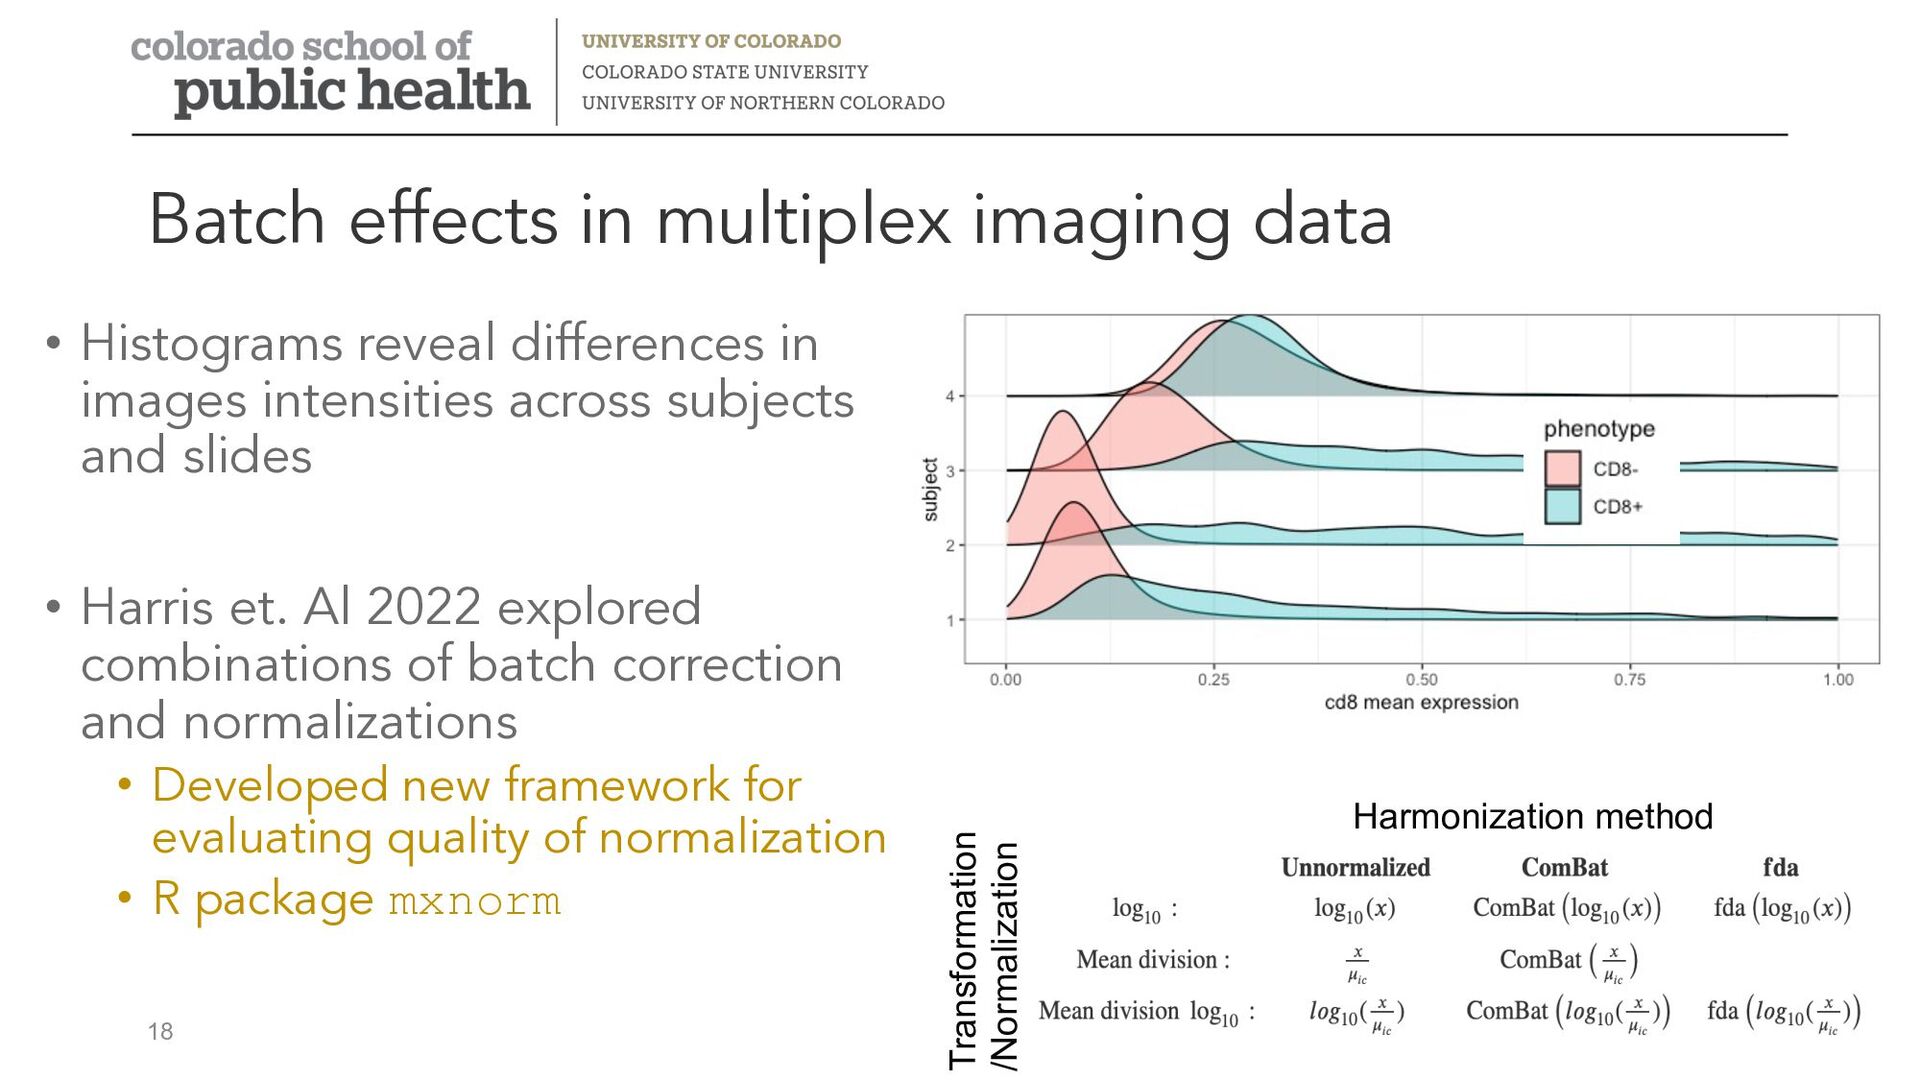
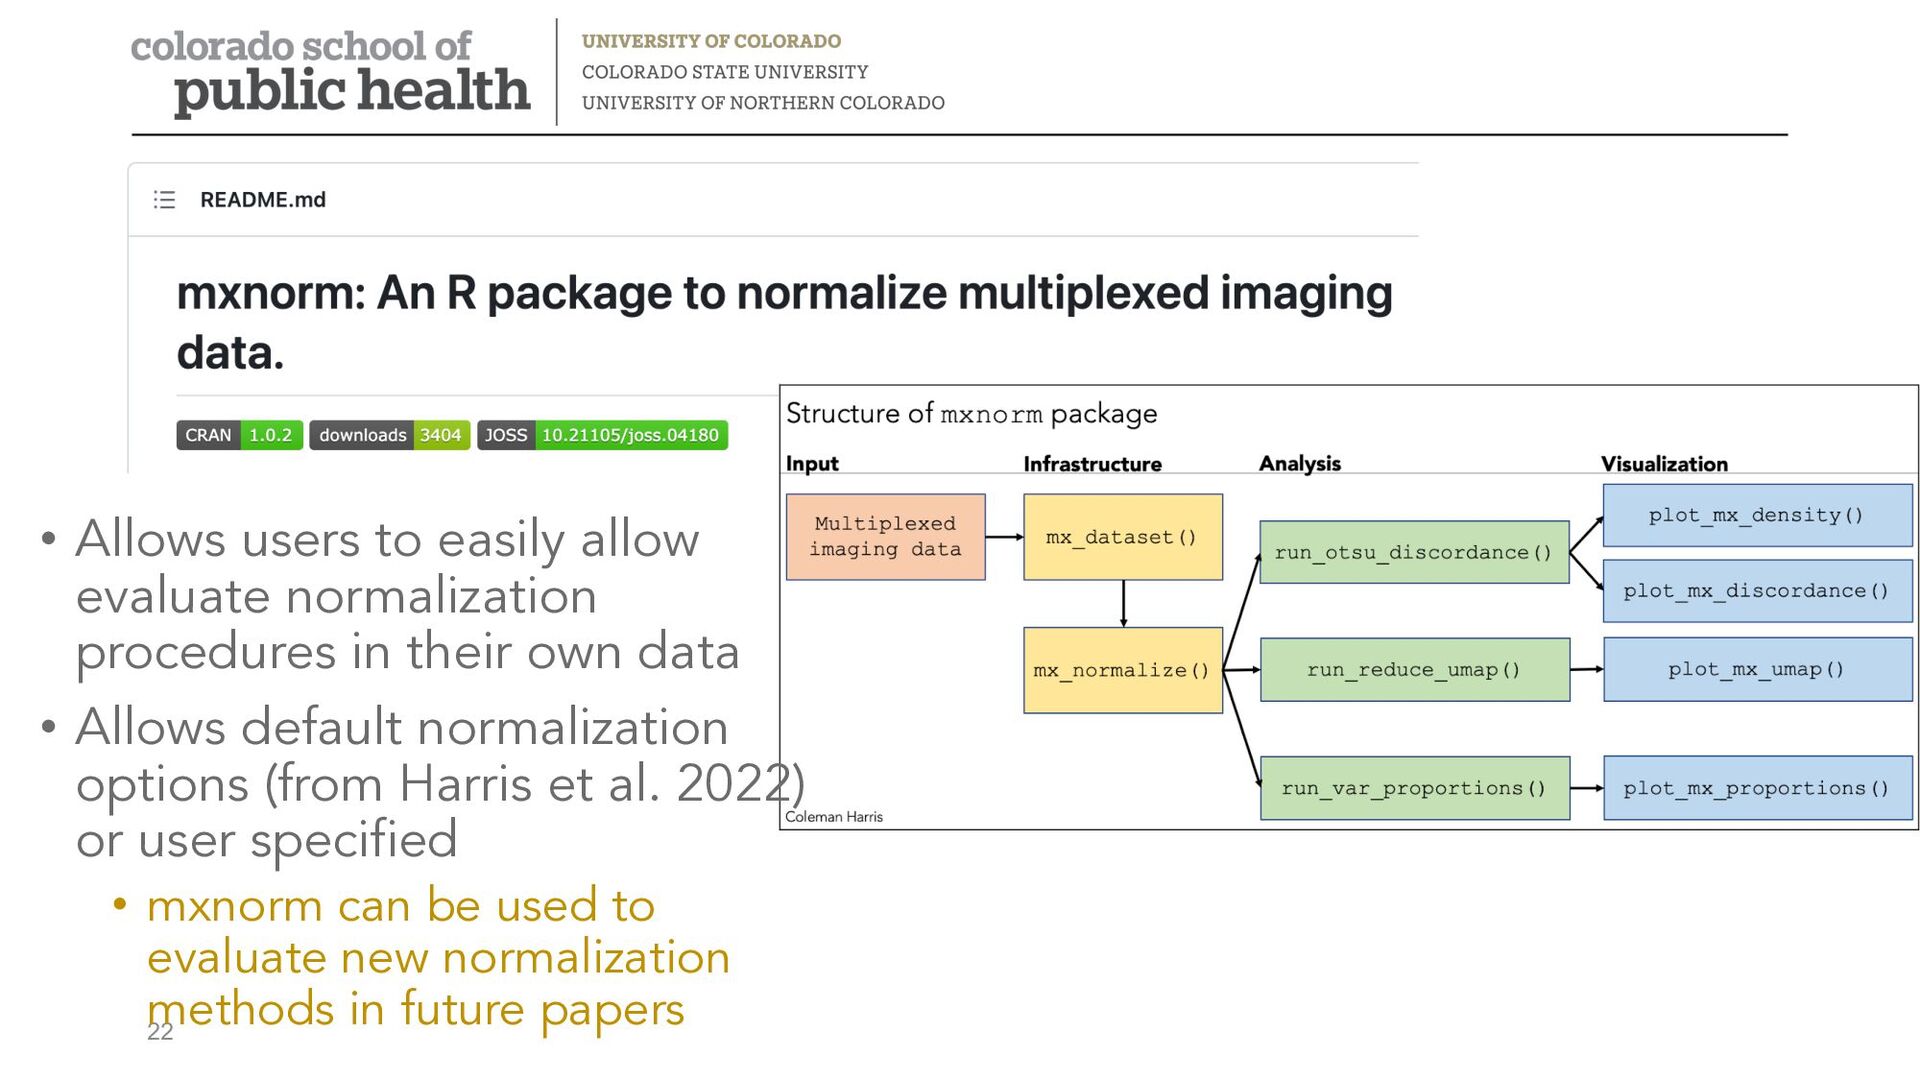
slides • Harris et. Al 2022 explored combinations of batch correction and normalizations • Developed new framework for evaluating quality of normalization • R package mxnorm Batch effects in multiplex imaging data 18 Harmonization method Transformation /Normalization
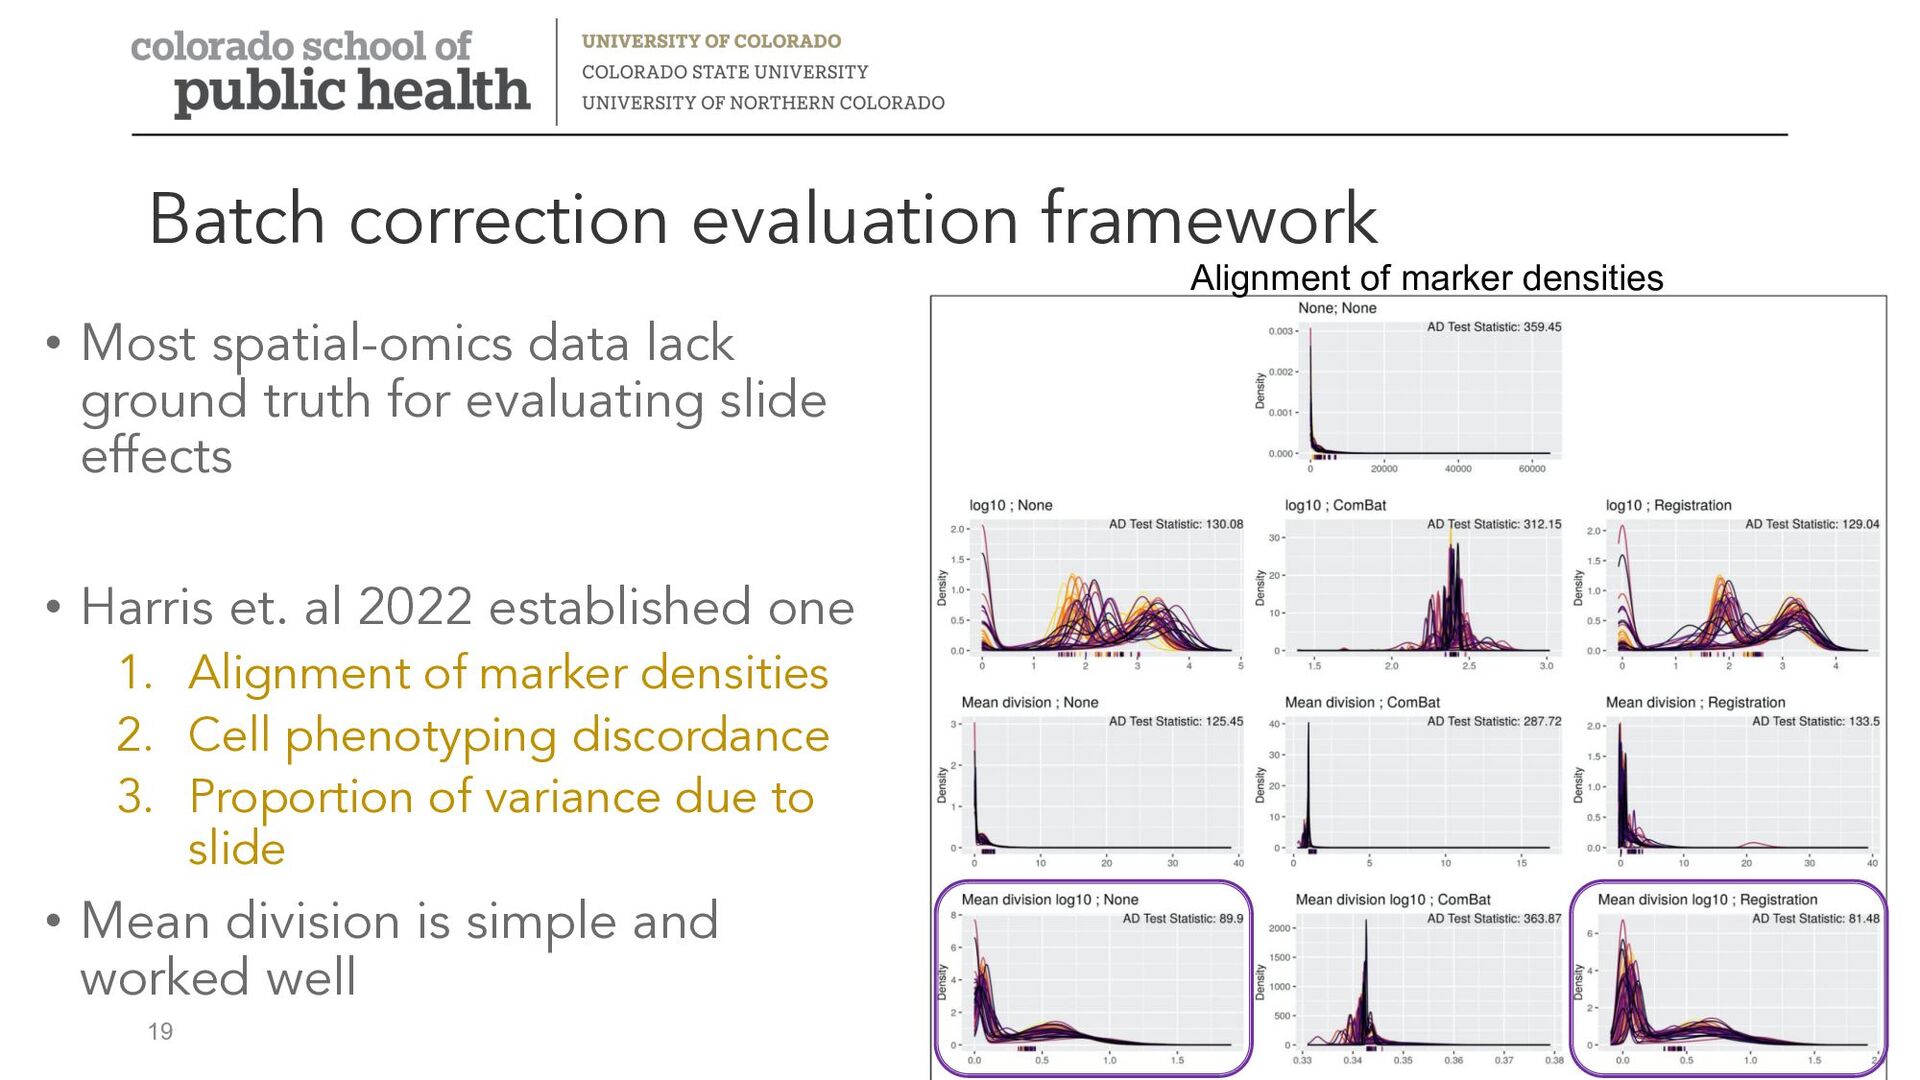
effects • Harris et. al 2022 established one 1. Alignment of marker densities 2. Cell phenotyping discordance 3. Proportion of variance due to slide • Mean division is simple and worked well Batch correction evaluation framework 19 Alignment of marker densities
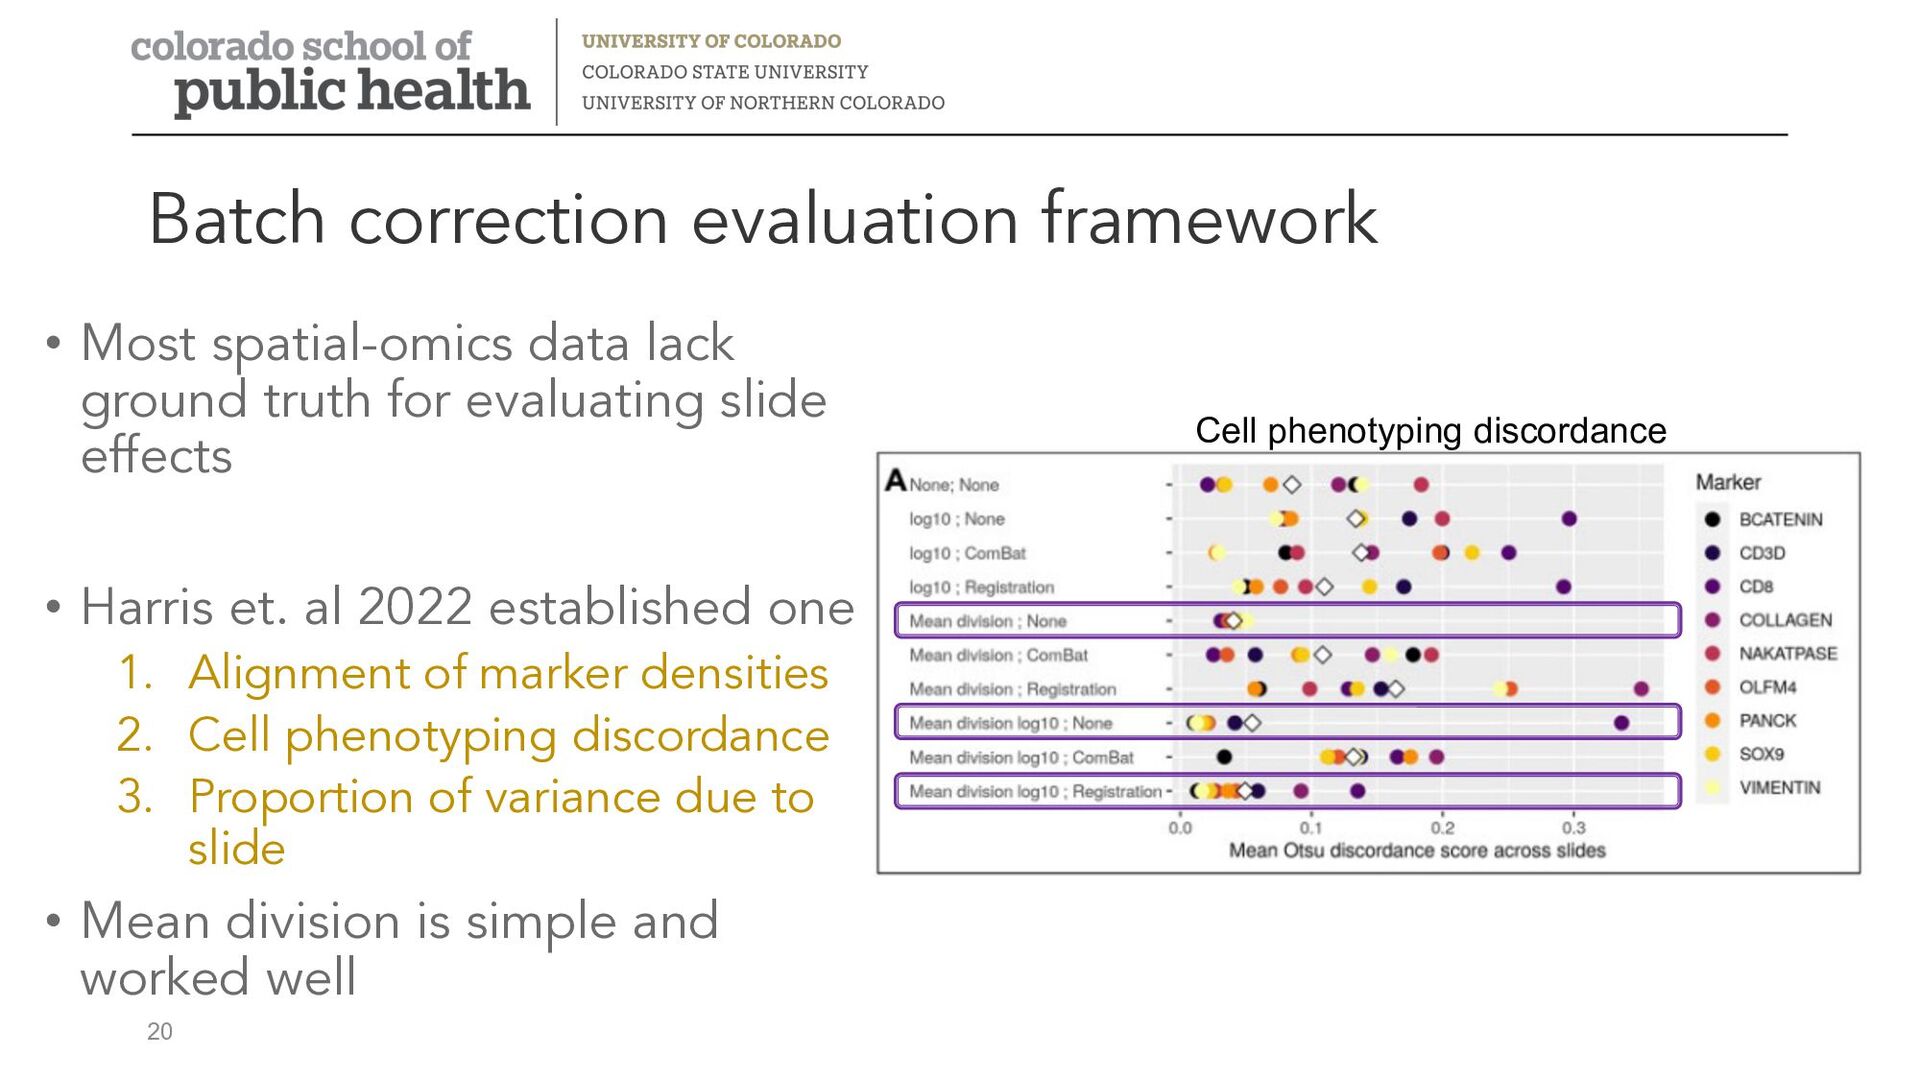
effects • Harris et. al 2022 established one 1. Alignment of marker densities 2. Cell phenotyping discordance 3. Proportion of variance due to slide • Mean division is simple and worked well Batch correction evaluation framework 20 Cell phenotyping discordance
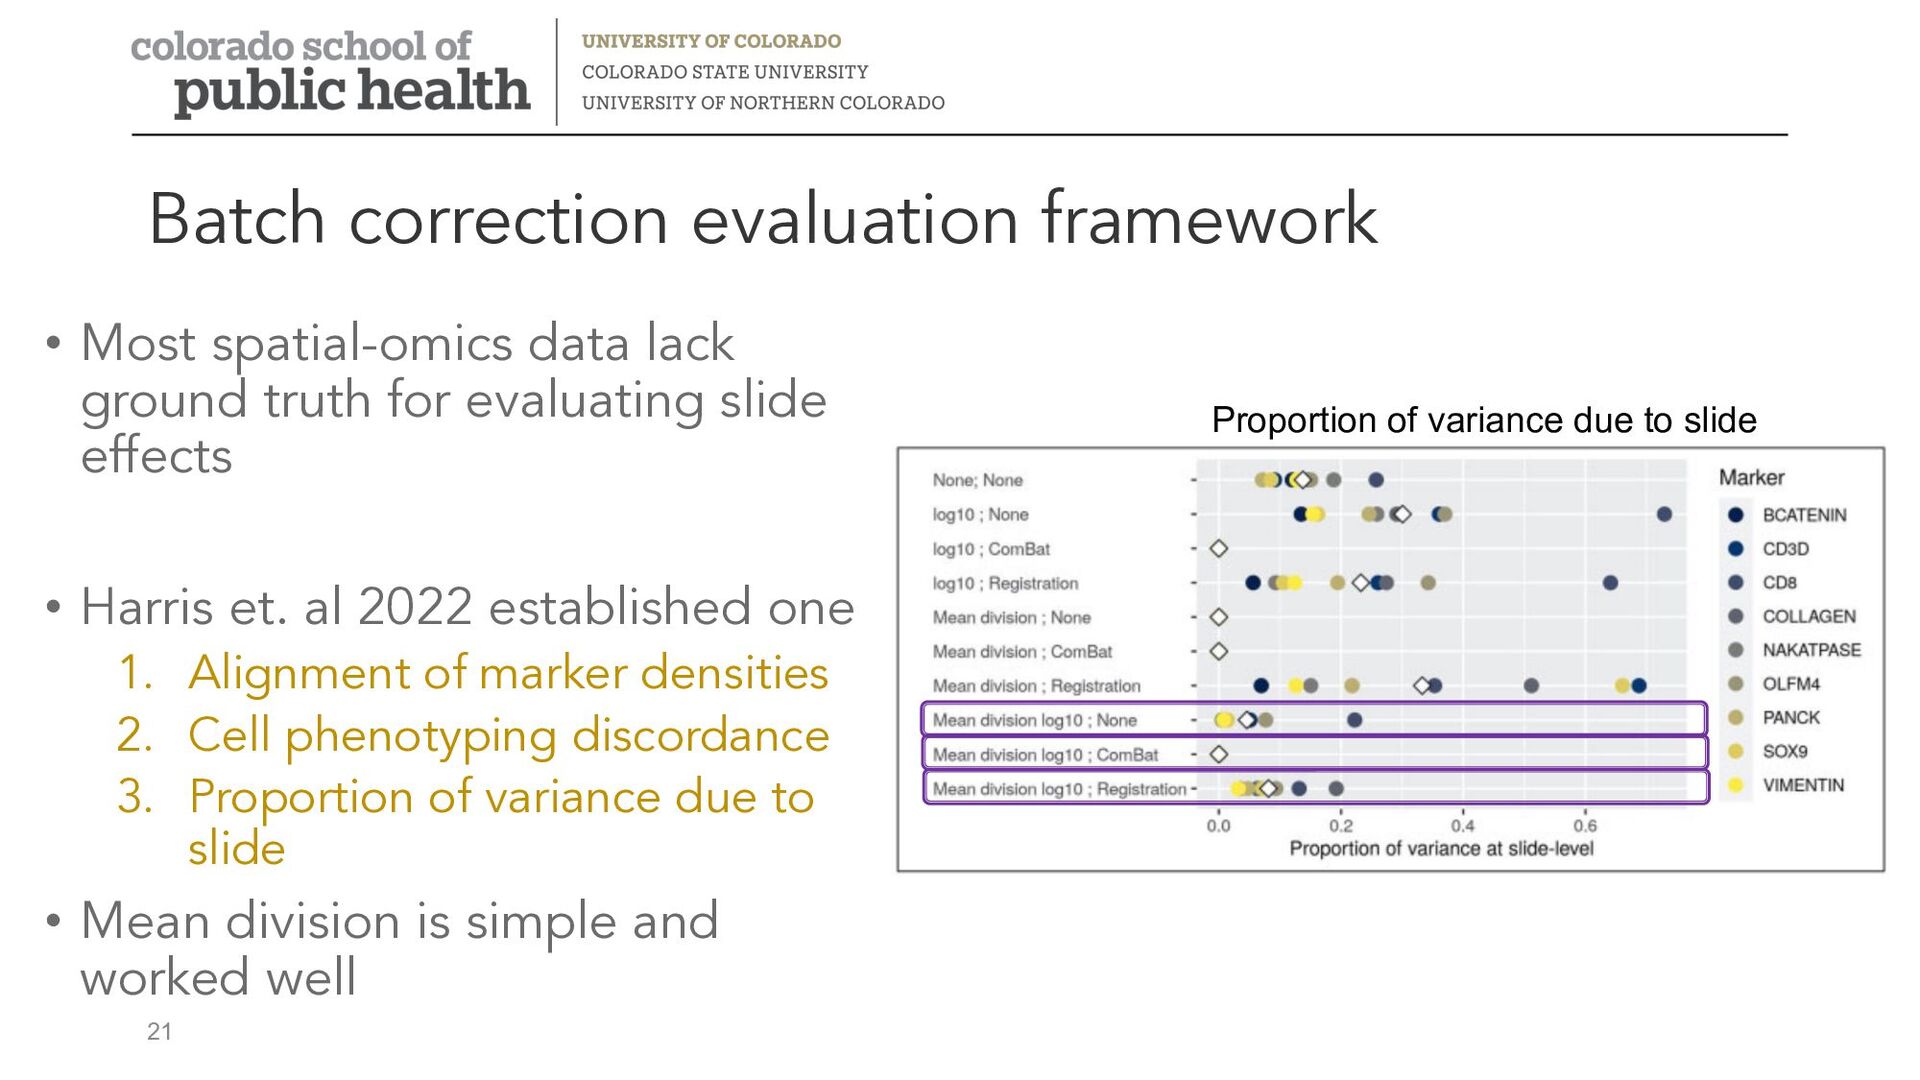
effects • Harris et. al 2022 established one 1. Alignment of marker densities 2. Cell phenotyping discordance 3. Proportion of variance due to slide • Mean division is simple and worked well Batch correction evaluation framework 21 Proportion of variance due to slide
in their own data • Allows default normalization options (from Harris et al. 2022) or user specified • mxnorm can be used to evaluate new normalization methods in future papers
Inform cell function and can be present be present across multiple cell types • Interested in differences in expression of functional expression across cell or patient populations of interest • whether abundance of PD-L1 positive cells differ between responders and non-responders to an immunotherapy • Still should be normalized! • For analysis, using continuous valued intensity is better than thresholding • Methods for differential expression analysis for ST data can be used • Seal et. al. 2022 provides a method to cluster based on marker densities Analysis of functional markers 23