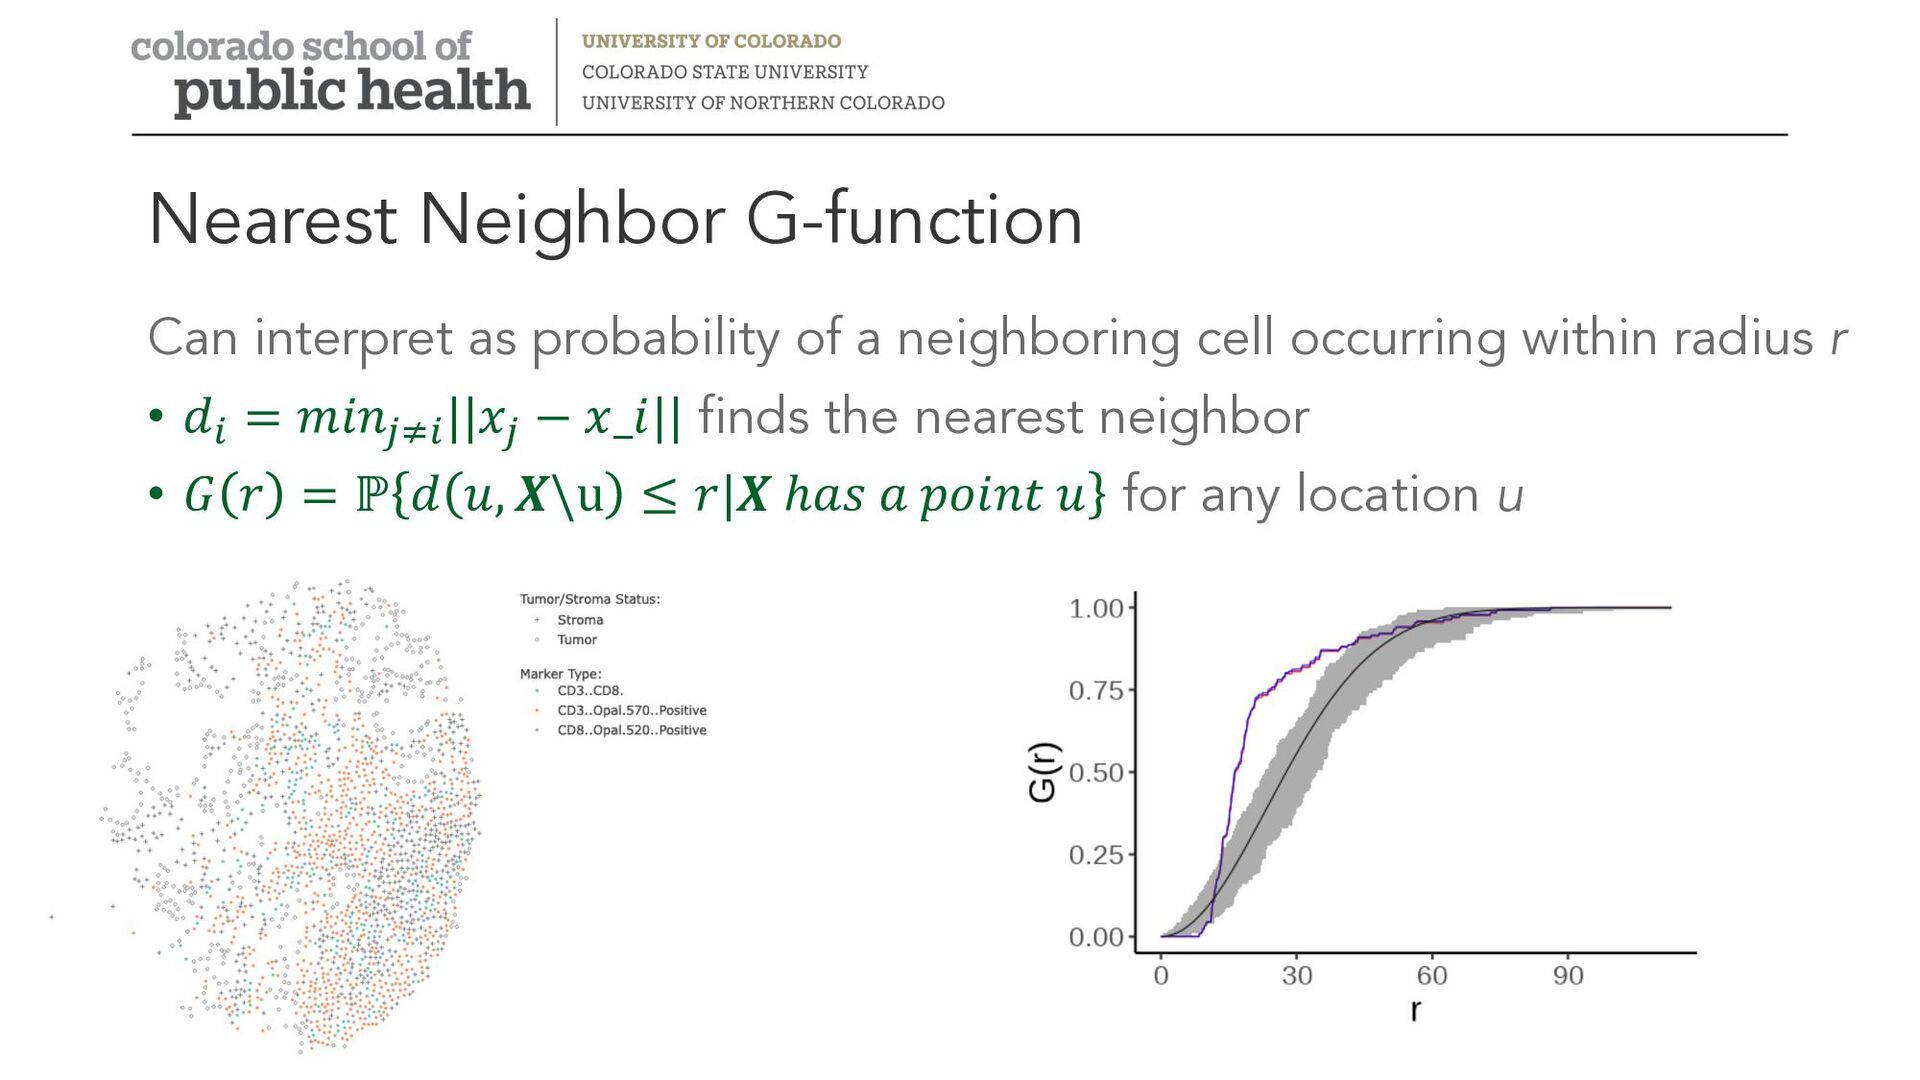
amongst cells in an image • Also often separated by tumor/stroma • Univariate spatial summary metrics • Clustering or dispersion of cells of one type • Bivariate spatial summary metrics • Co-expression or co-clustering of two cell types • Methods based on spatial point processes • Analyze number of neighbors: K-function, L-function • Analyze distance to nearest neighbor: G-function Spatial summary statistics 2
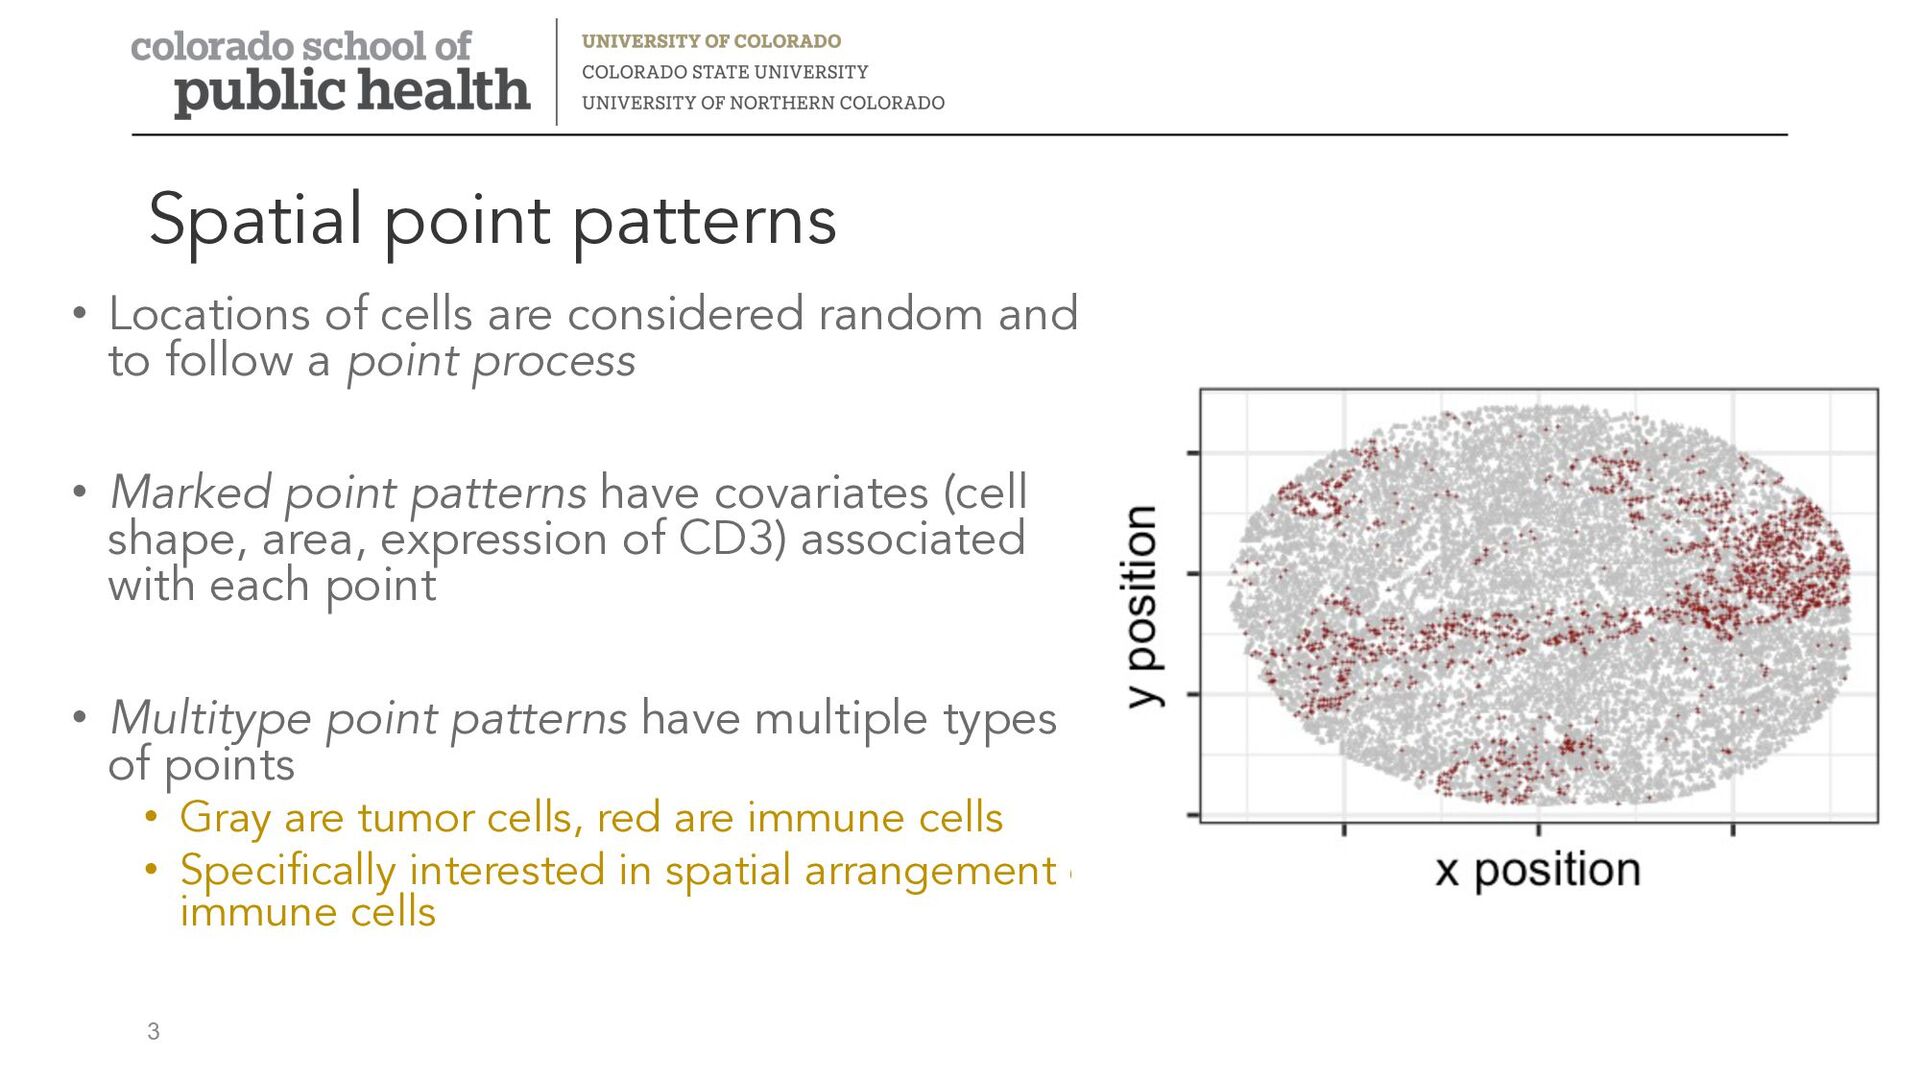
a point process • Marked point patterns have covariates (cell shape, area, expression of CD3) associated with each point • Multitype point patterns have multiple types of points • Gray are tumor cells, red are immune cells • Specifically interested in spatial arrangement of immune cells Spatial point patterns 3
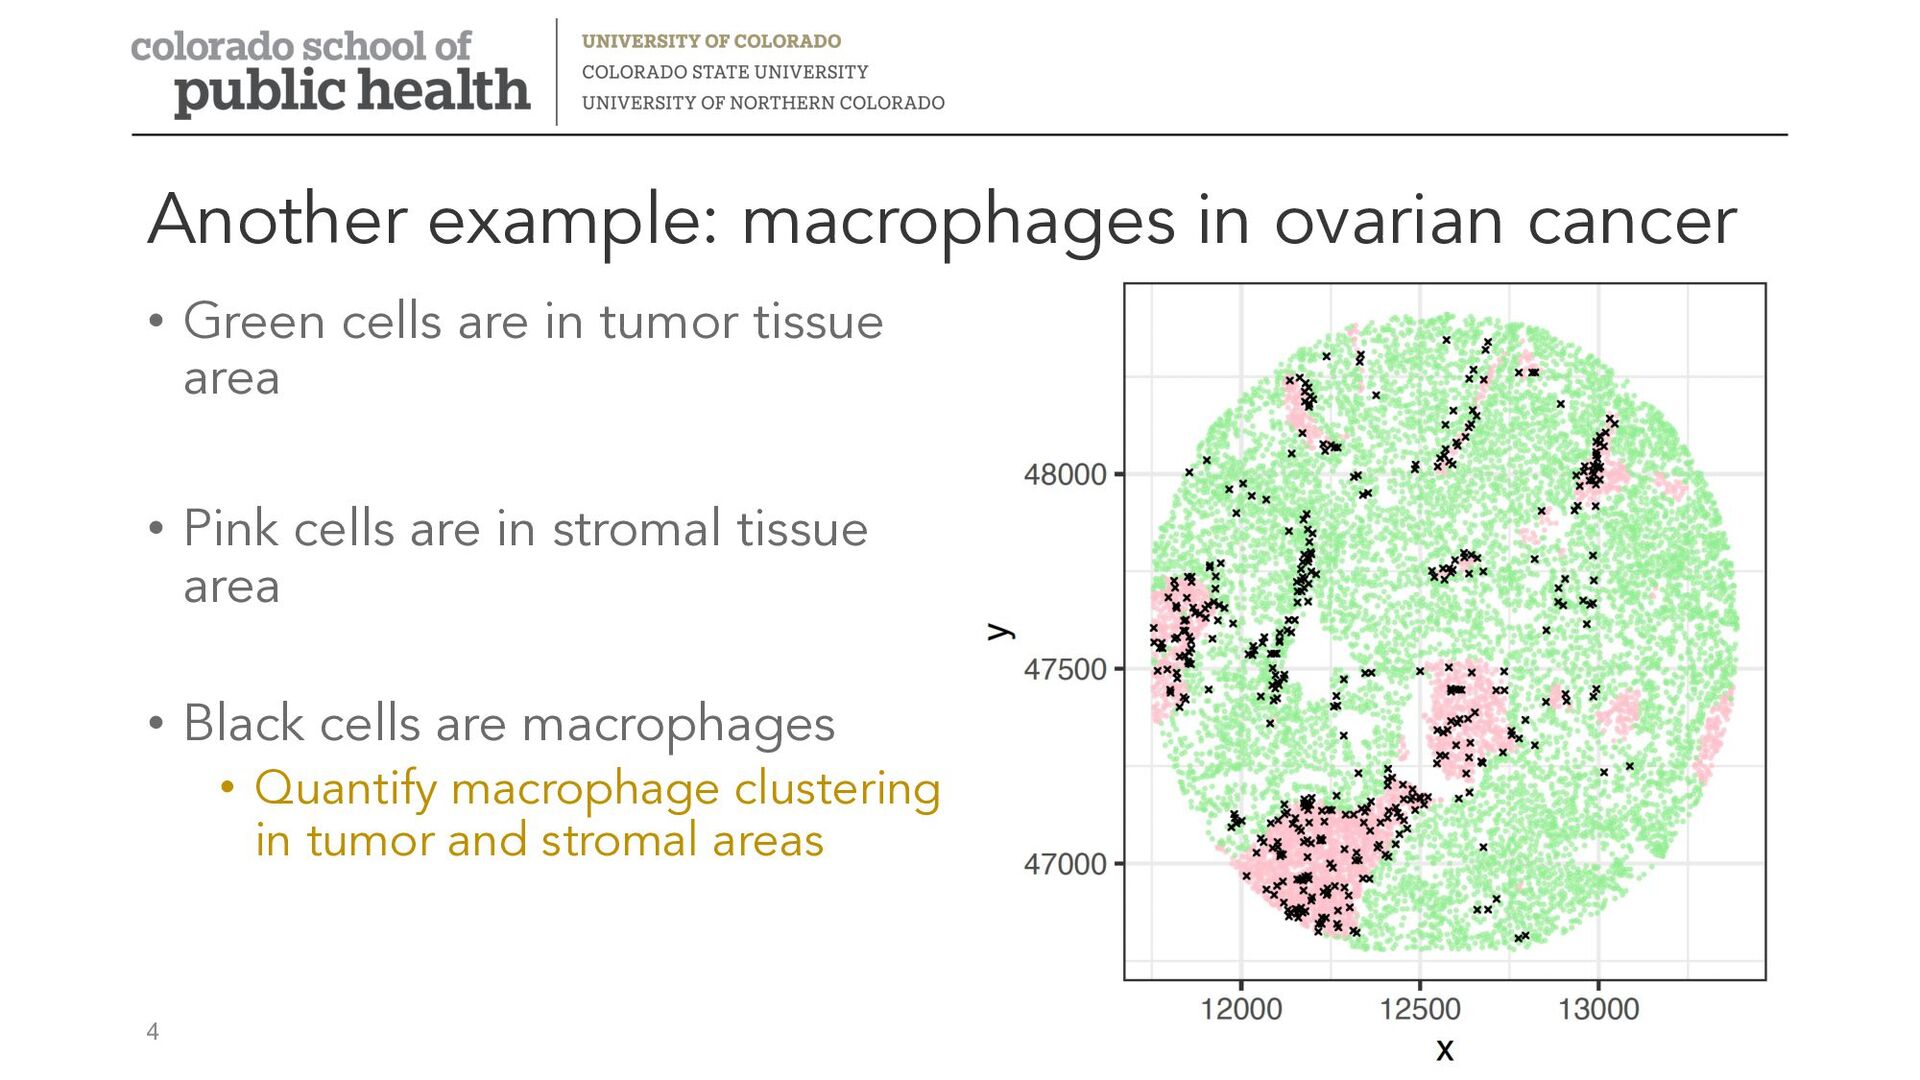
cells are in stromal tissue area • Black cells are macrophages • Quantify macrophage clustering in tumor and stromal areas Another example: macrophages in ovarian cancer 4
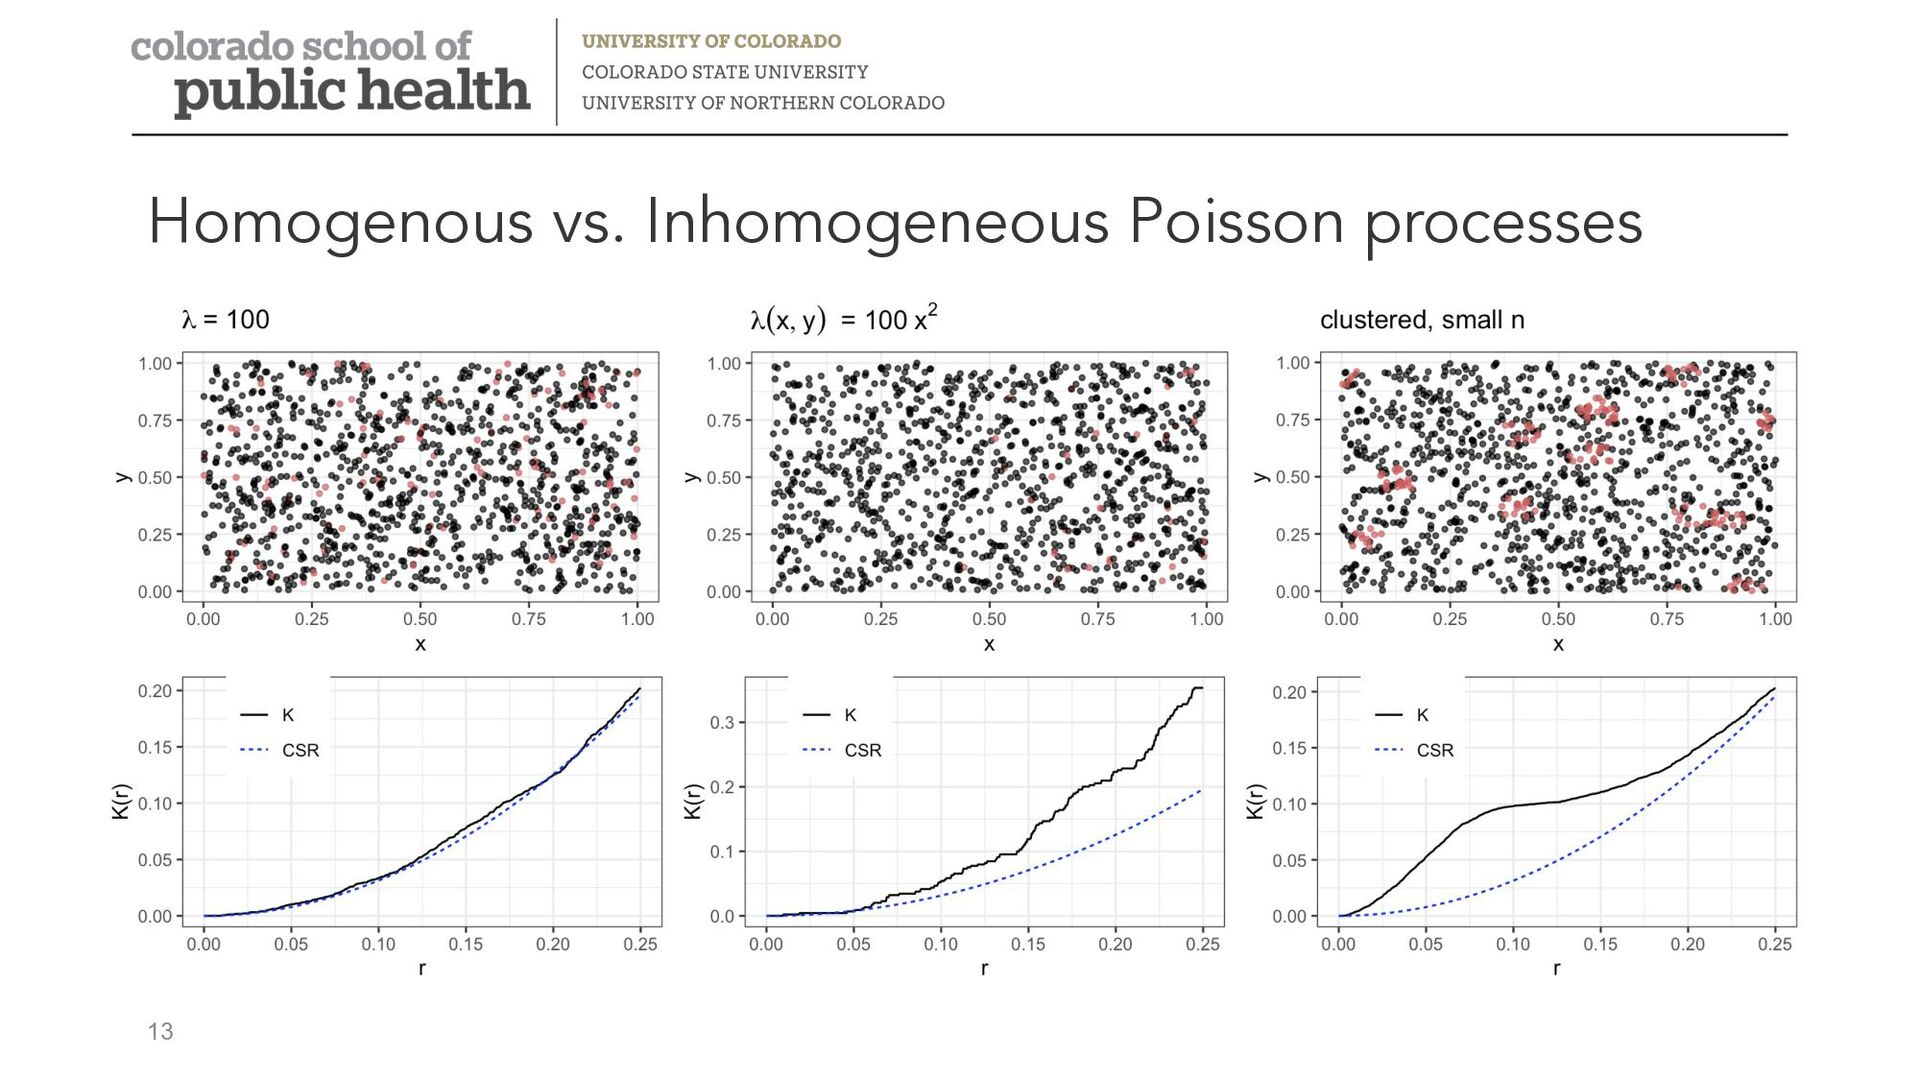
location of points in point pattern are random variables • Typically number of points n is also a random variable • Often to detect deviations from complete spatial randomness (CSR) • Clustering or repulsion Spatial summary functions based on point processes 5
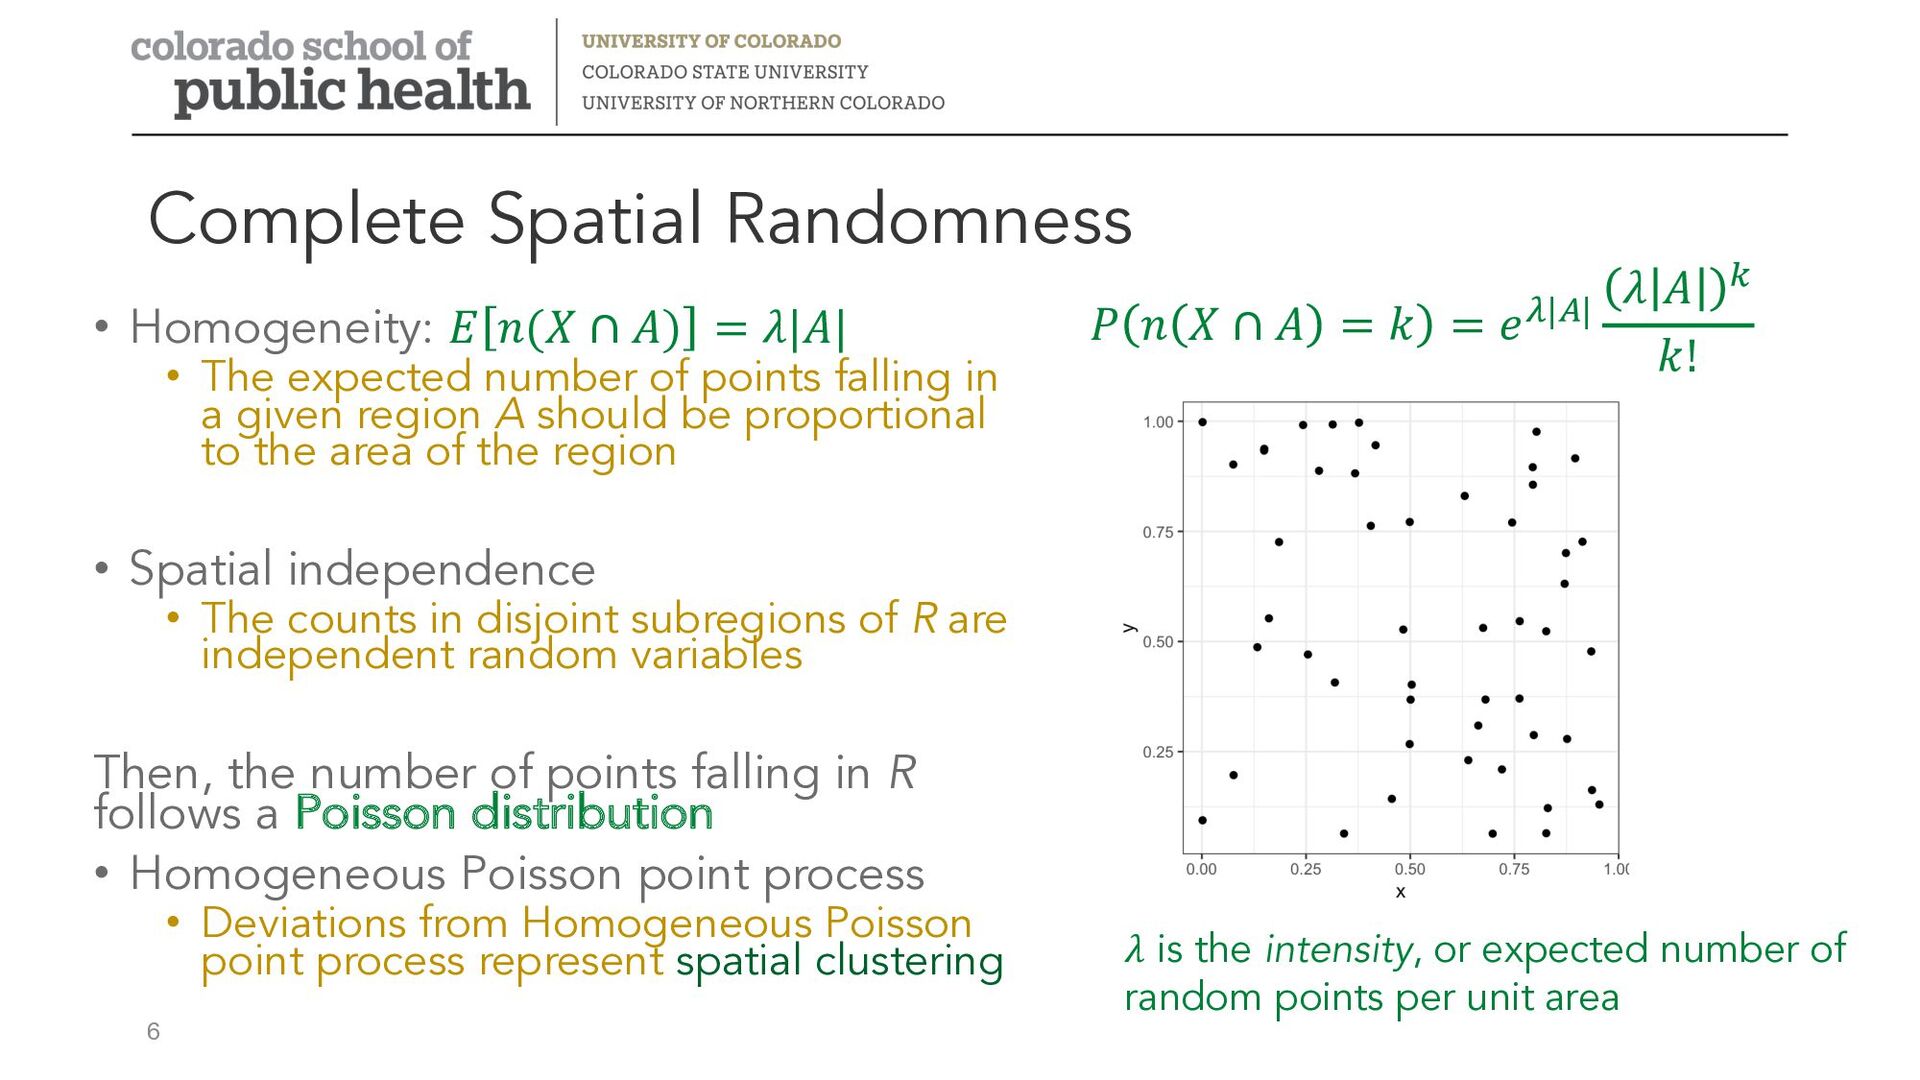
expected number of points falling in a given region A should be proportional to the area of the region • Spatial independence • The counts in disjoint subregions of R are independent random variables Then, the number of points falling in R follows a Poisson distribution • Homogeneous Poisson point process • Deviations from Homogeneous Poisson point process represent spatial clustering Complete Spatial Randomness 6 𝑃 𝑛 𝑋 ∩ 𝐴 = 𝑘 = 𝑒!|#| 𝜆 𝐴 $ 𝑘! 𝜆 is the intensity, or expected number of random points per unit area
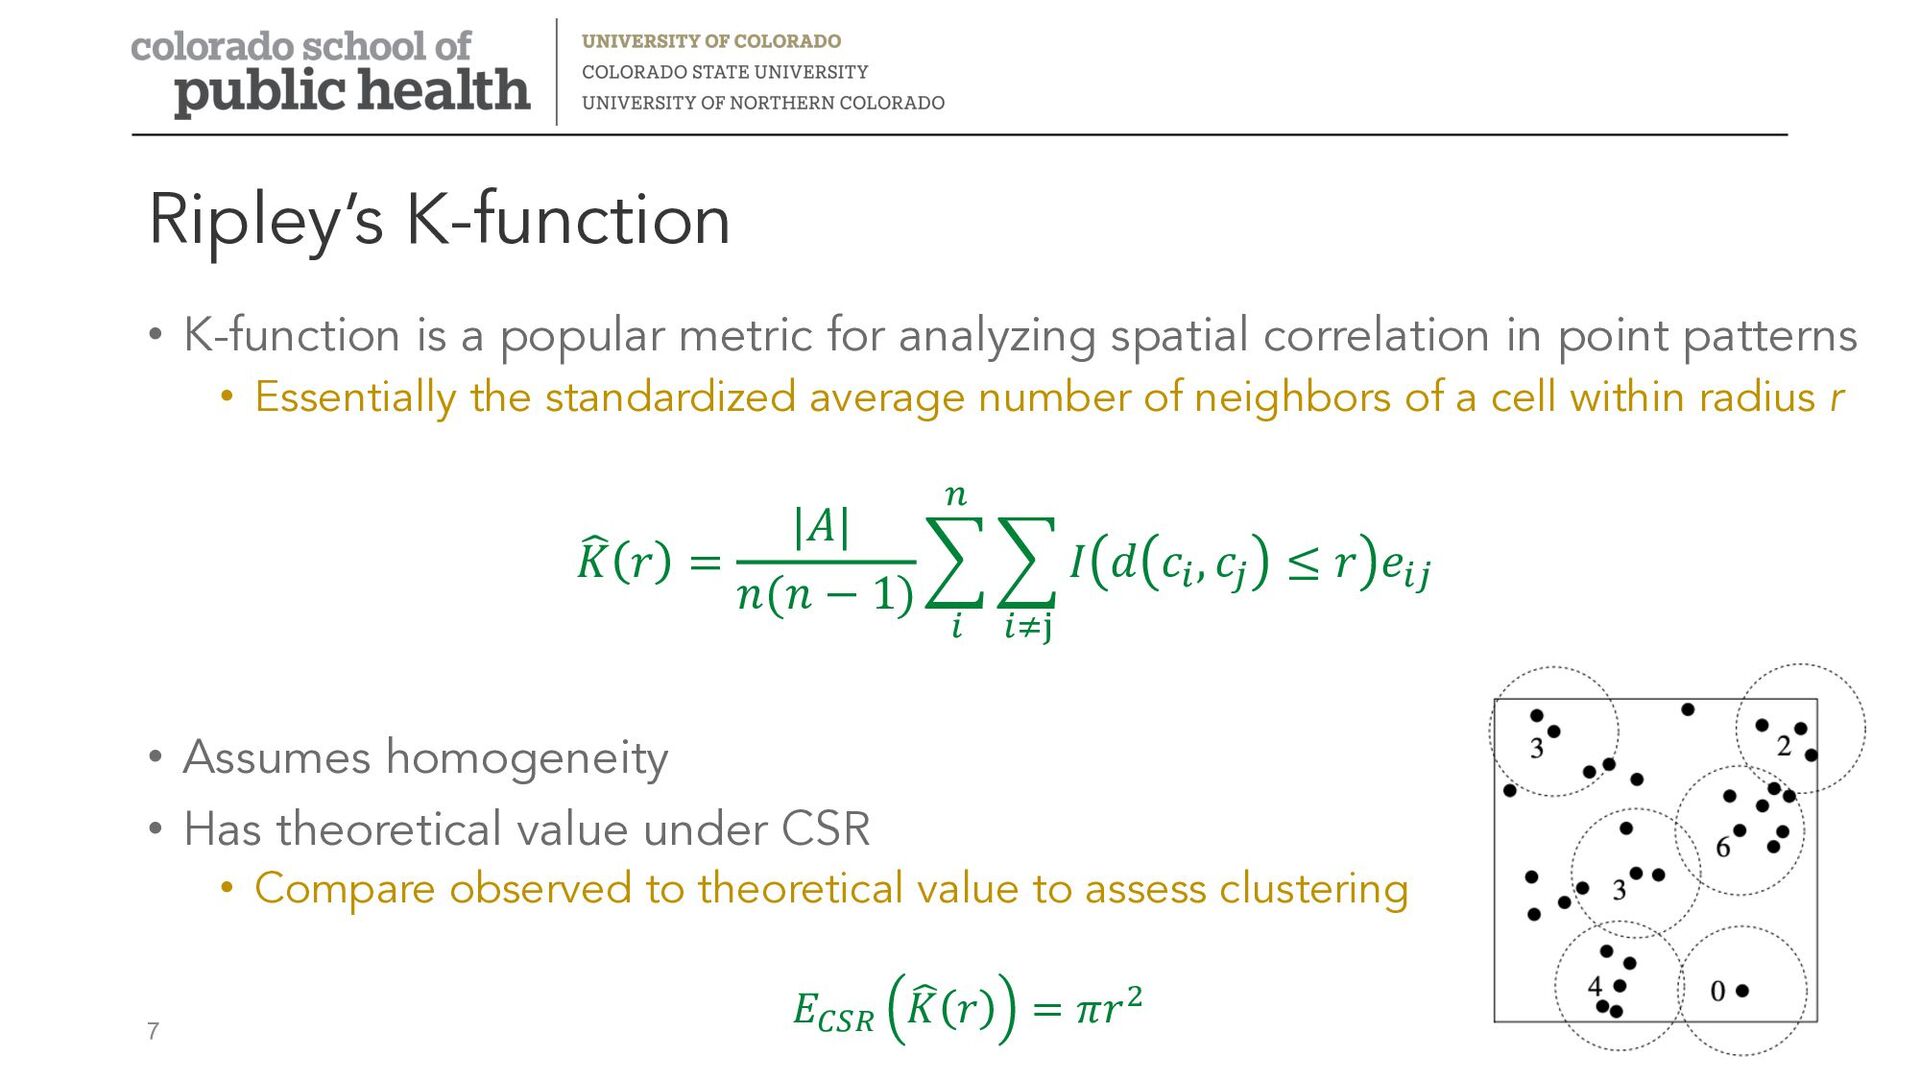
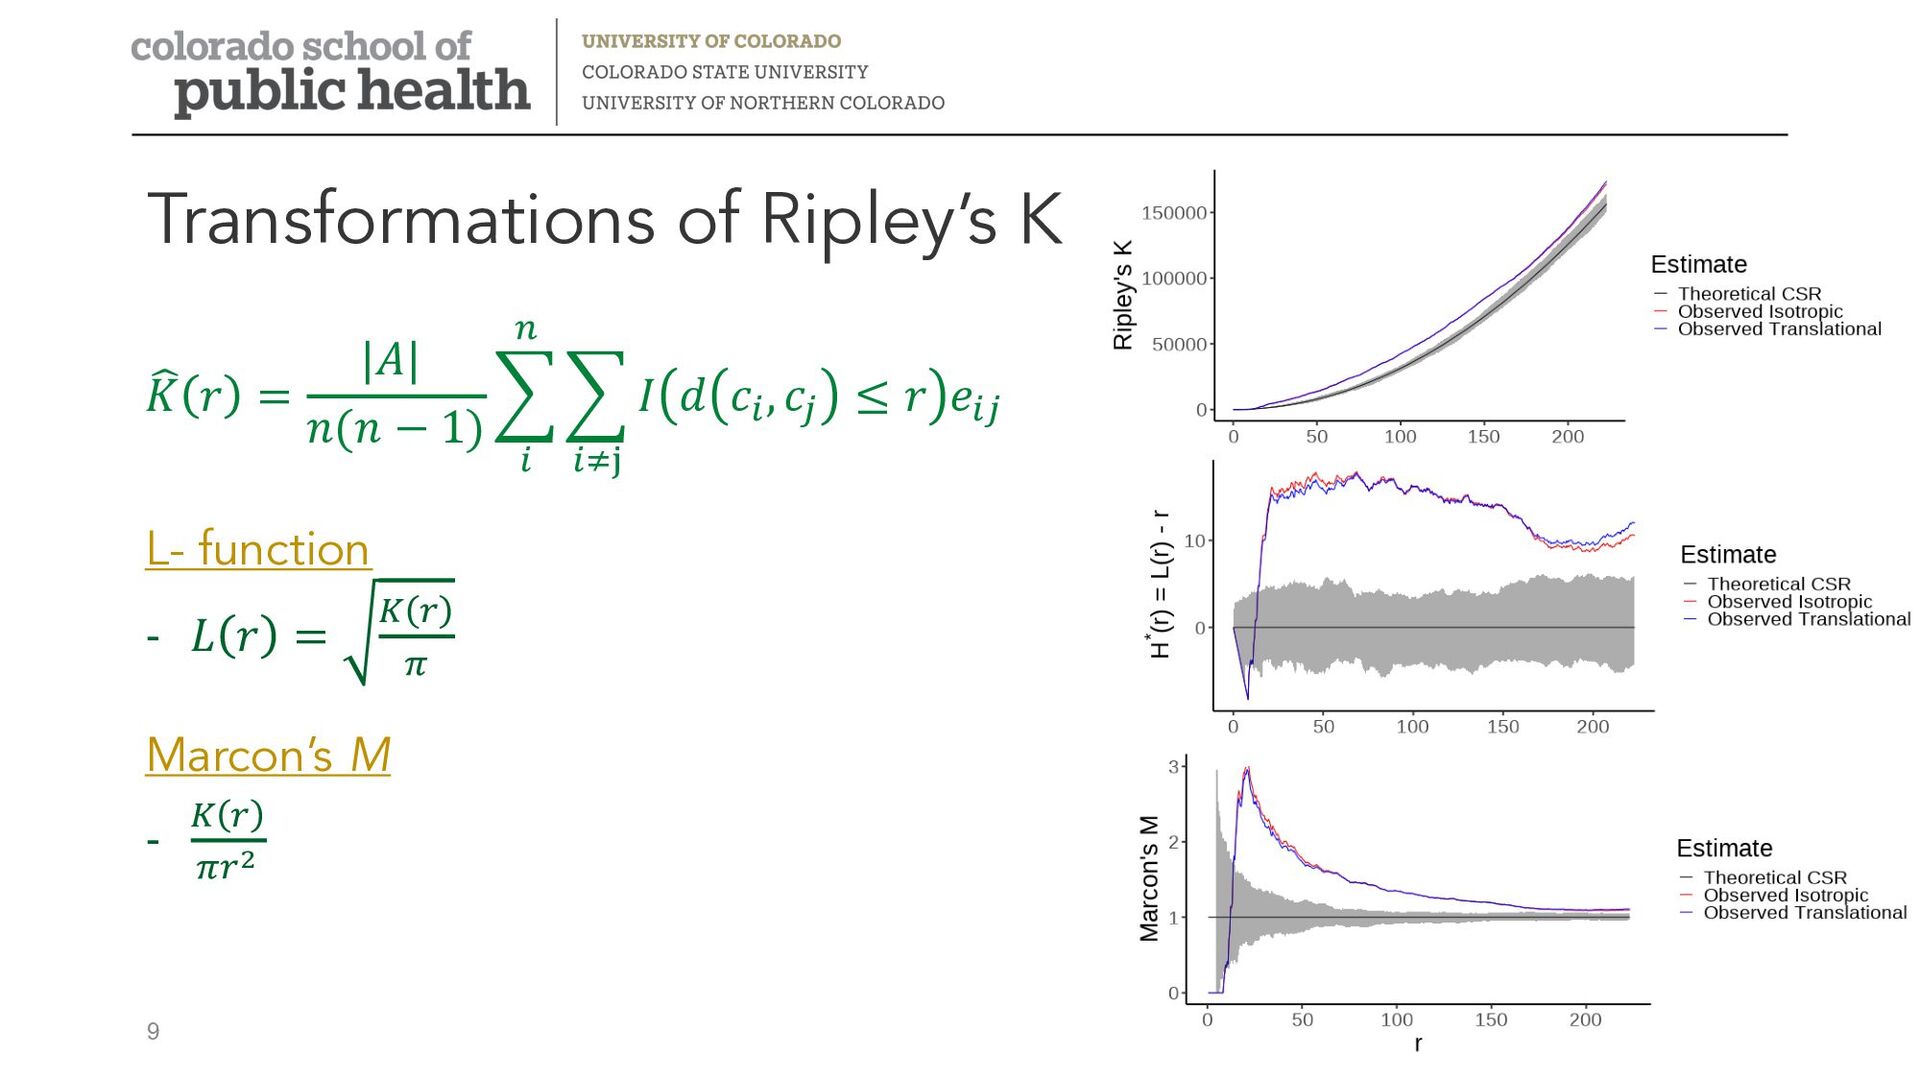
in point patterns • Essentially the standardized average number of neighbors of a cell within radius r / 𝐾 𝑟 = |𝐴| 𝑛(𝑛 − 1) 4 % & 4 %'( 𝐼 𝑑 𝑐%, 𝑐) ≤ 𝑟 𝑒%) • Assumes homogeneity • Has theoretical value under CSR • Compare observed to theoretical value to assess clustering 𝐸!"# " 𝐾 𝑟 = 𝜋𝑟$ Ripley’s K-function 7
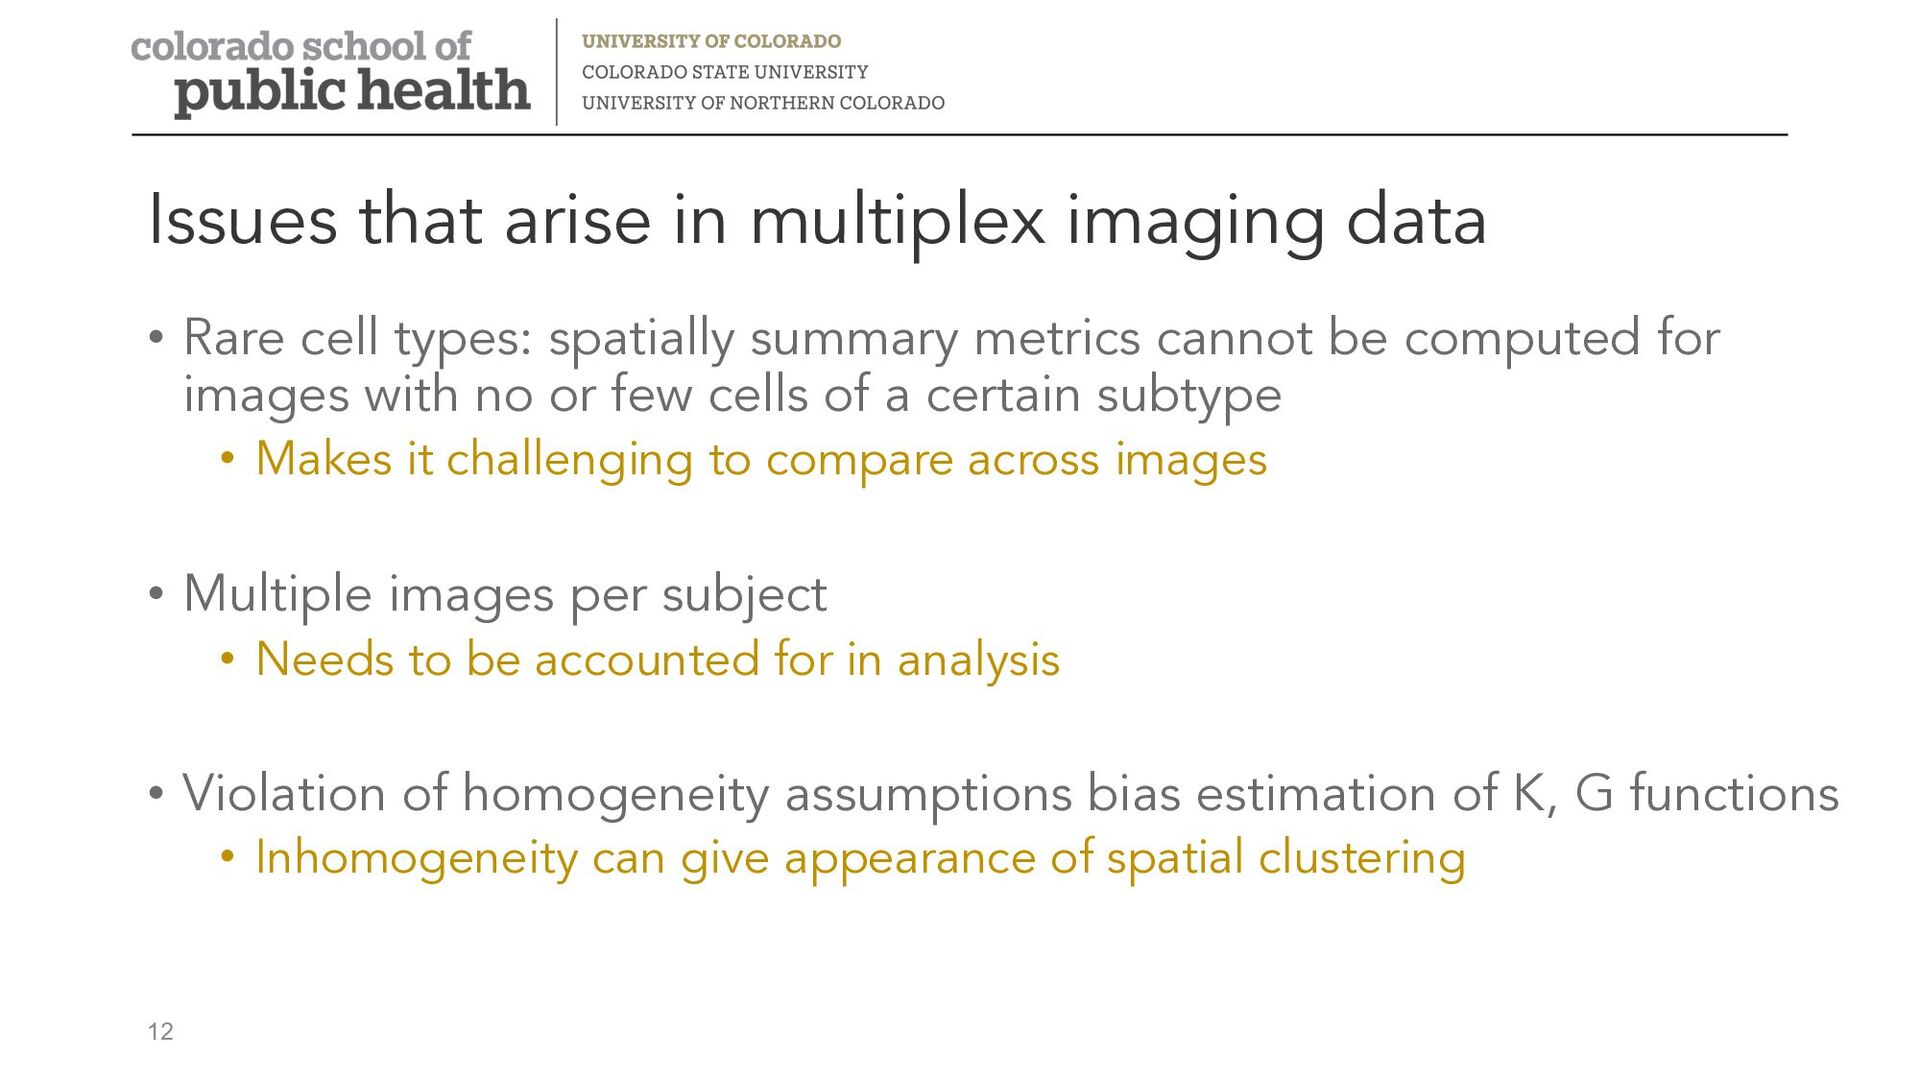
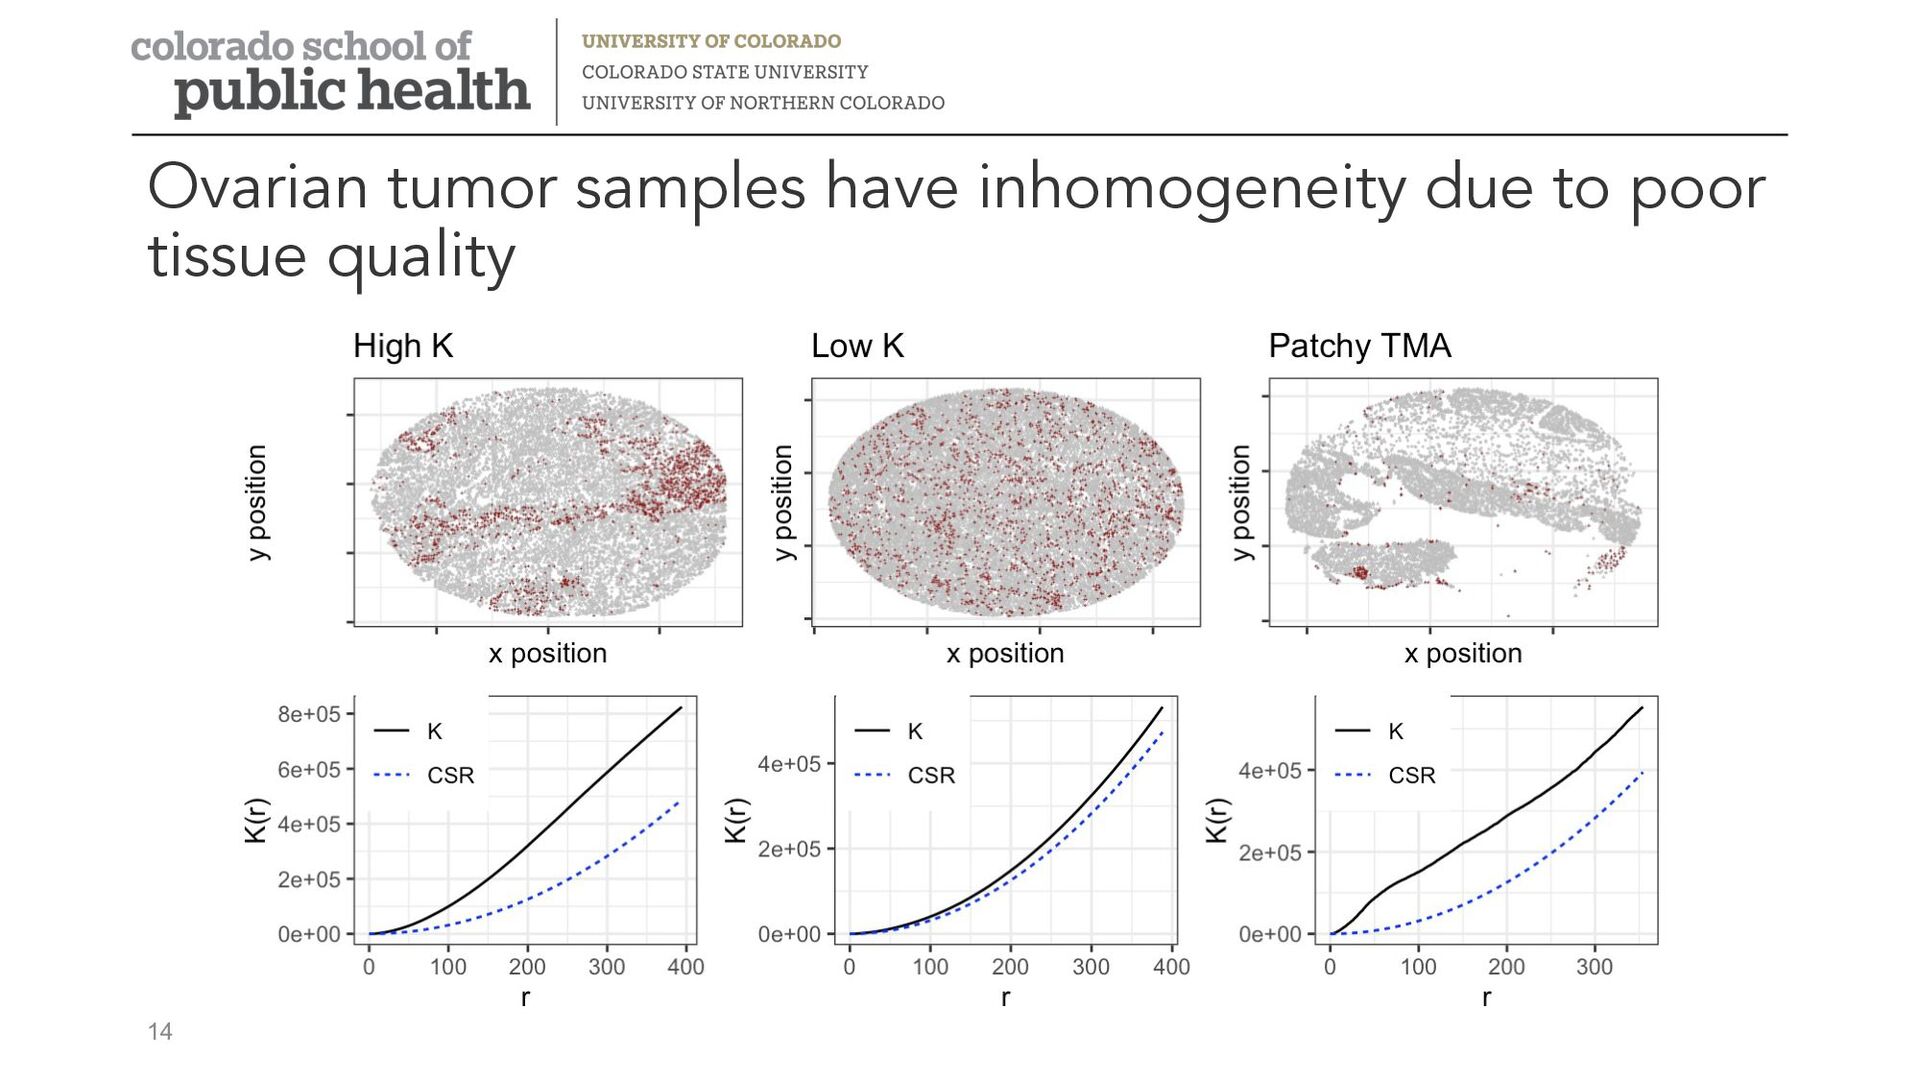
for images with no or few cells of a certain subtype • Makes it challenging to compare across images • Multiple images per subject • Needs to be accounted for in analysis • Violation of homogeneity assumptions bias estimation of K, G functions • Inhomogeneity can give appearance of spatial clustering Issues that arise in multiplex imaging data 12
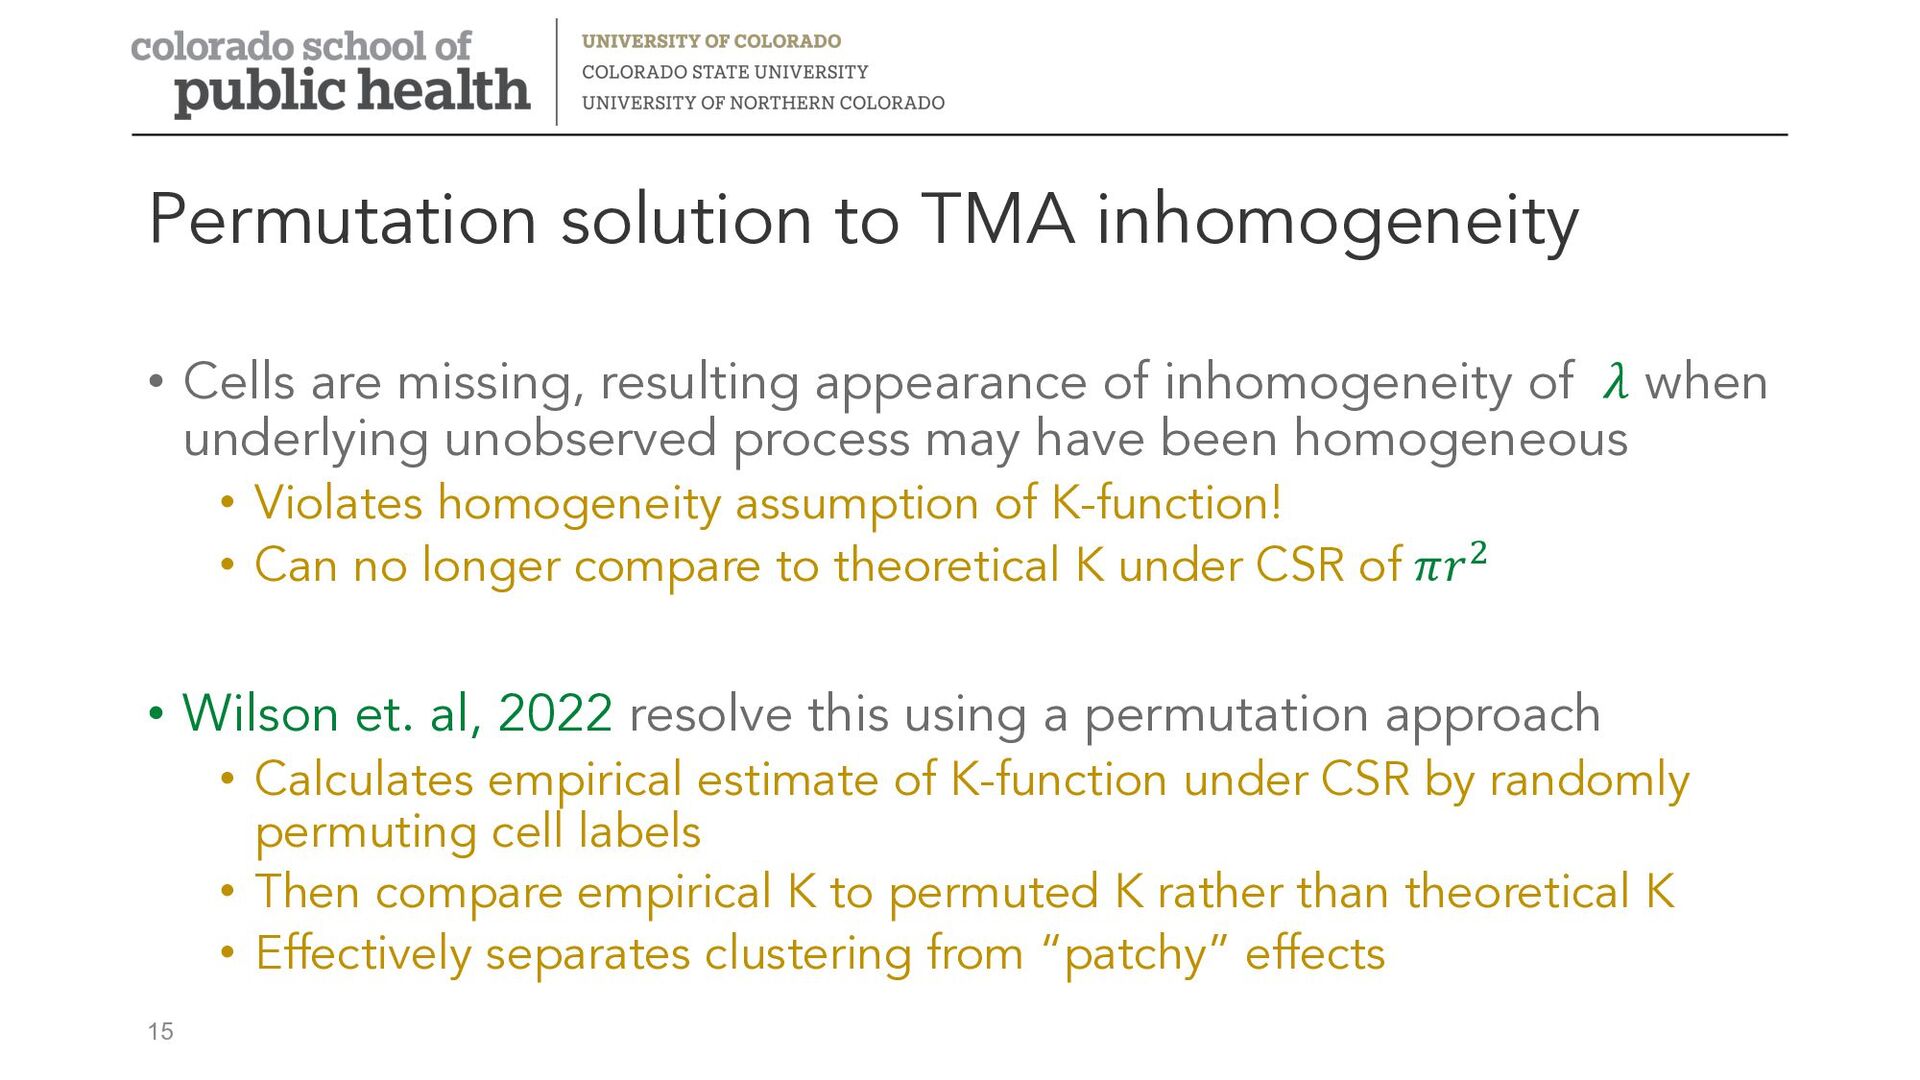
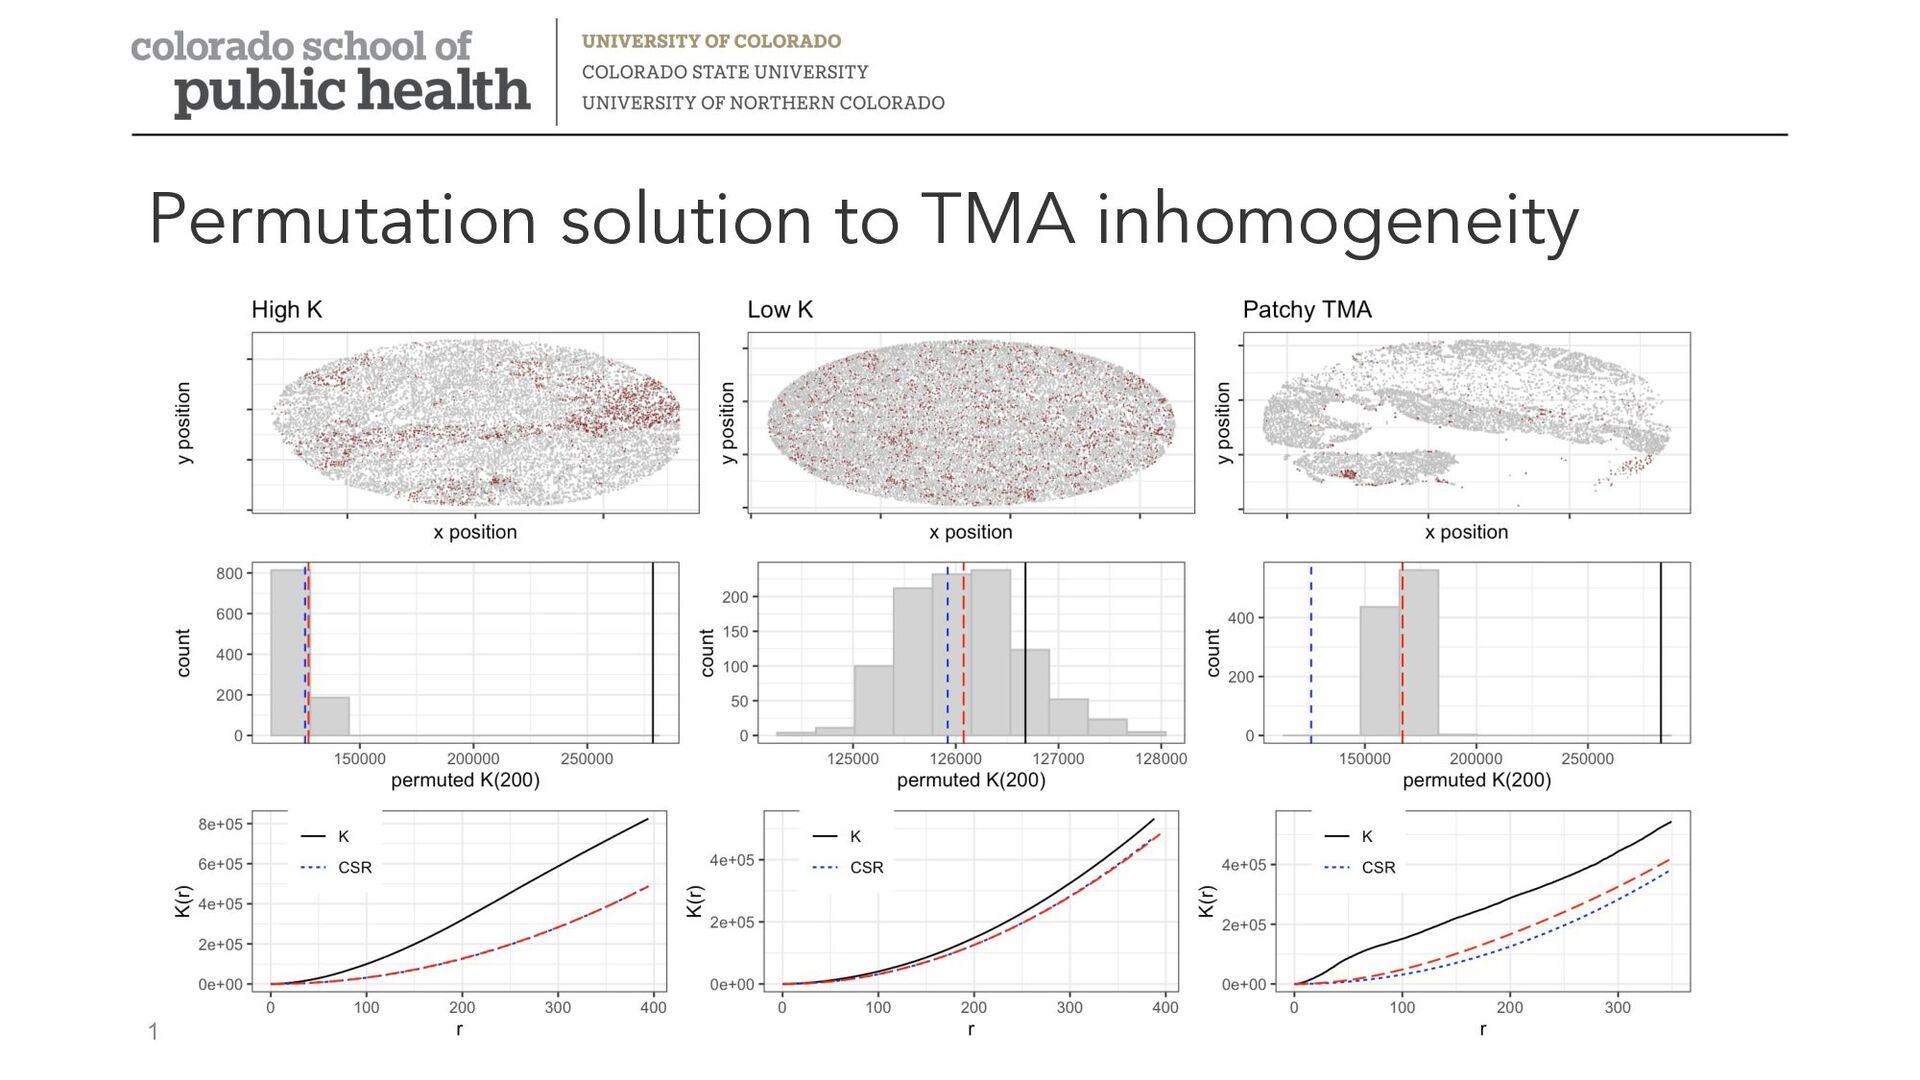
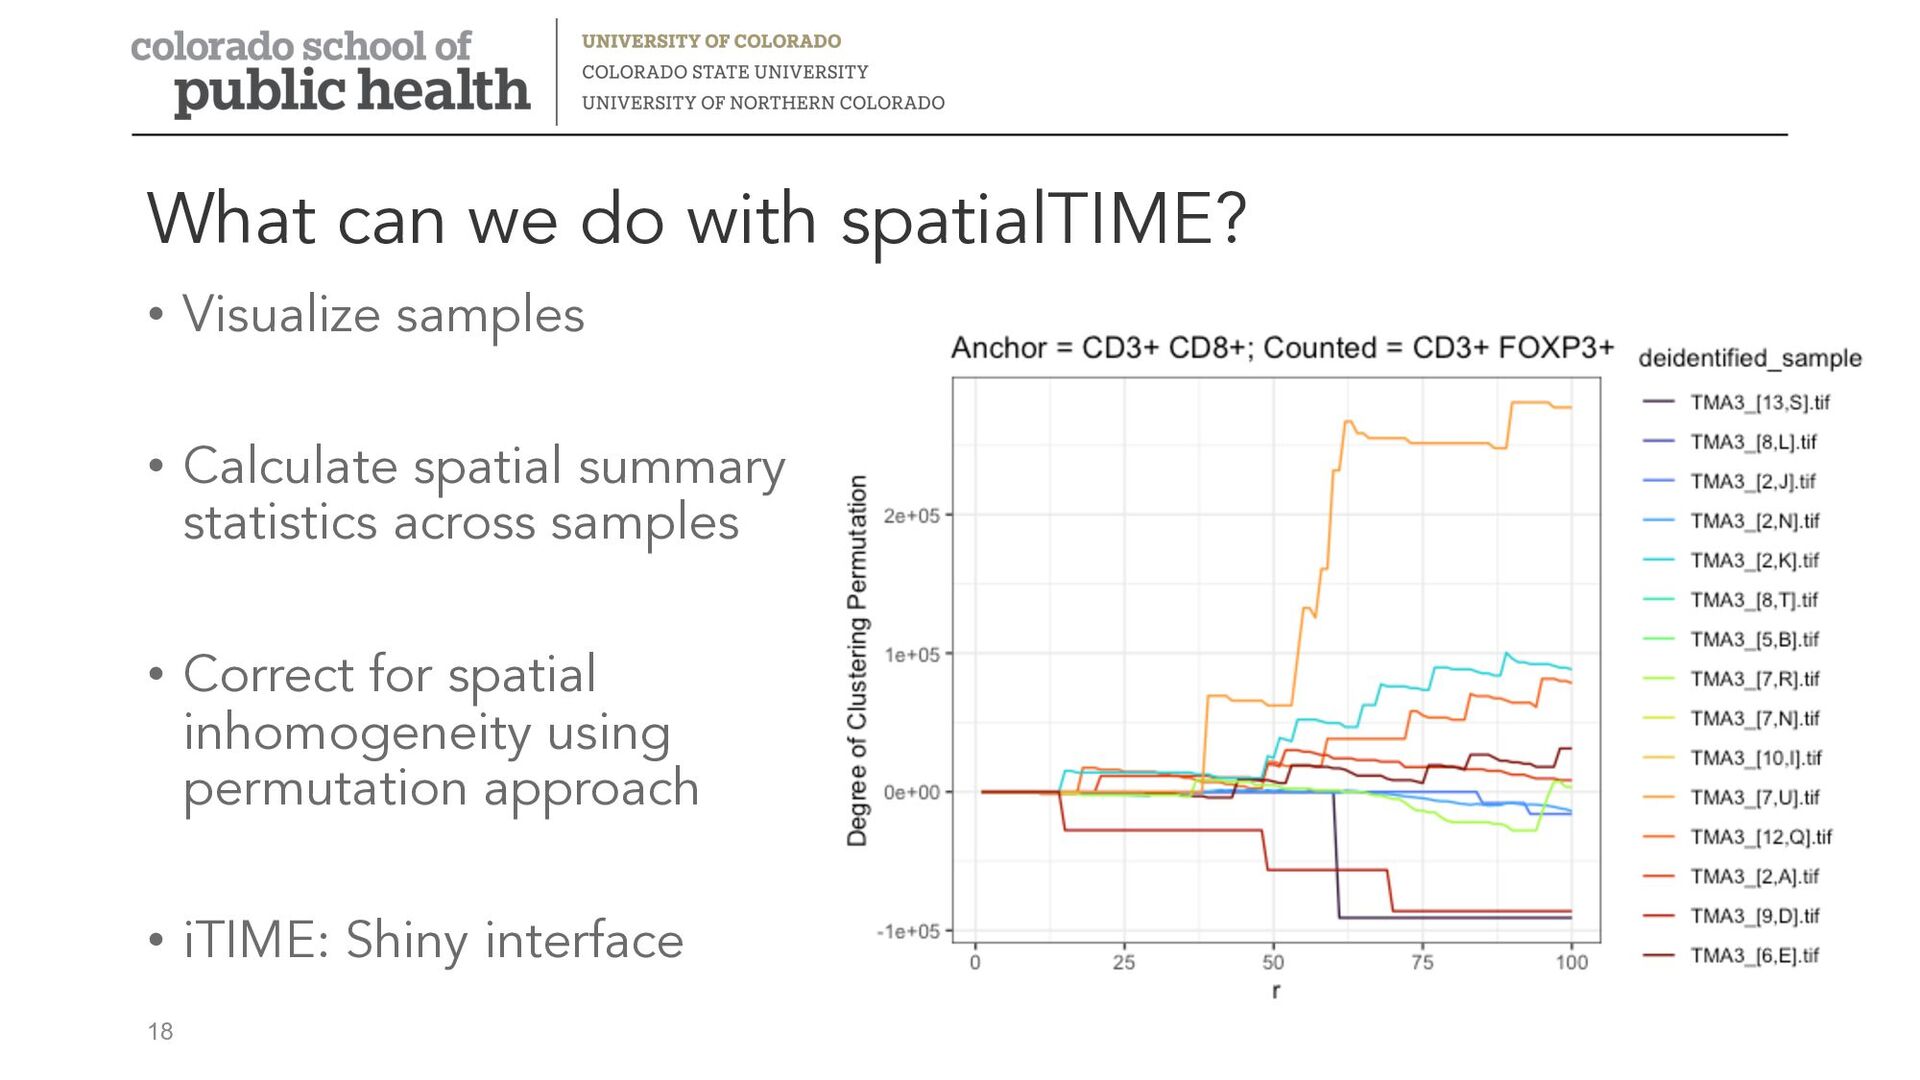
when underlying unobserved process may have been homogeneous • Violates homogeneity assumption of K-function! • Can no longer compare to theoretical K under CSR of 𝜋𝑟- • Wilson et. al, 2022 resolve this using a permutation approach • Calculates empirical estimate of K-function under CSR by randomly permuting cell labels • Then compare empirical K to permuted K rather than theoretical K • Effectively separates clustering from “patchy” effects Permutation solution to TMA inhomogeneity 15