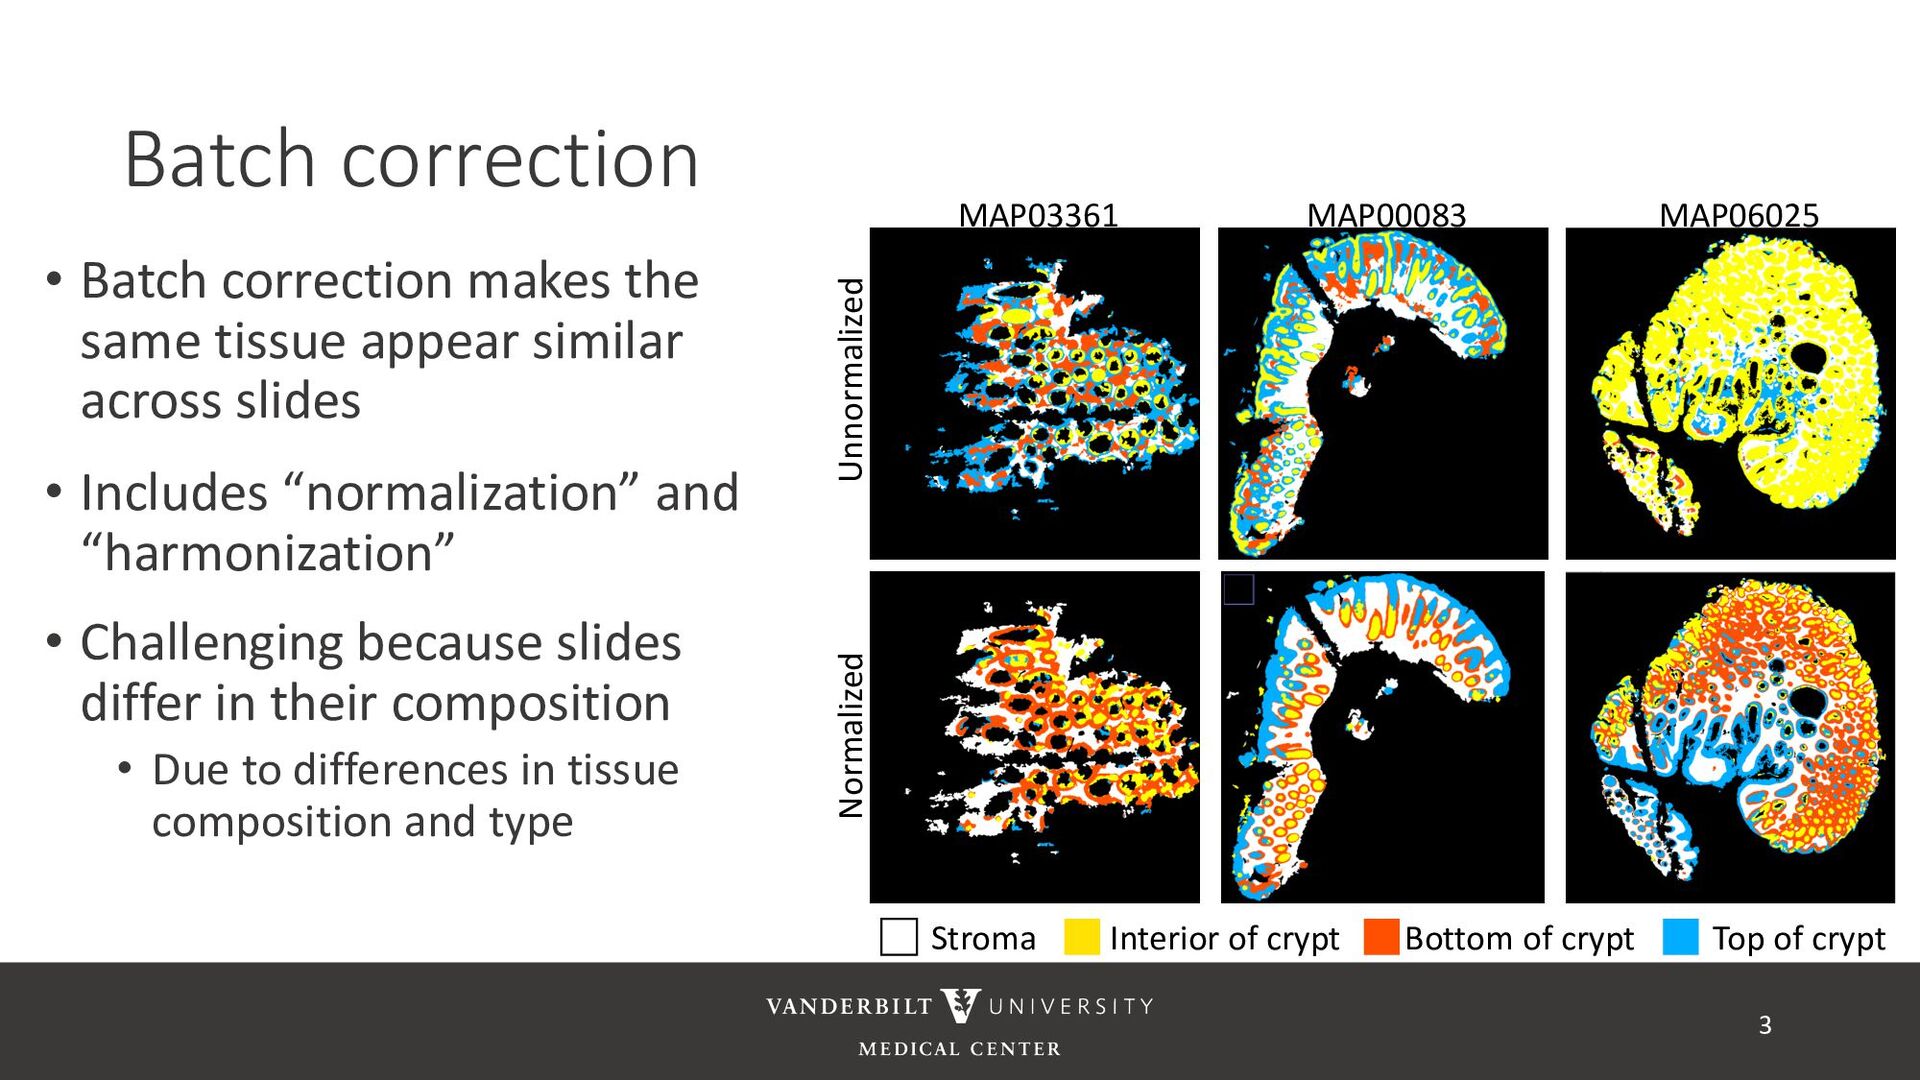
similar across slides • Includes “normalization” and “harmonization” • Challenging because slides differ in their composition • Due to differences in tissue composition and type 3 Unnormalized Normalized MAP06025 MAP00083 MAP03361 Bottom of crypt Interior of crypt Stroma Top of crypt
to make it more amenable to downstream analysis • Normalization – adjusts data distribution to make it more similar across batches • Harmonization • adjusts data distribution conserving covariate effects to make it more similar across batches • Uses information across slides 5
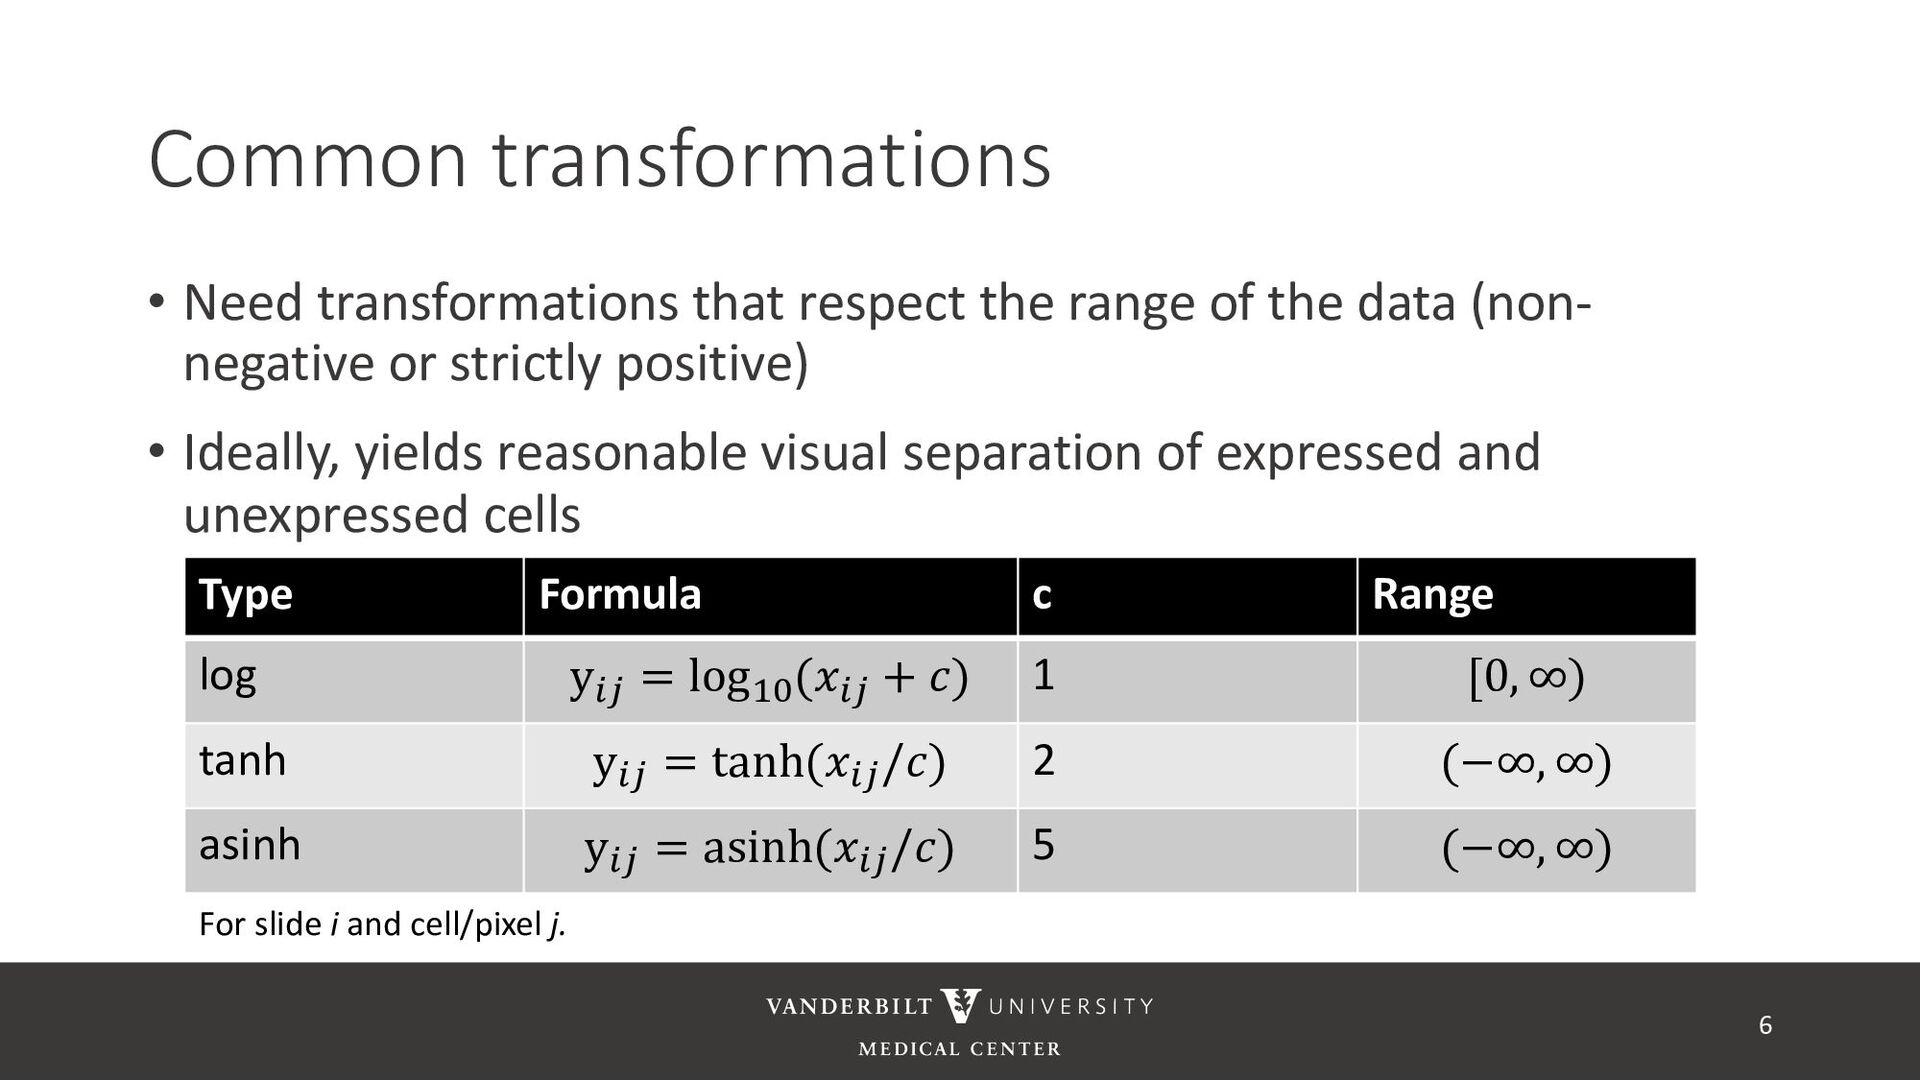
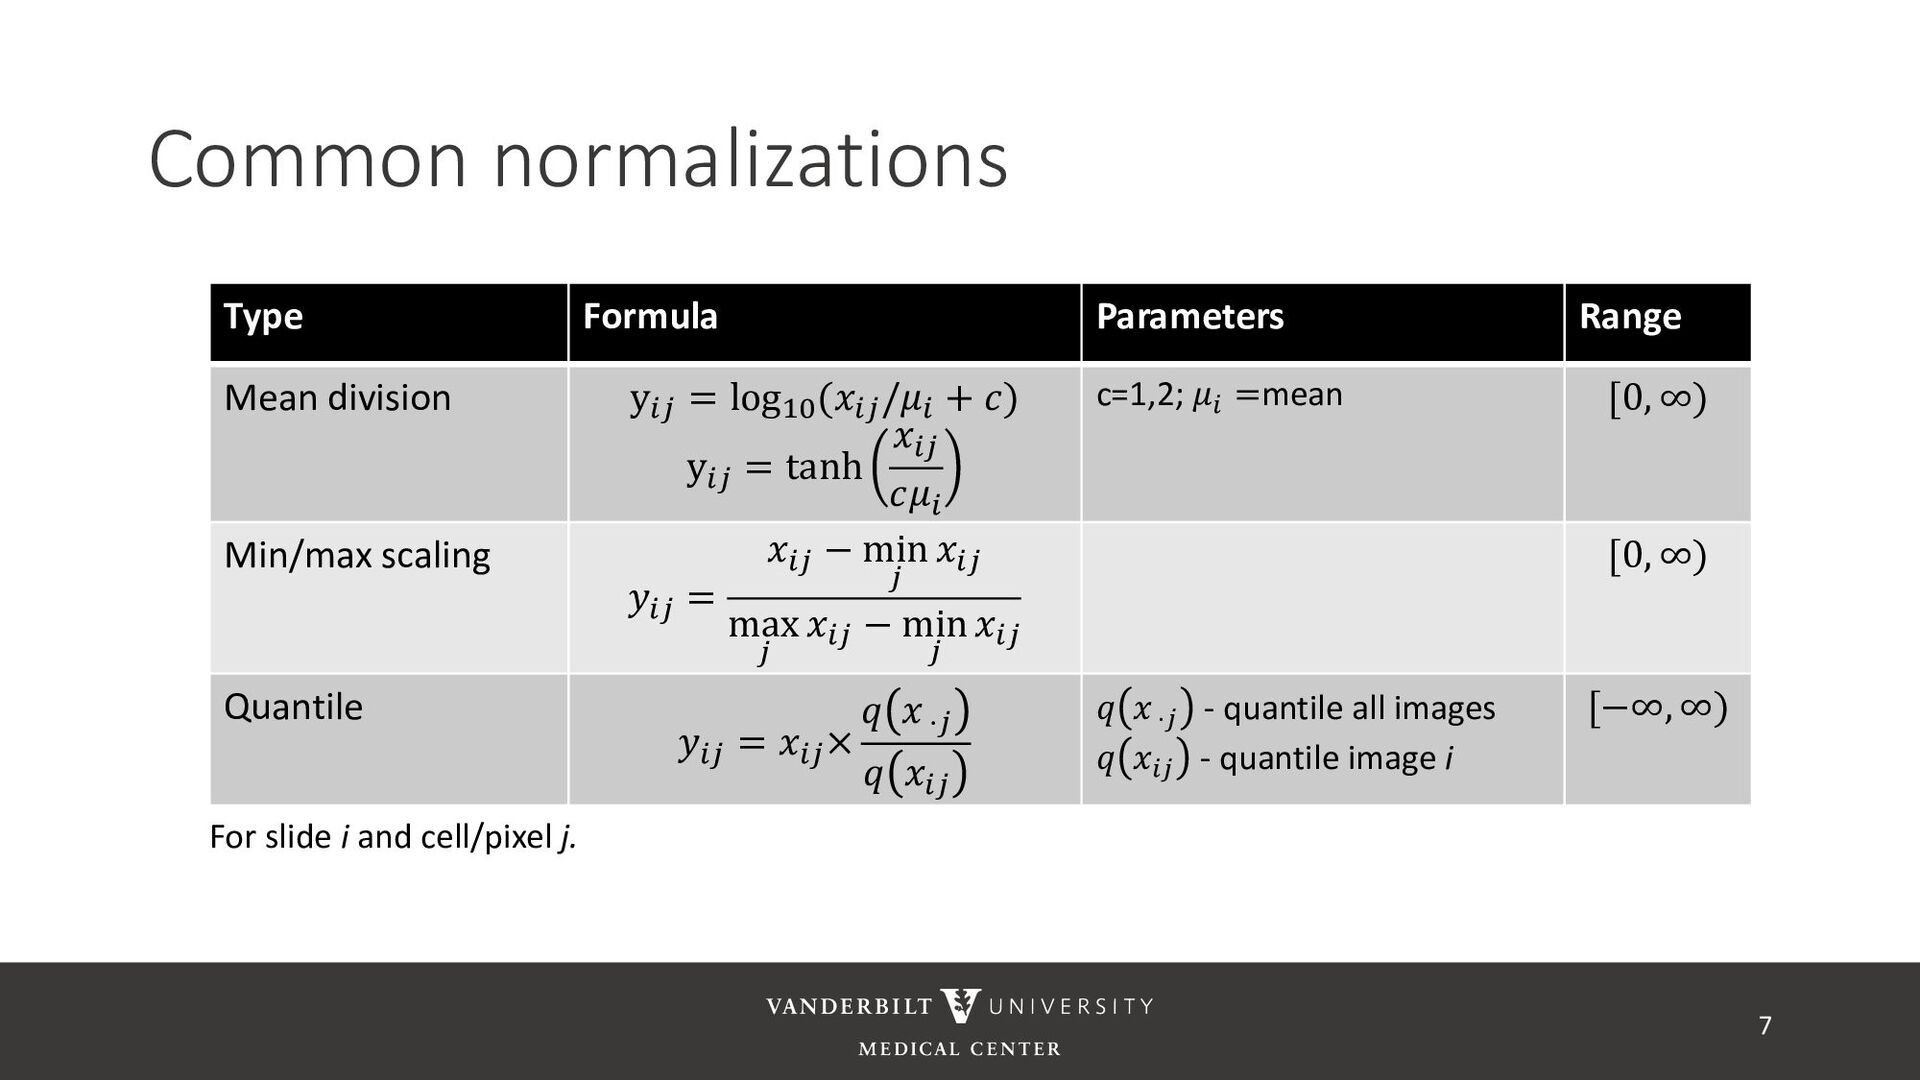
the data (non- negative or strictly positive) • Ideally, yields reasonable visual separation of expressed and unexpressed cells 6 Type Formula c Range log y!" = log#$ (𝑥!" + 𝑐) 1 [0, ∞) tanh y!" = tanh(𝑥!" /𝑐) 2 (−∞, ∞) asinh y!" = asinh(𝑥!"/𝑐) 5 (−∞, ∞) For slide i and cell/pixel j.
based on Poisson noise • Min-max scaling is bad • Pointless if images are bounded by precision of the image (e.g. 8 bit precision) • Maximum is usually a noisy parameter and technically unbounded – highly volatile normalization • Normalizations that result in normally distributed data do not get good separation of expressed and unexpressed cells (anecdotally) • Z-normalization does not respect boundedness of the data 8
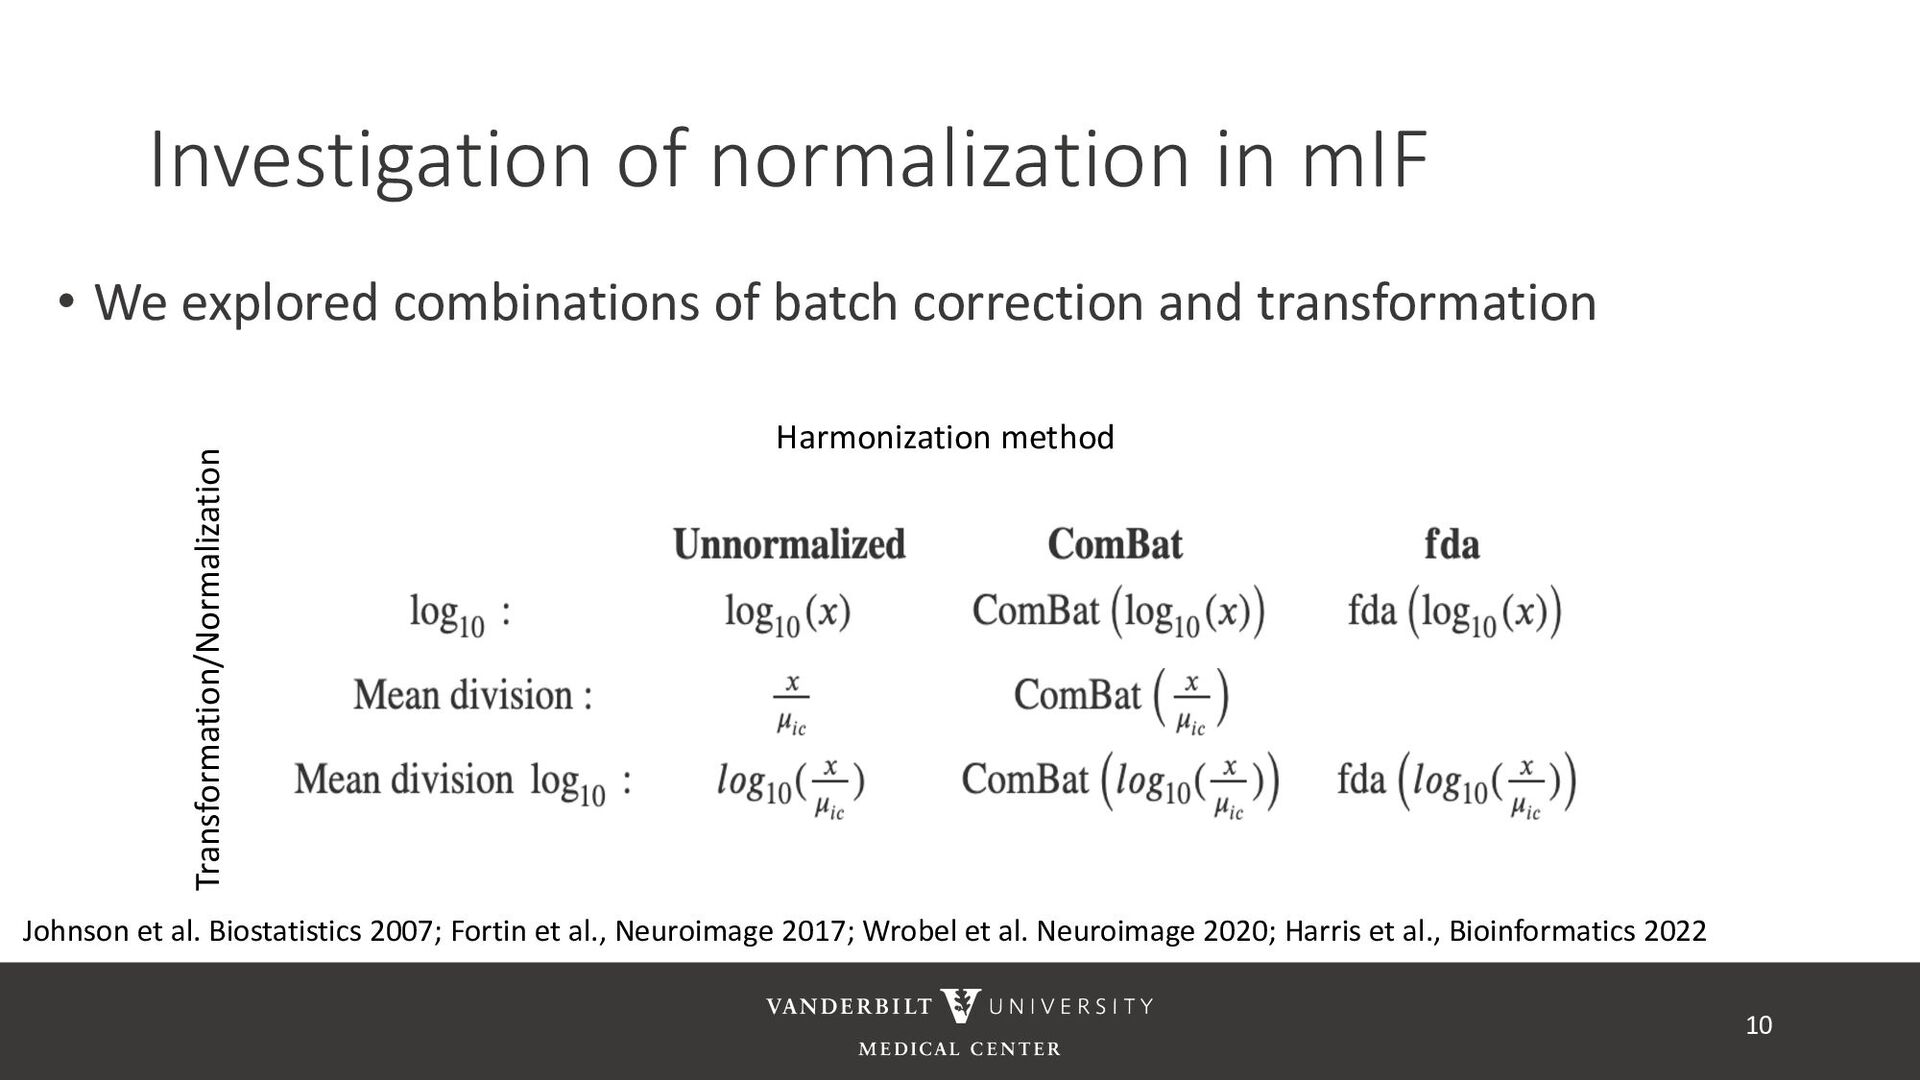
batch correction and transformation 10 Johnson et al. Biostatistics 2007; Fortin et al., Neuroimage 2017; Wrobel et al. Neuroimage 2020; Harris et al., Bioinformatics 2022 Harmonization method Transformation/Normalization
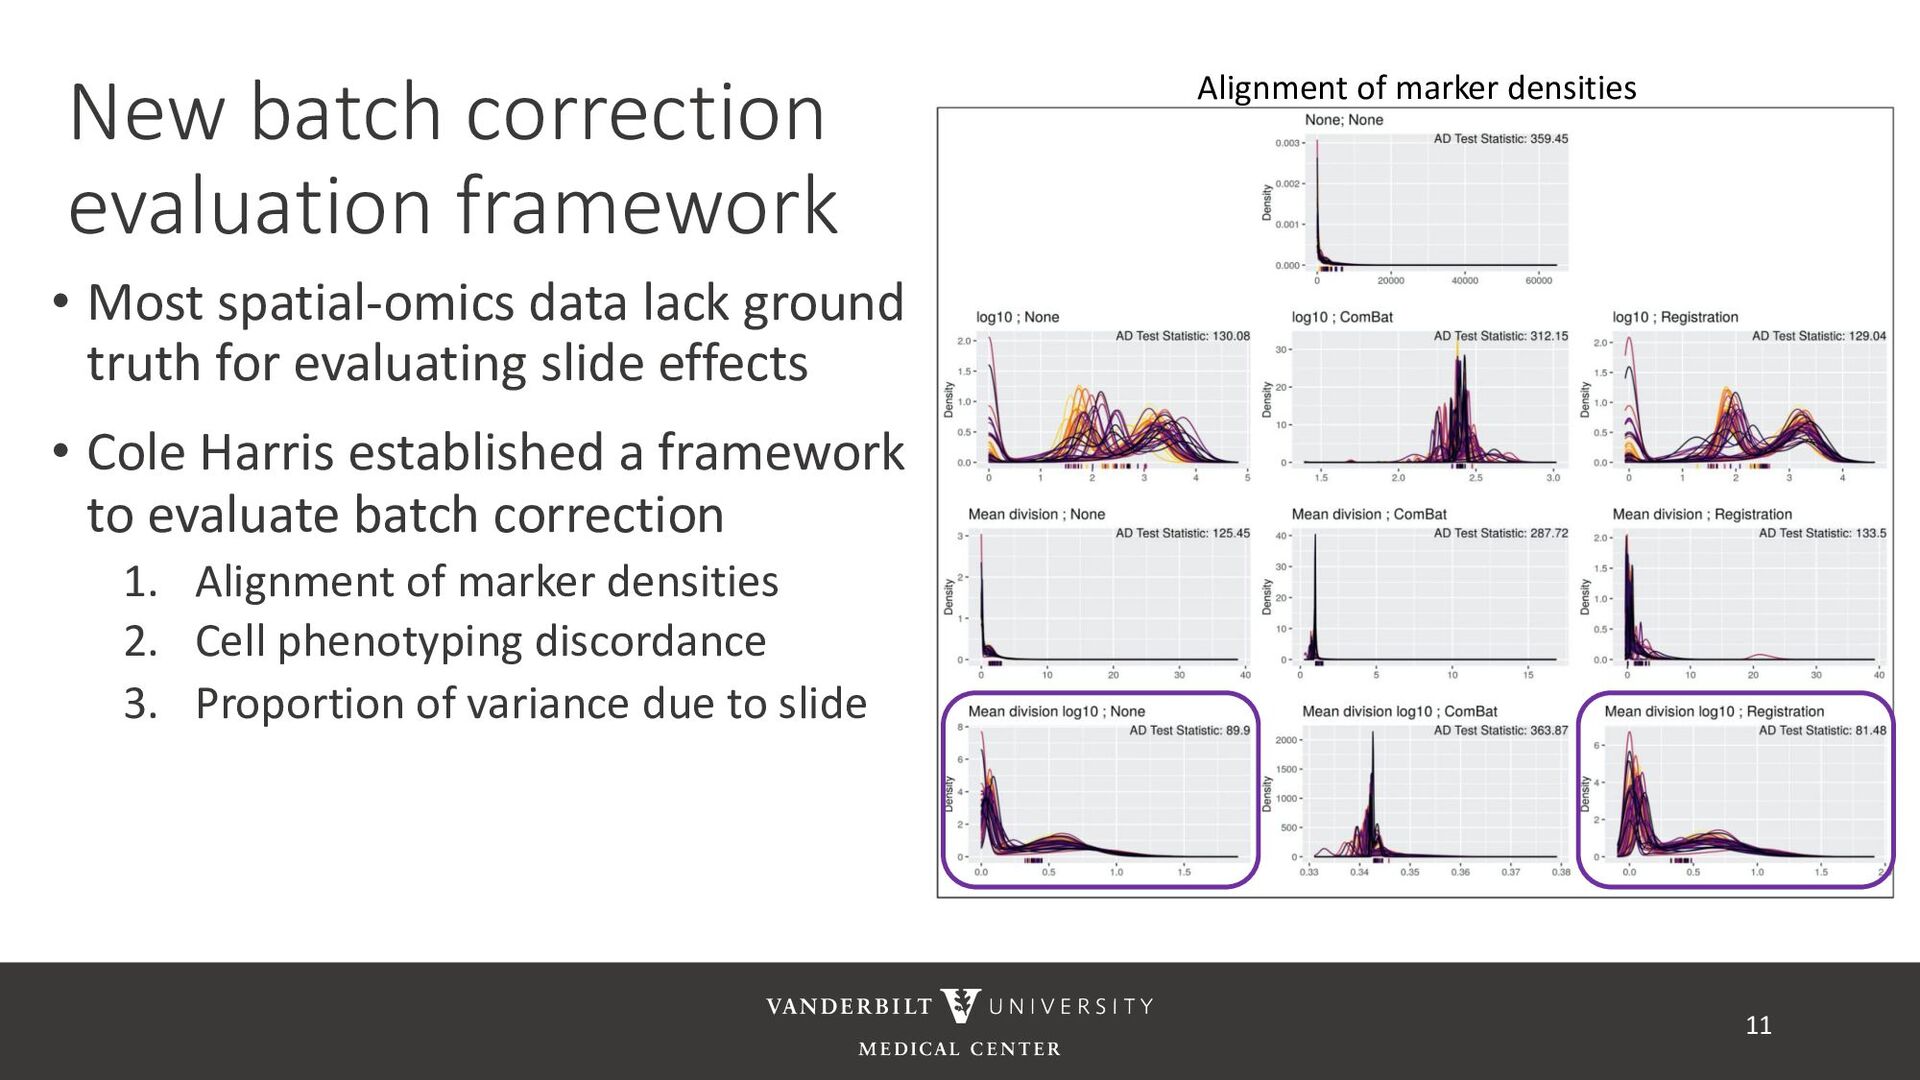
ground truth for evaluating slide effects • Cole Harris established a framework to evaluate batch correction 1. Alignment of marker densities 2. Cell phenotyping discordance 3. Proportion of variance due to slide 11 Alignment of marker densities
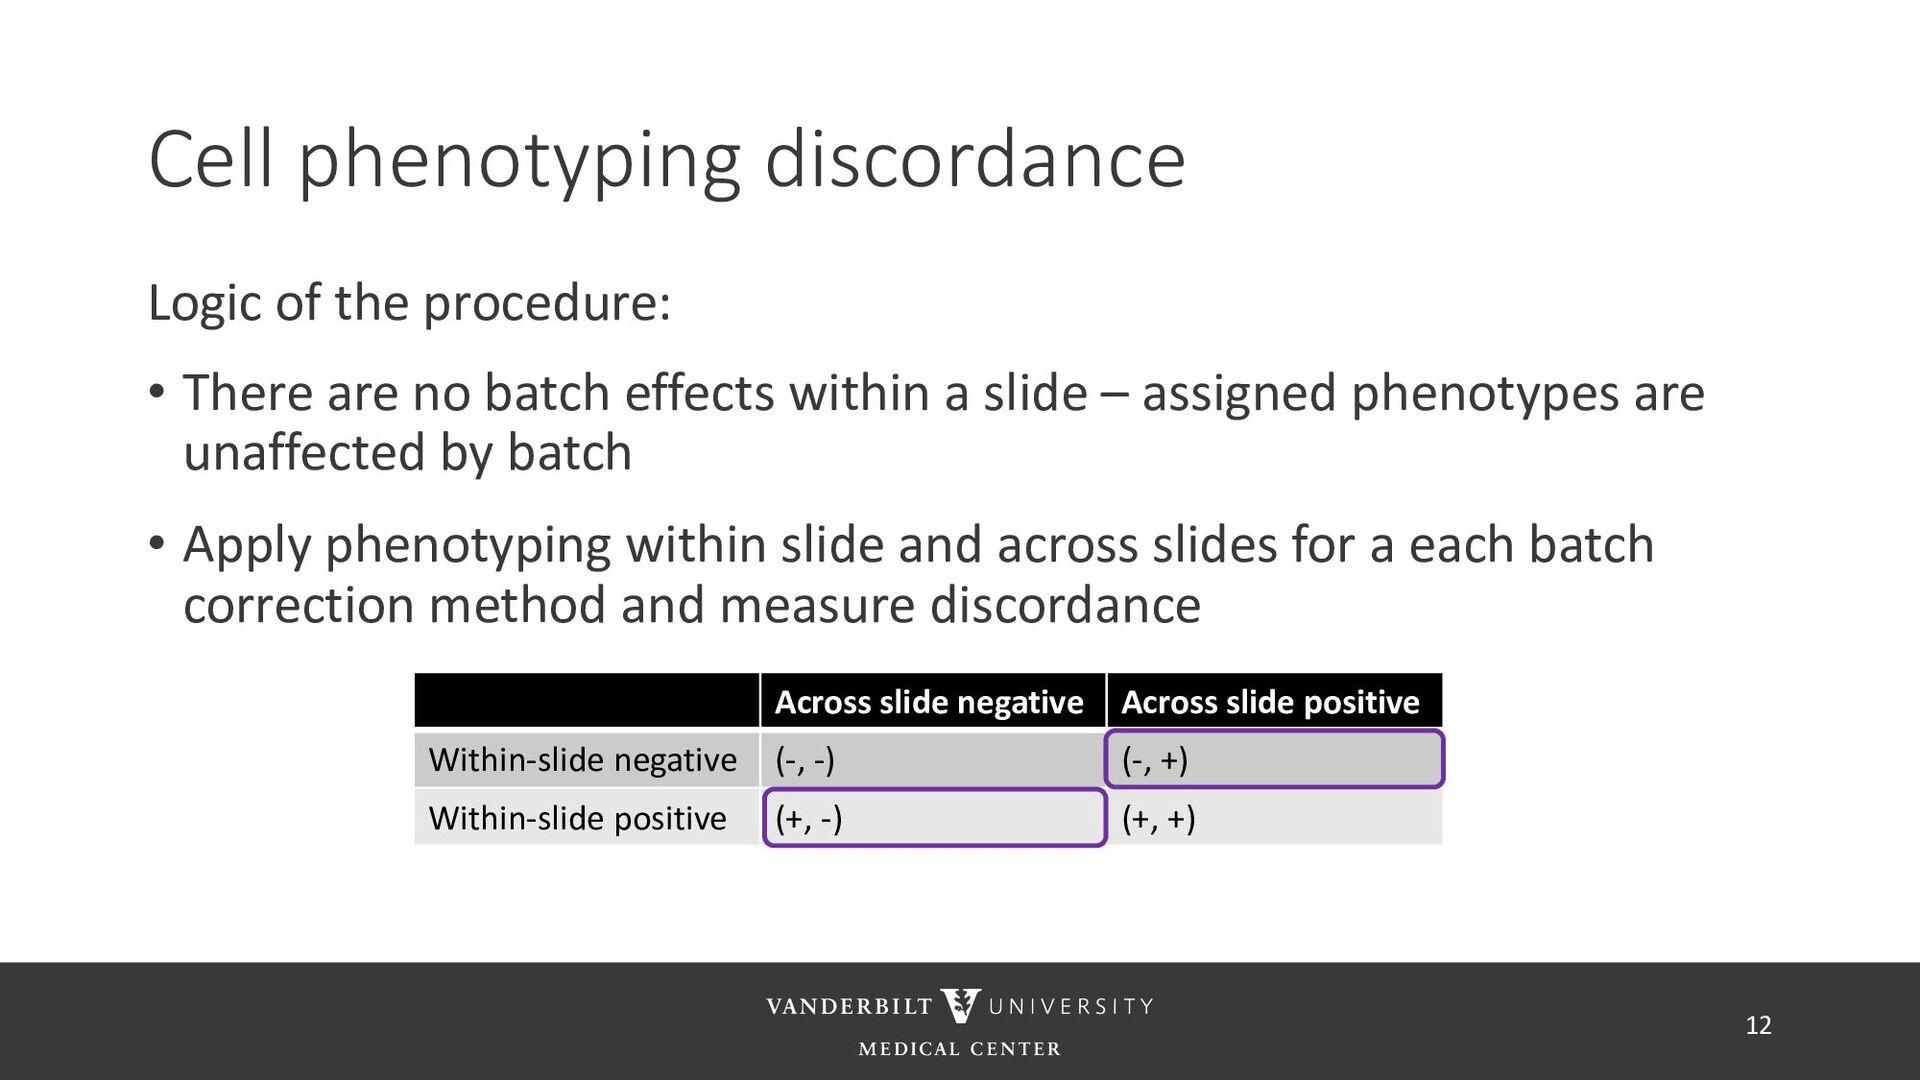
no batch effects within a slide – assigned phenotypes are unaffected by batch • Apply phenotyping within slide and across slides for a each batch correction method and measure discordance 12 Across slide negative Across slide positive Within-slide negative (-, -) (-, +) Within-slide positive (+, -) (+, +)
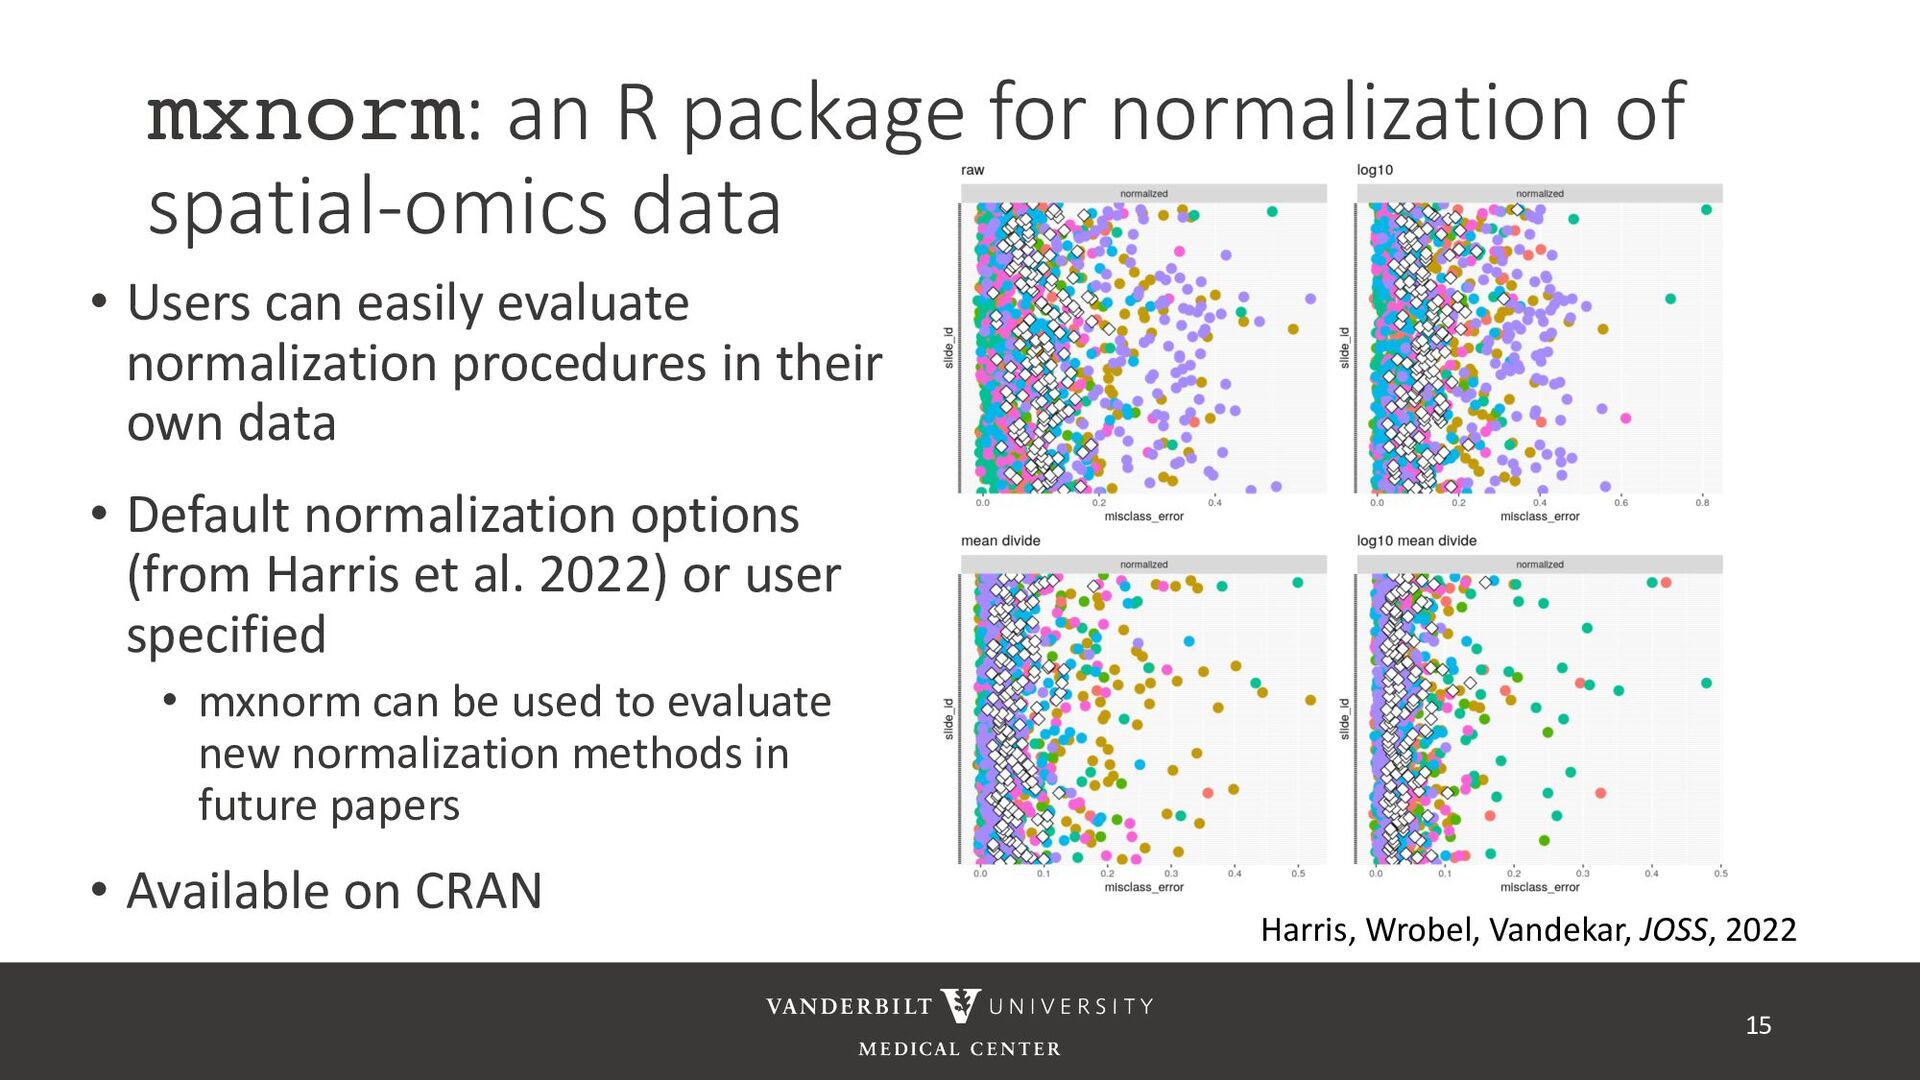
Users can easily evaluate normalization procedures in their own data • Default normalization options (from Harris et al. 2022) or user specified • mxnorm can be used to evaluate new normalization methods in future papers • Available on CRAN 15 Harris, Wrobel, Vandekar, JOSS, 2022
widely used and adapted from other fields • Harmonization-based batch correction methods have not been well developed or evaluated • It is likely that normalization is insufficient • Room for new methods development 16
annotated training data) • ASTIR – unsupervised clustering, but takes a yaml file defining cell types • A mixture model assuming transformed data are log-normal • Uses variational Bayes for estimation with neural networks as variational distribution • GammaGateR – semi-supervised marker gating 20
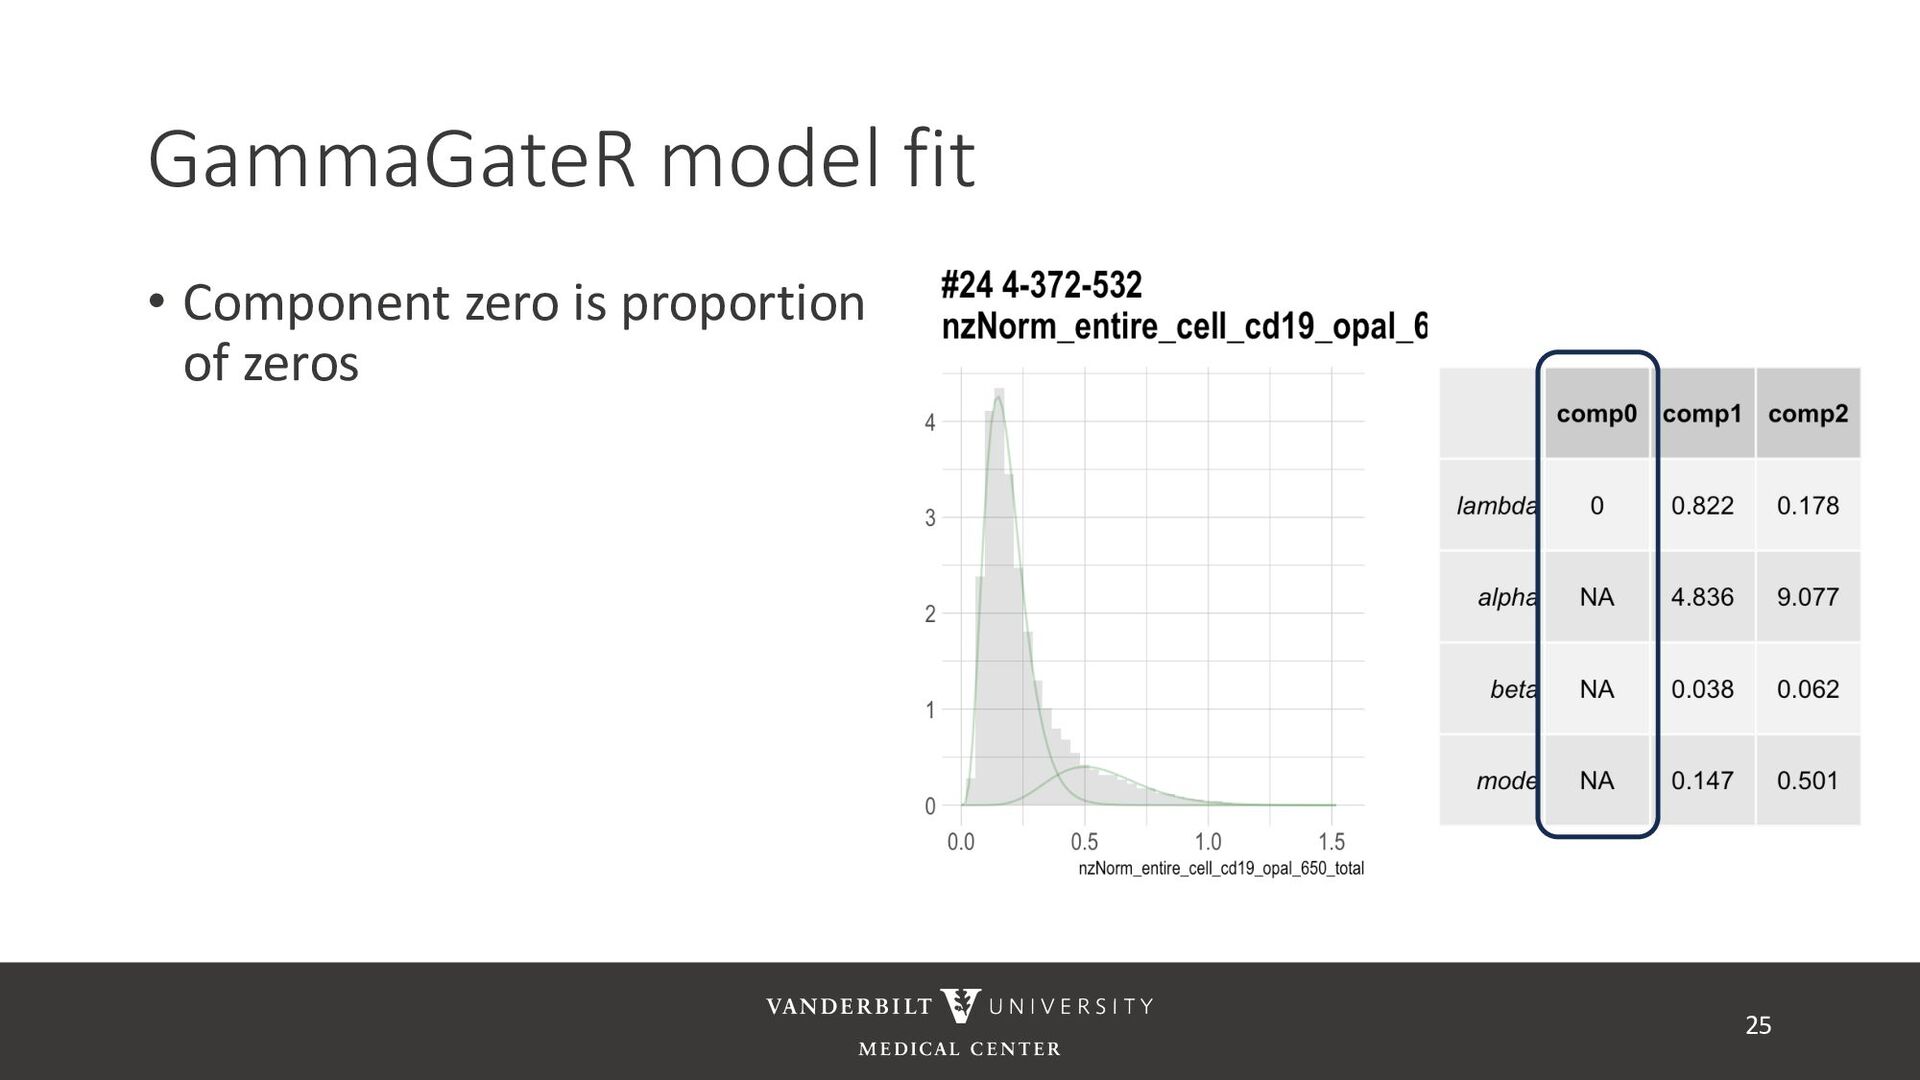
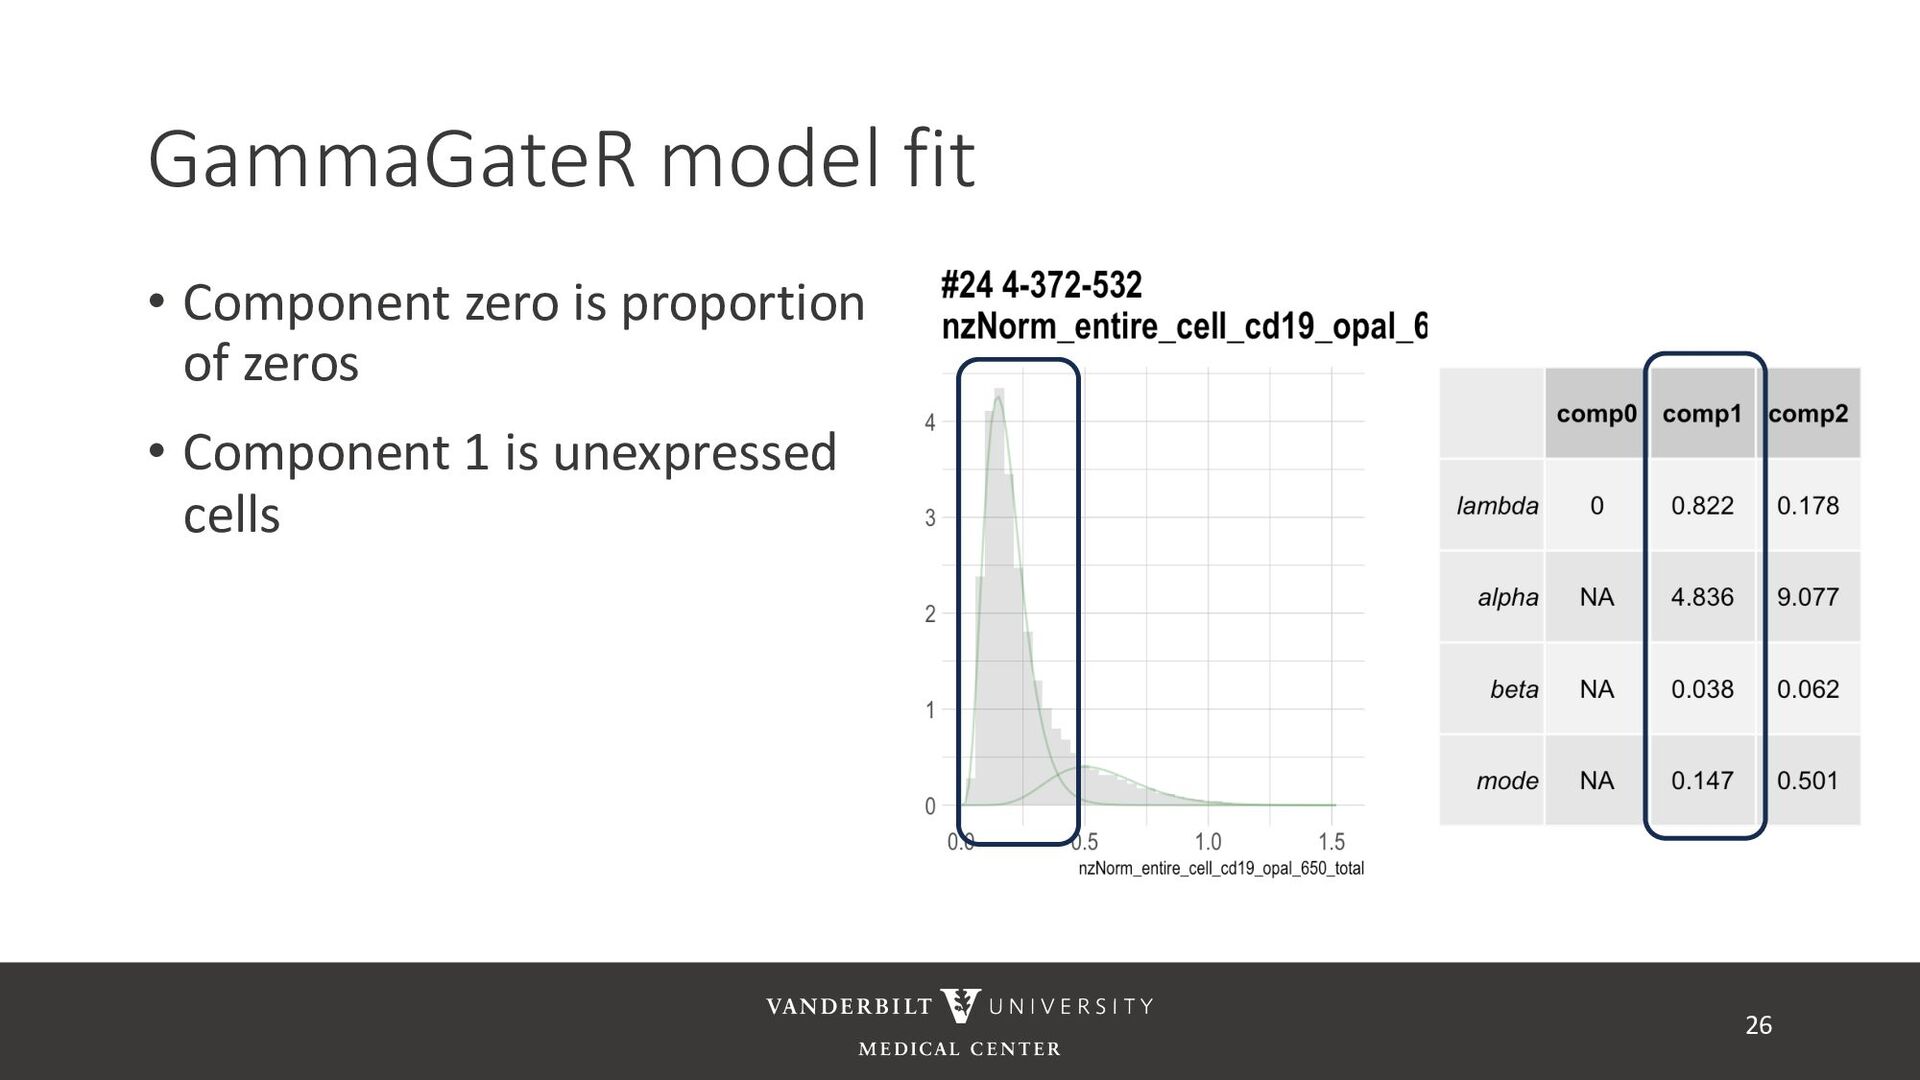
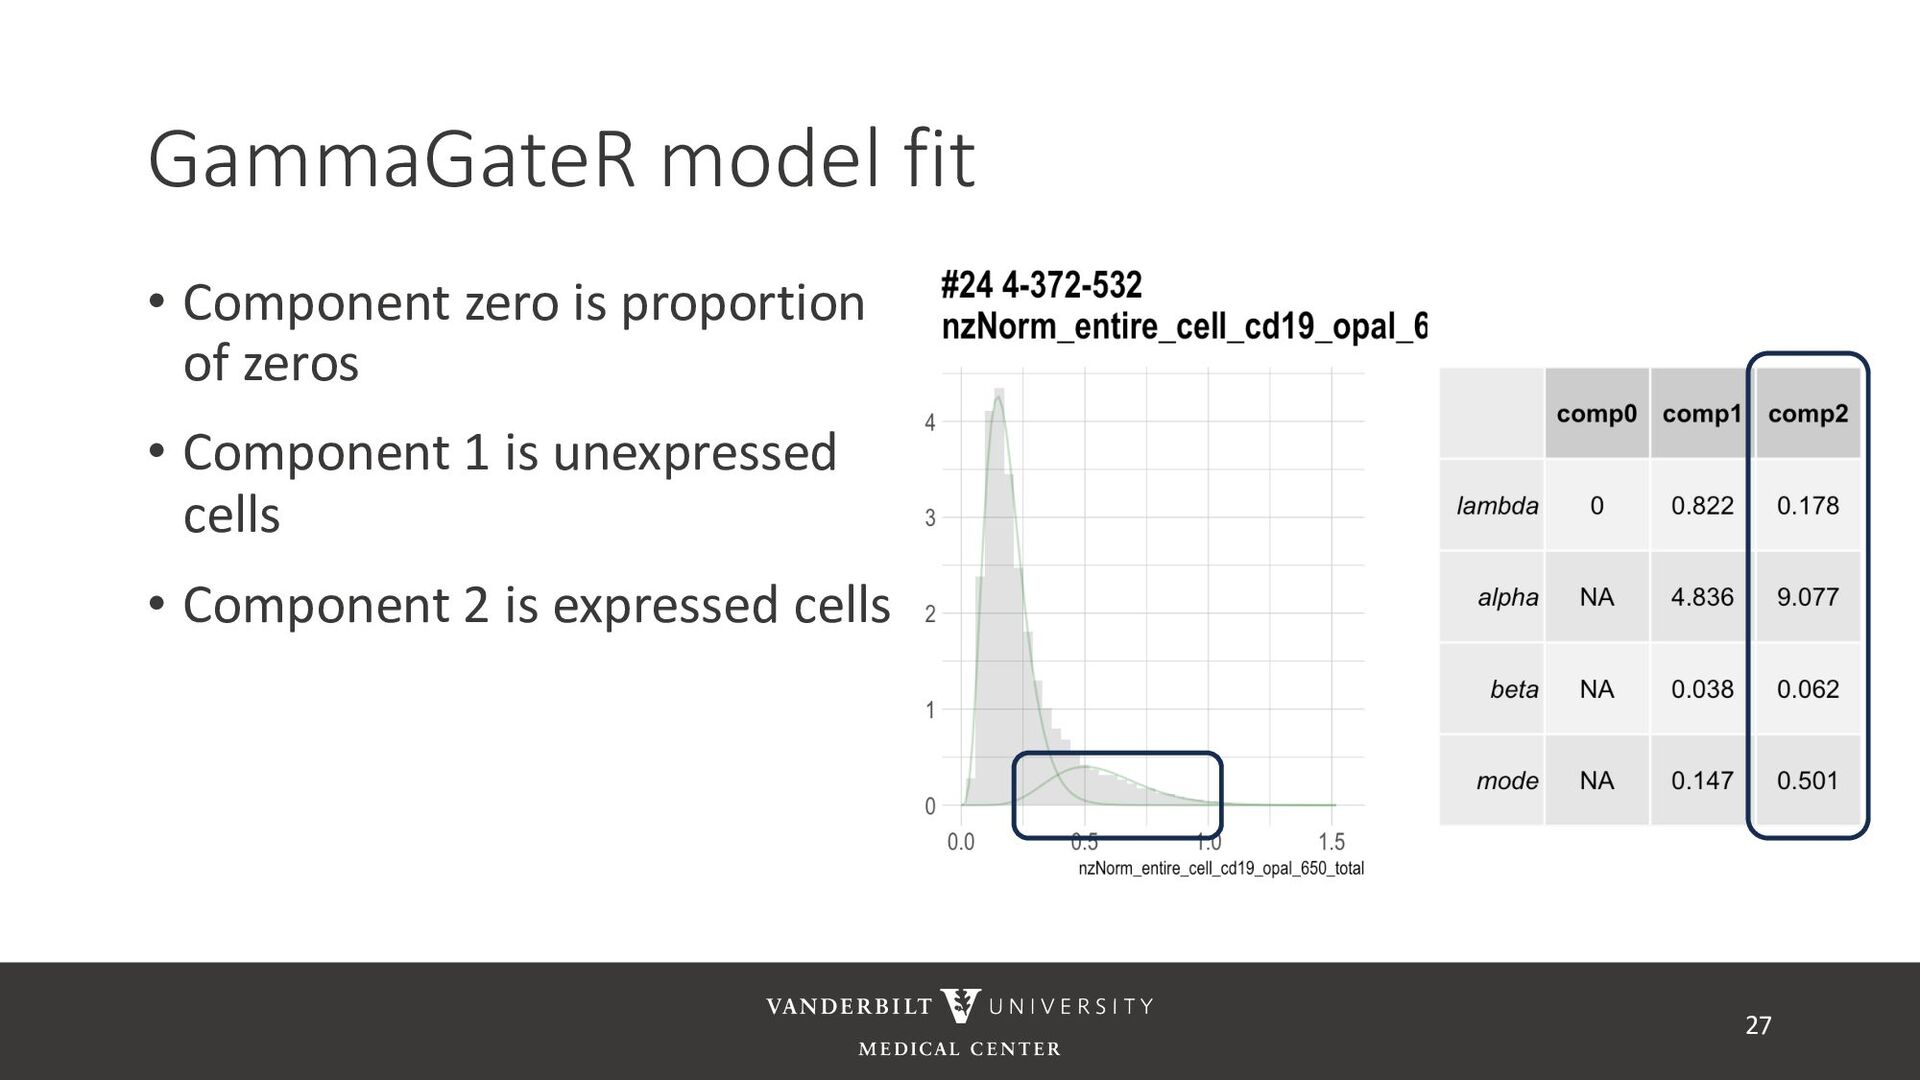
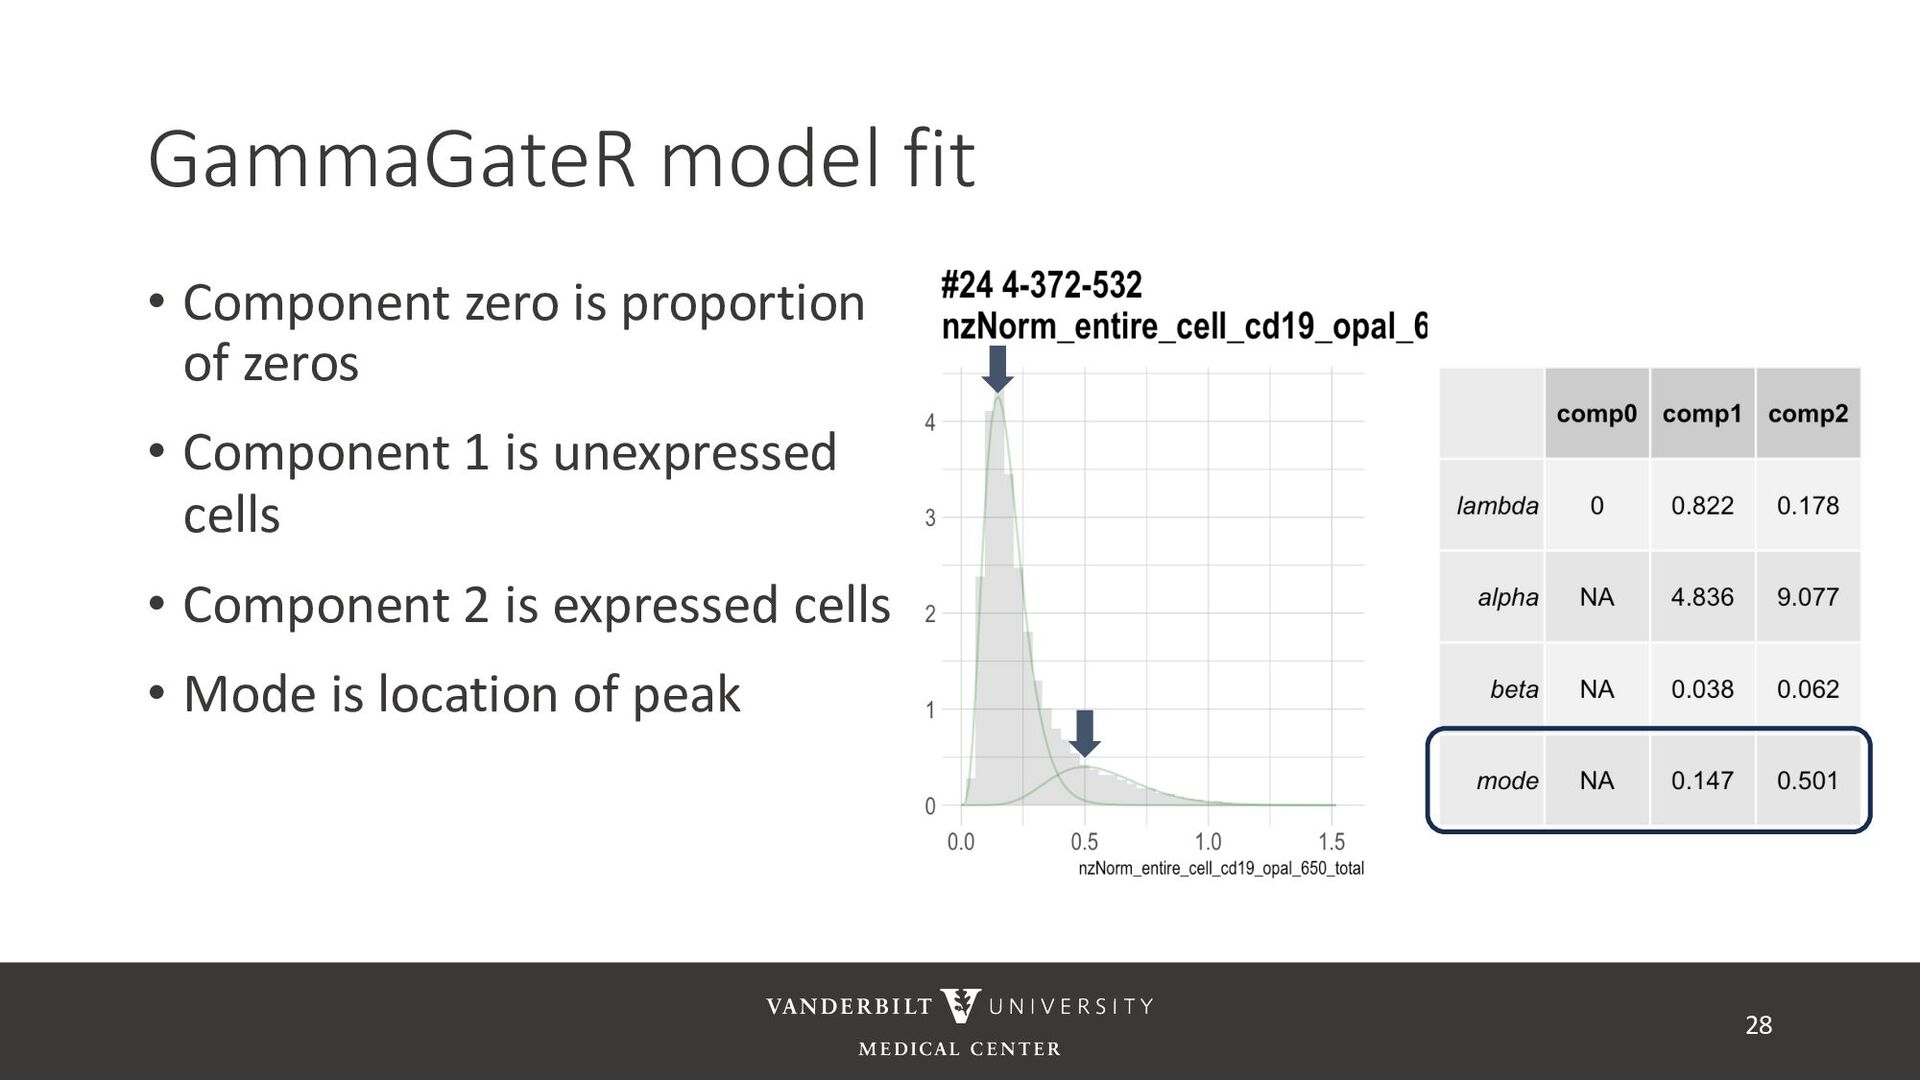
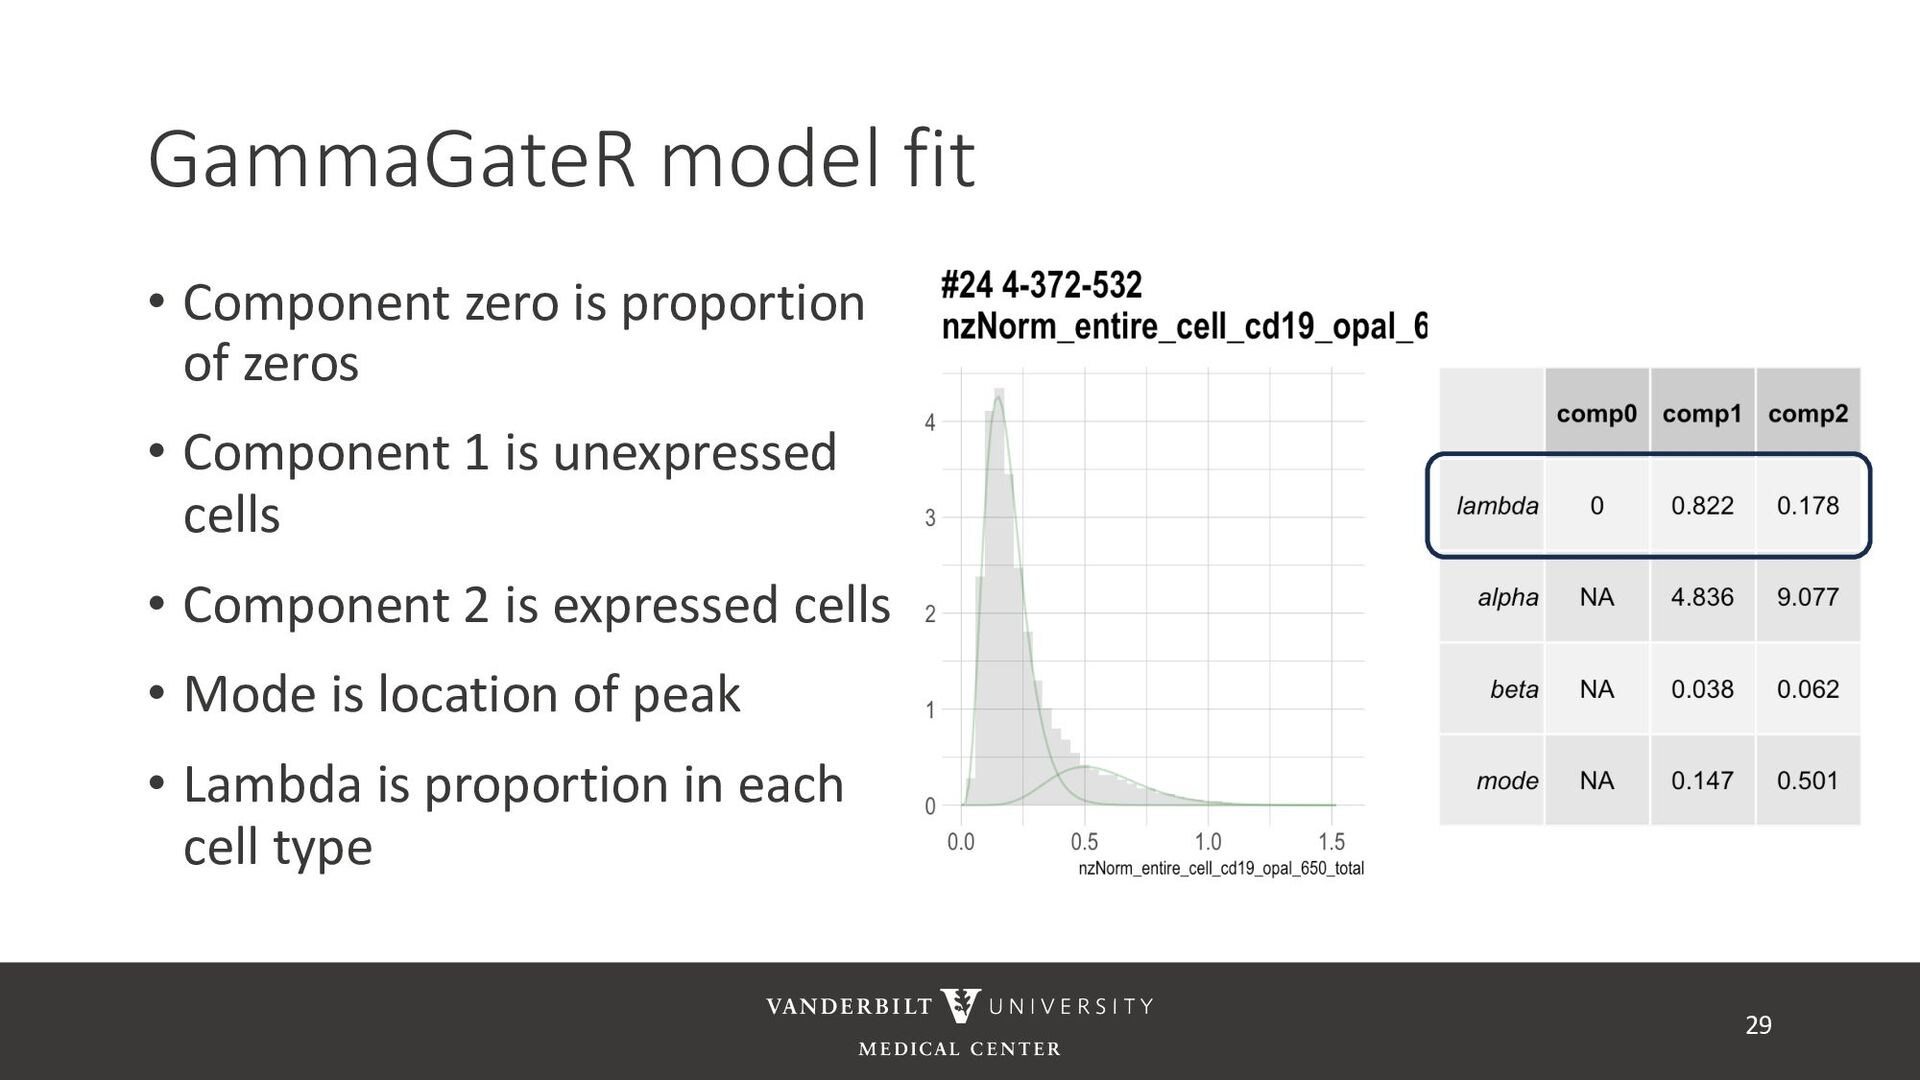
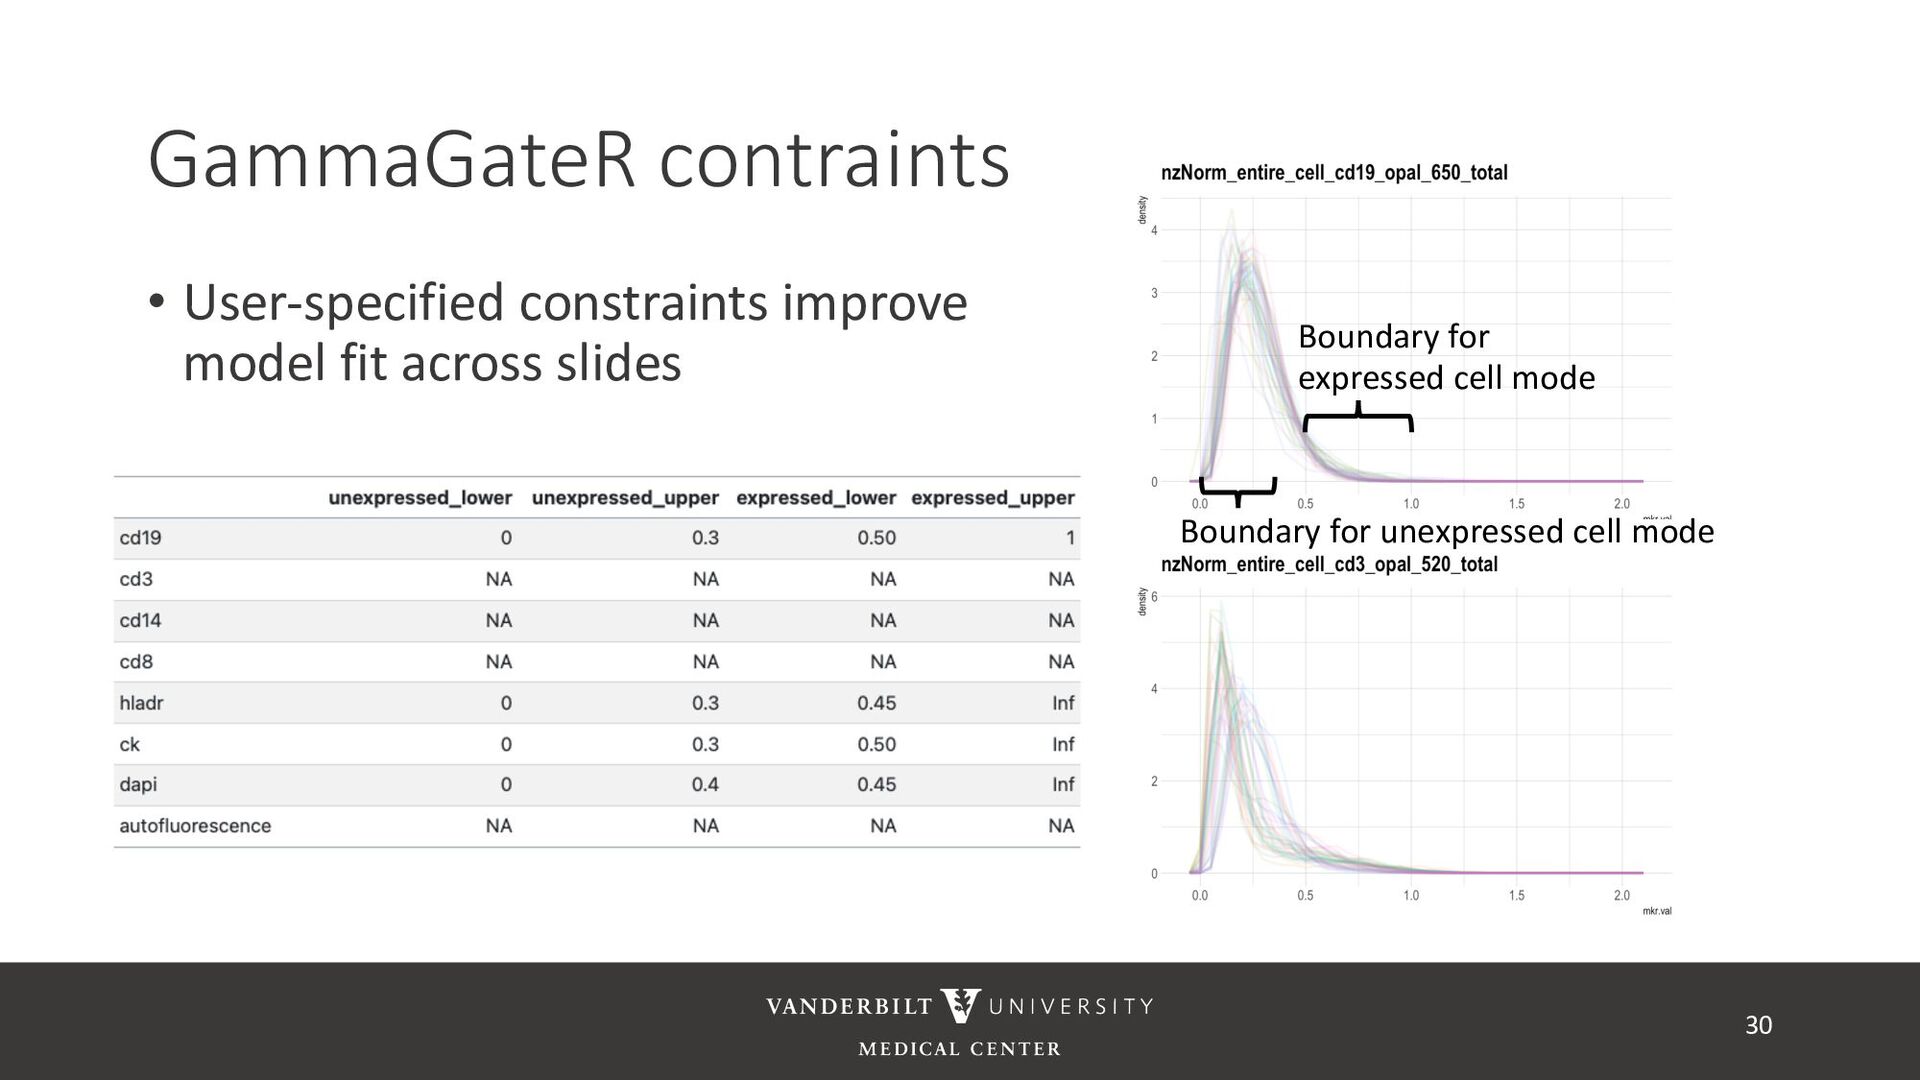
gamma mixture models to perform automated marker gating separately to each channel and slide • It takes user-specified constraints to obtain consistent model fit to each slide • Returns probability of being marker positive for each channel 21
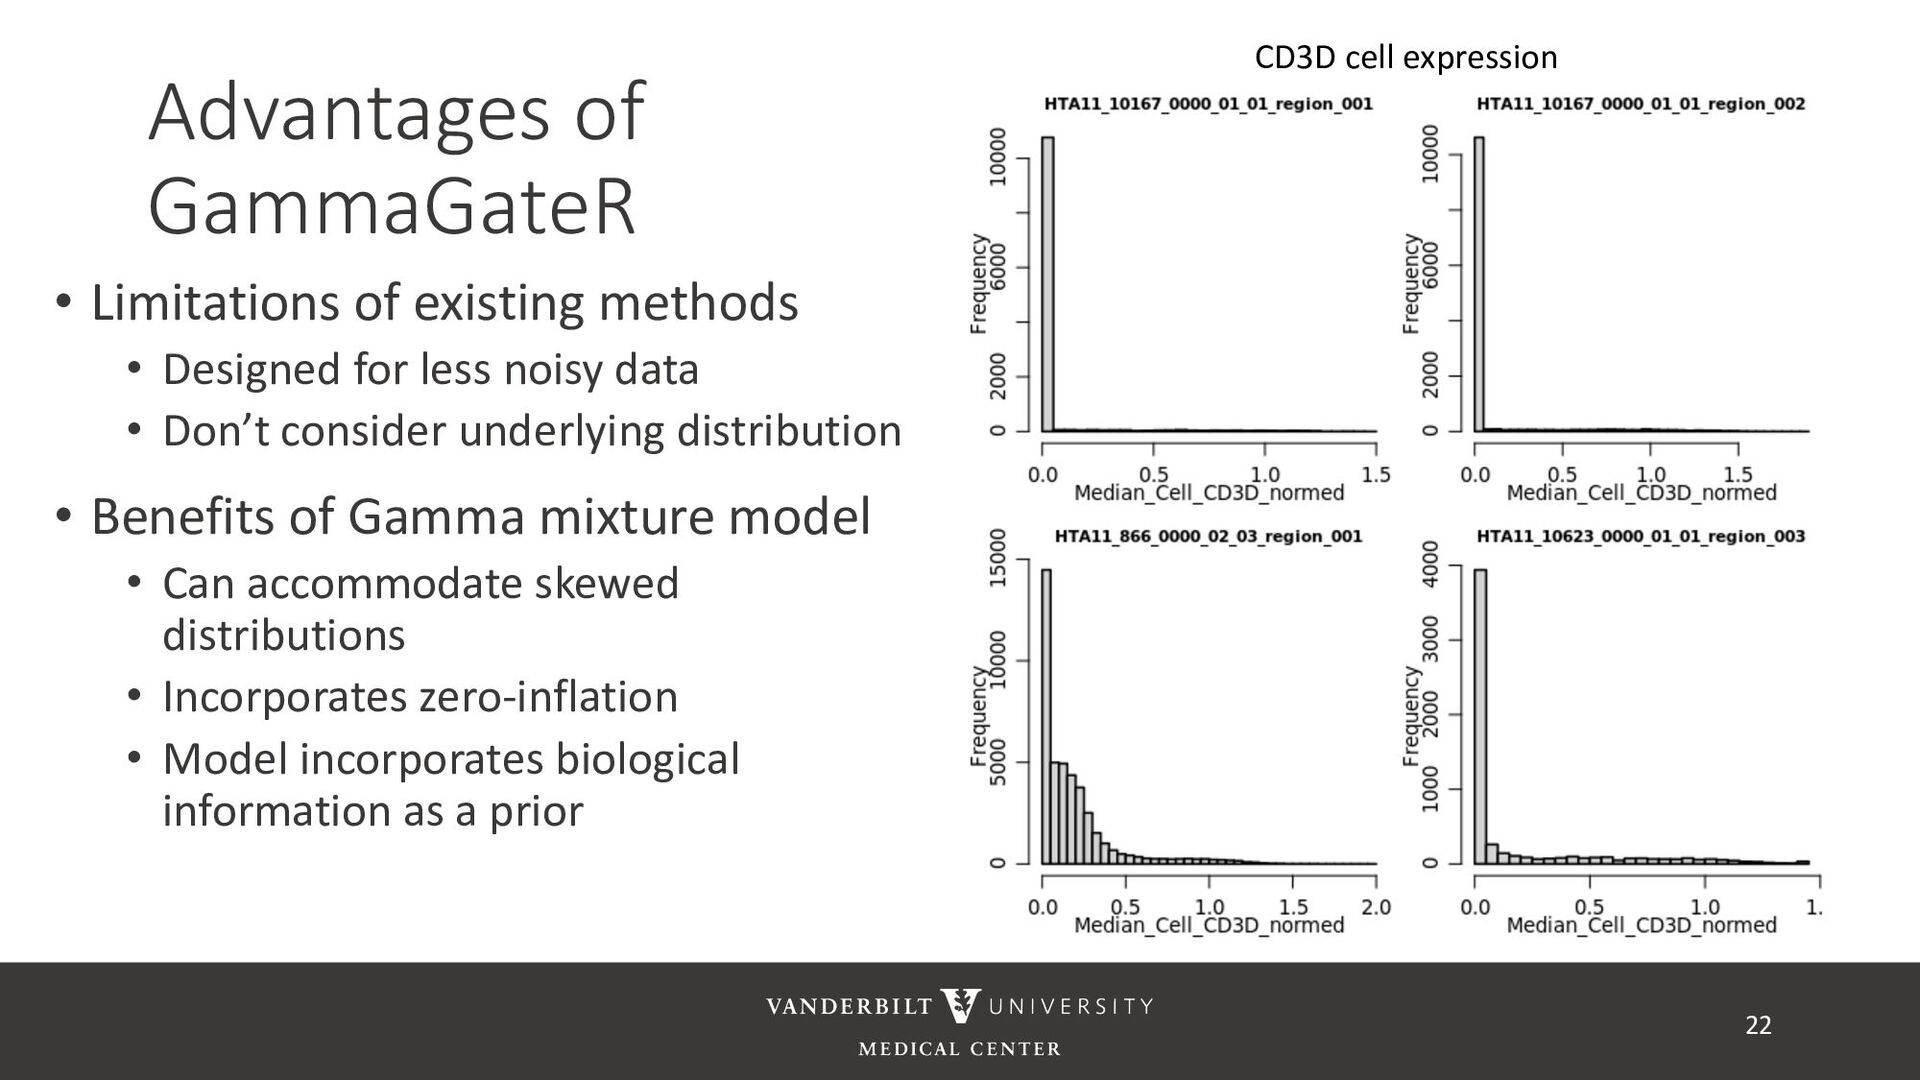
for less noisy data • Don’t consider underlying distribution • Benefits of Gamma mixture model • Can accommodate skewed distributions • Incorporates zero-inflation • Model incorporates biological information as a prior 22 CD3D cell expression
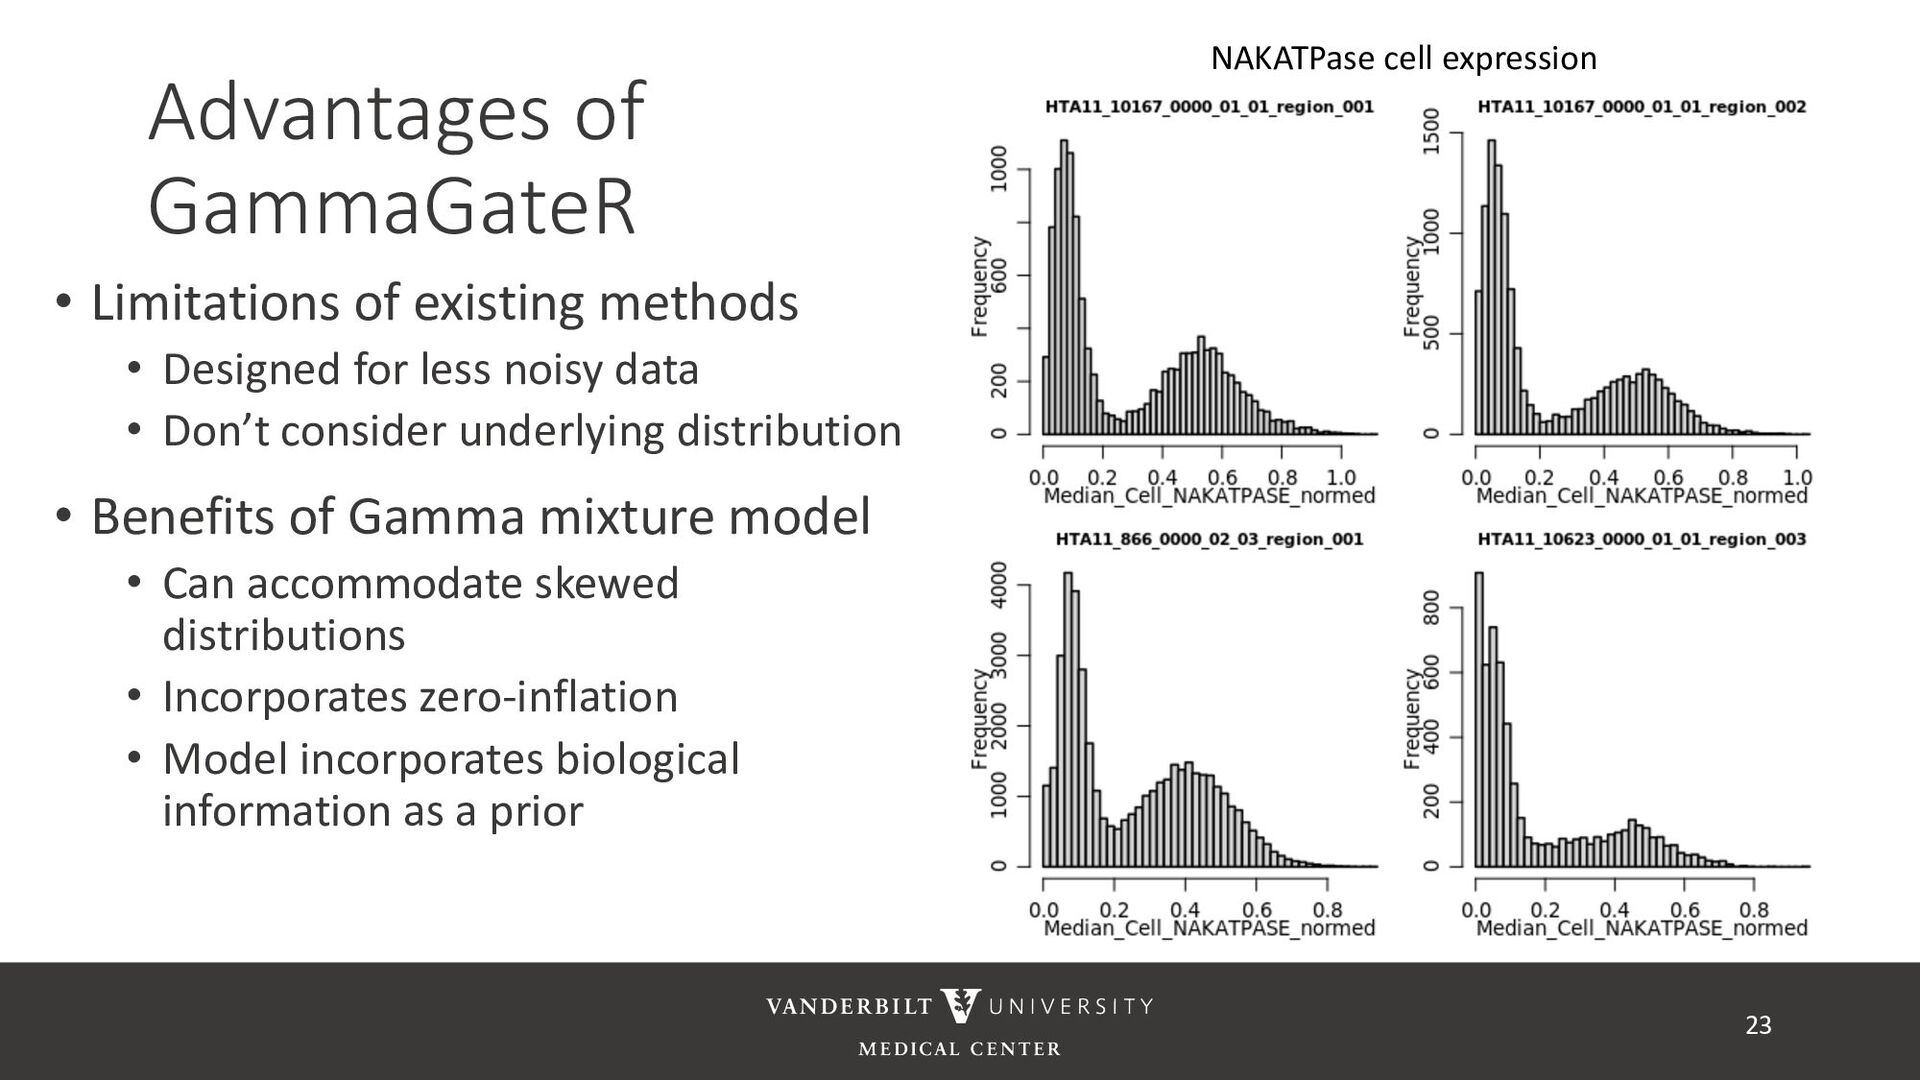
methods • Designed for less noisy data • Don’t consider underlying distribution • Benefits of Gamma mixture model • Can accommodate skewed distributions • Incorporates zero-inflation • Model incorporates biological information as a prior 23
cells being in the “expressed” population • These can be used to compute cell proportions, thresholded to define cell types, or used directly in downstream analysis • QR code links to tutorial using Julia’s ovarian cancer dataset 32
Eliot McKinley, Joe Roland, Qi Liu, Coleman Harris, Ruby Xiong • Funding: Vanderbilt Ingram Cancer Center GI SPORE: P50CA236733, NLM 5T32LM012412-05, R01MH123563 Simon Vandekar 33