Upgrade to Pro — share decks privately, control downloads, hide ads and more …

Reproducible Research with R

Kara Woo
November 29, 2018

Reproducible Research with R

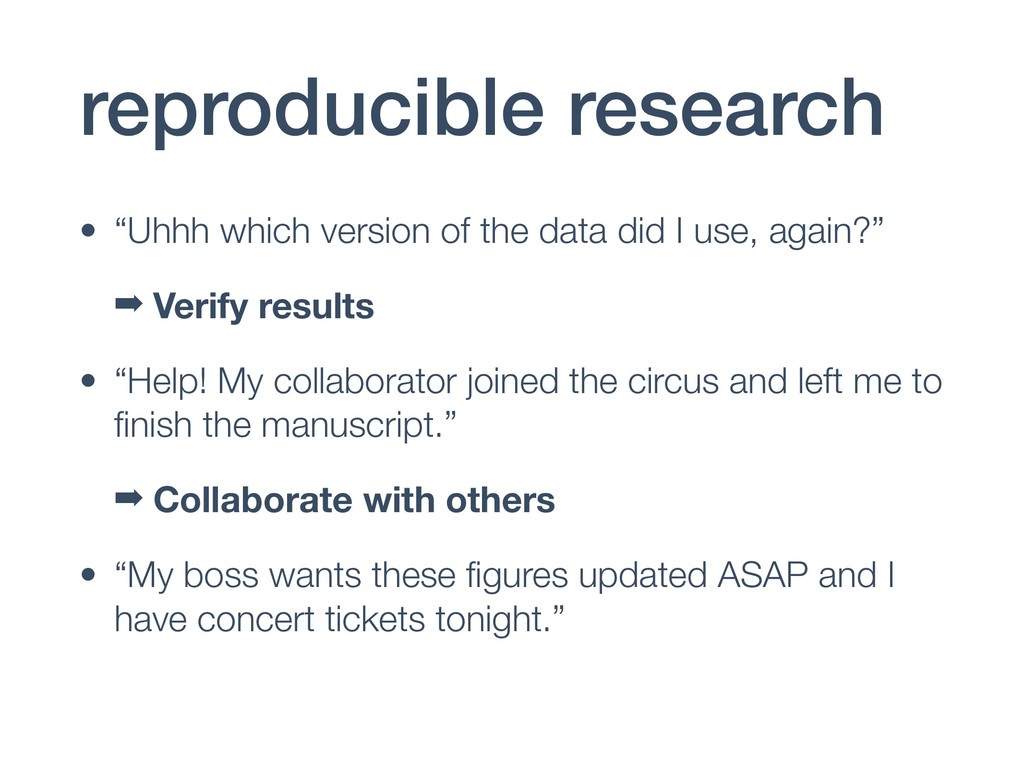
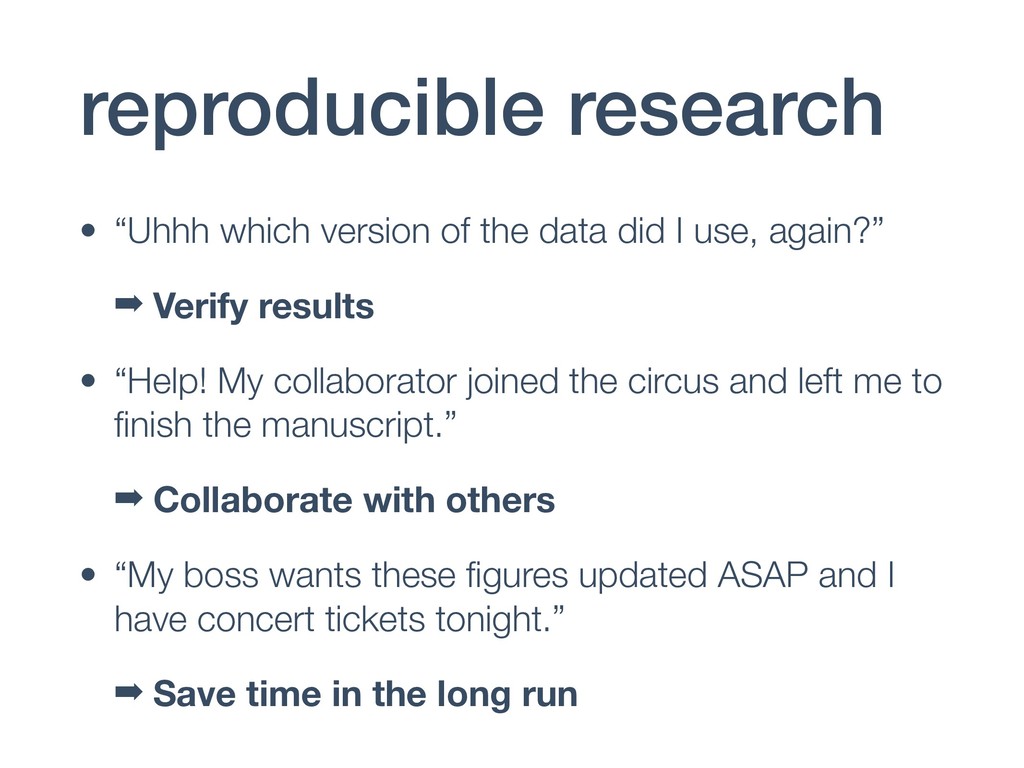
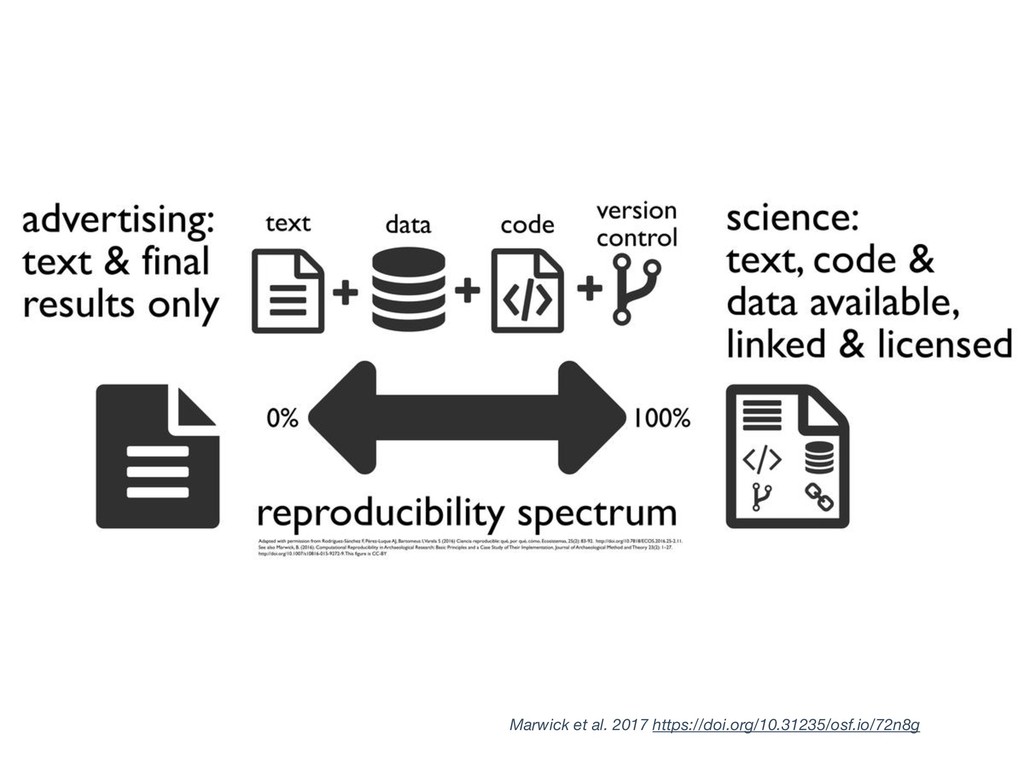
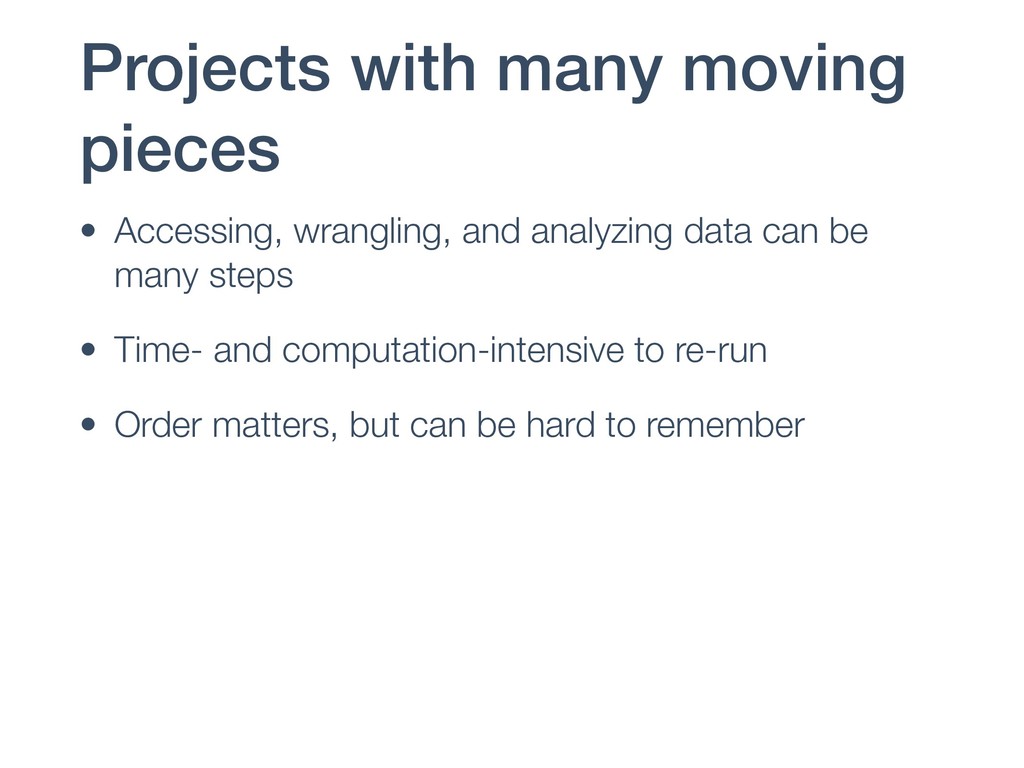
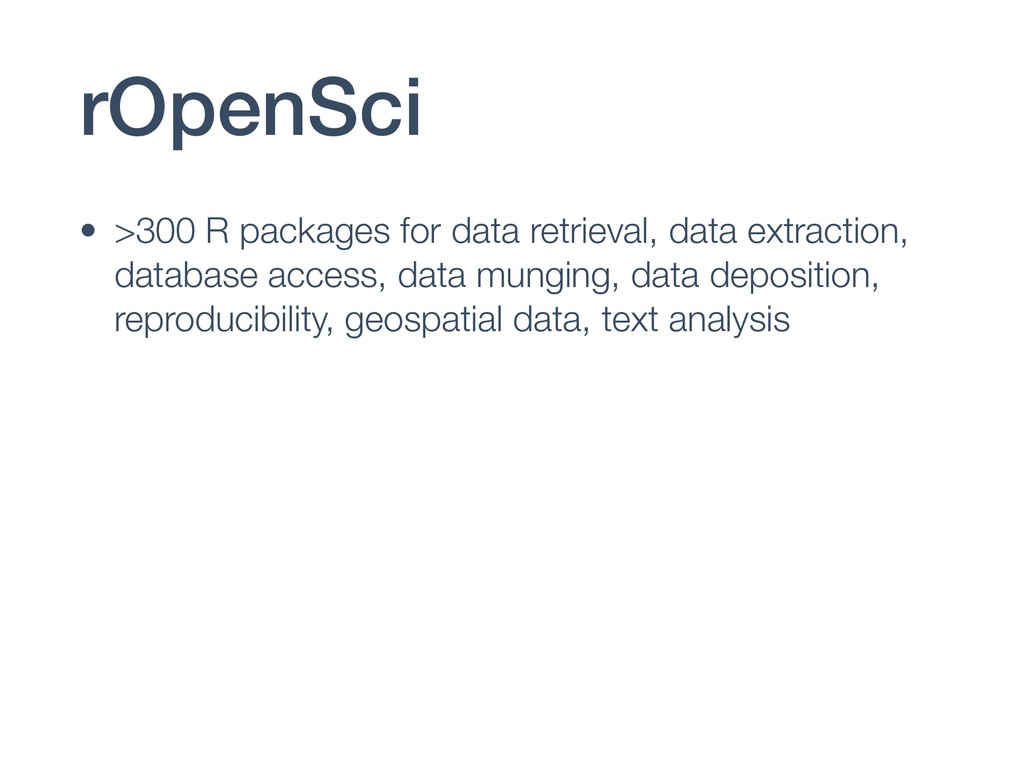
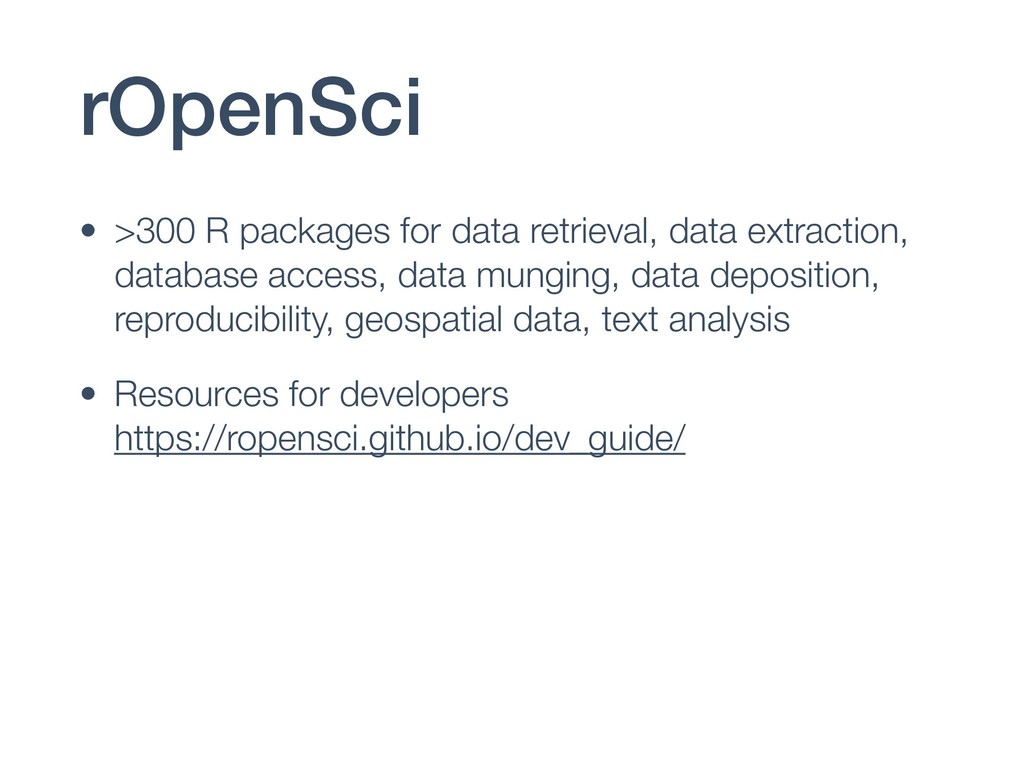
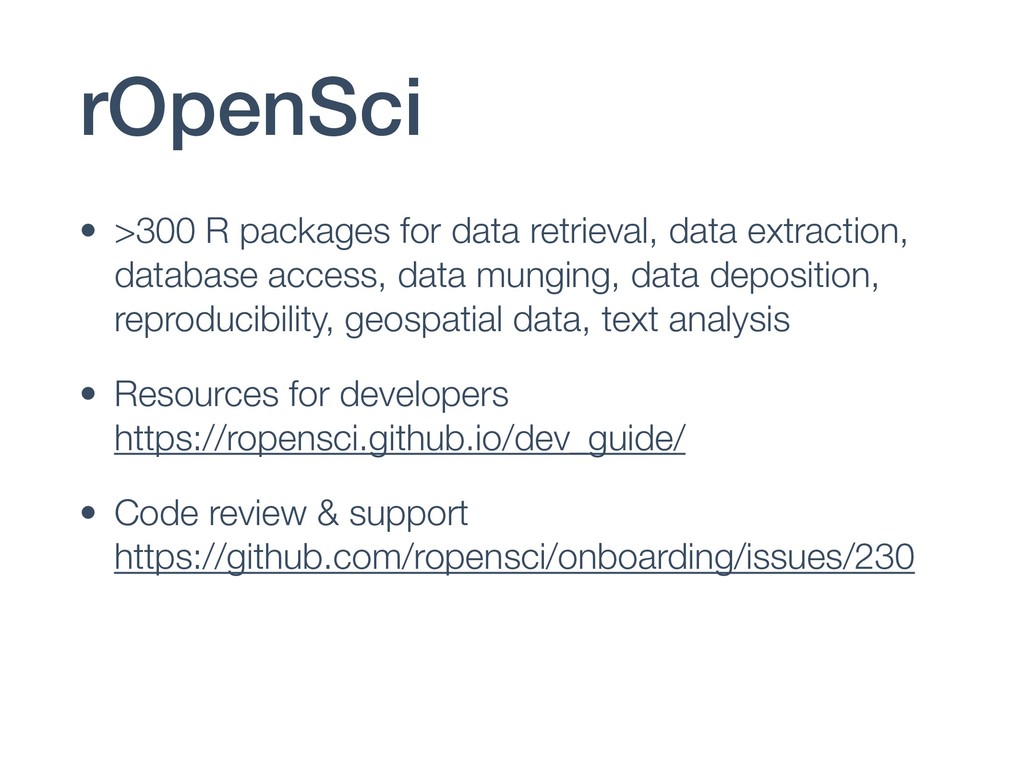
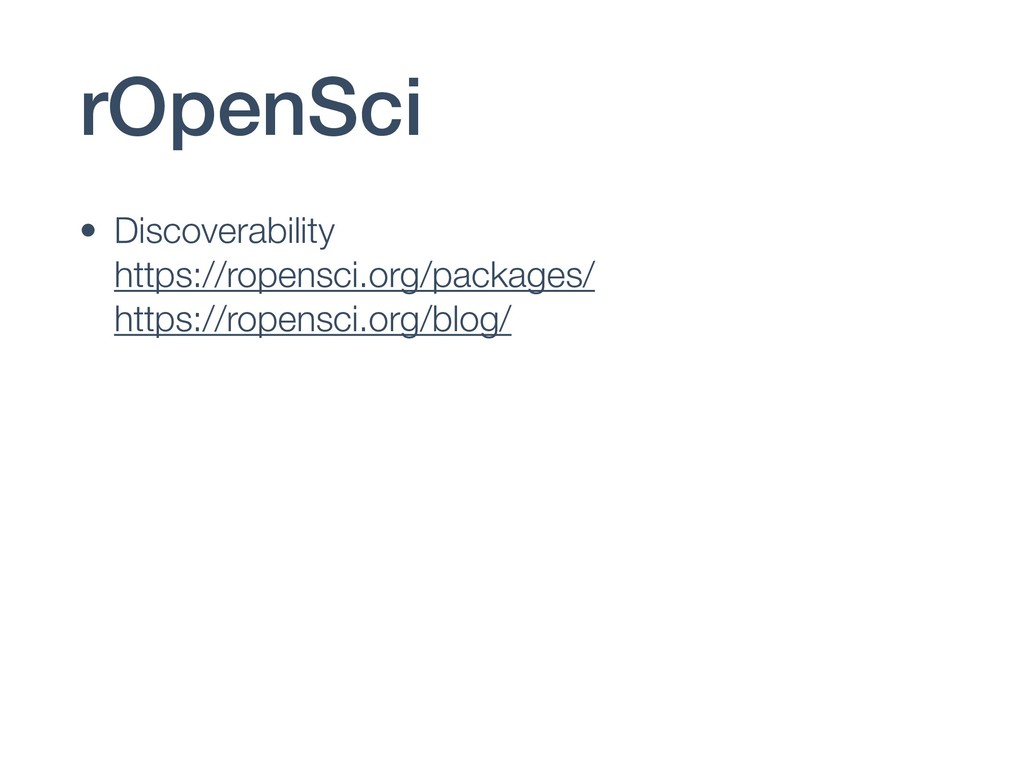
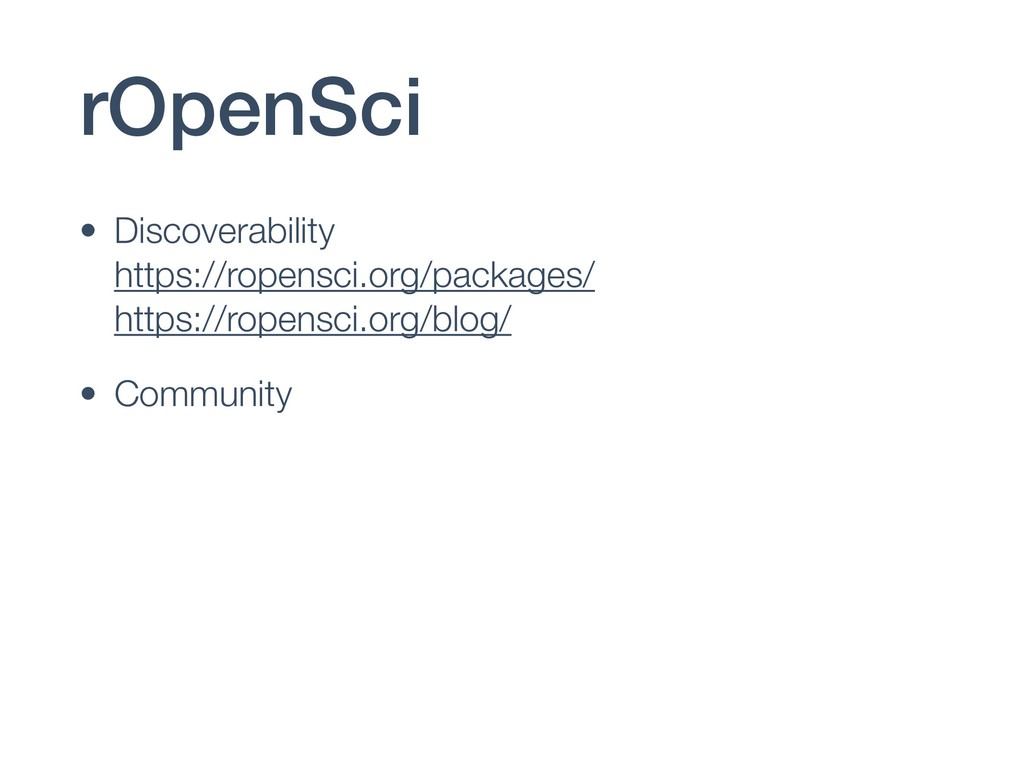
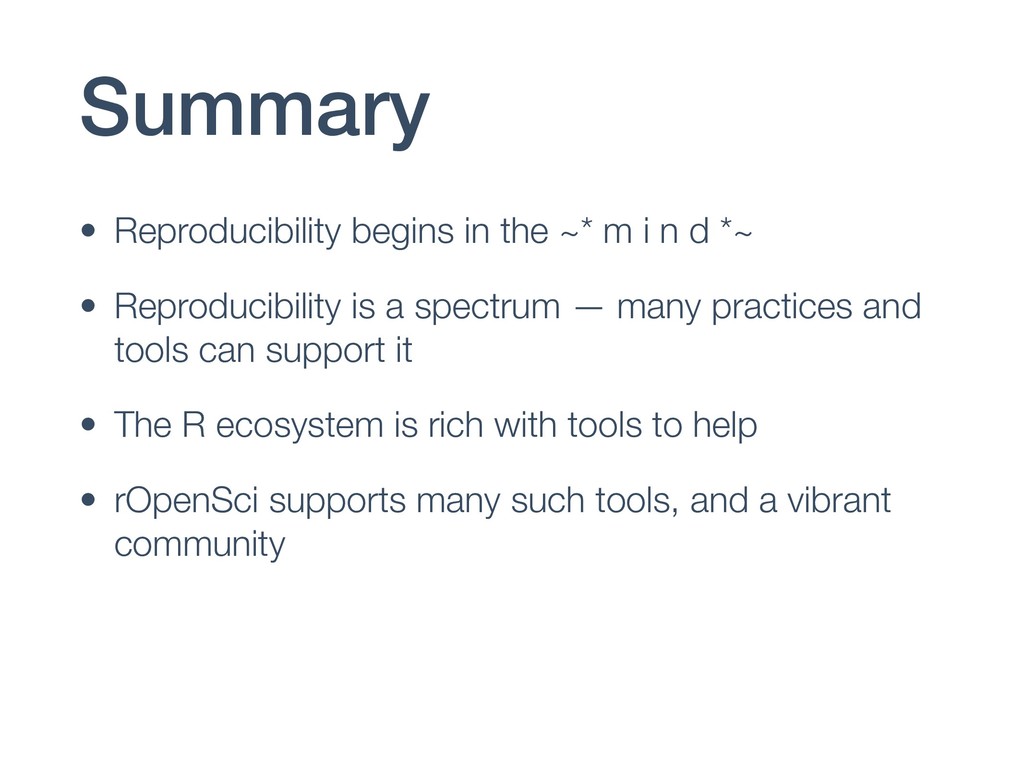
Reproducibility (or lack thereof) of research findings is a growing concern, but fortunately there are many tools and resources to aid analysts in developing transparent and reproducible projects. Kara will discuss the landscape of some of these tools, and how the rOpenSci community is advancing open, reproducible science through software and community.

Kara Woo

November 29, 2018
Tweet

More Decks by Kara Woo

Other Decks in Research

Transcript

  1. Reproducible
    Research with R
    Kara Woo

    Research Scientist, Data Curation

    Sage Bionetworks

    2018-11-29

    View Slide

  2. reproducible research

    View Slide

  3. Given my data and code, you should be
    able to come to the same conclusions.

    View Slide

  4. Given my data and code, you should be
    able to come to the same conclusions.*
    in contrast to replicability: re-doing an
    experiment and getting the same results

    View Slide

  5. reproducible research

    View Slide

  6. reproducible research
    • “Uhhh which version of the data did I use, again?”

    View Slide

  7. reproducible research
    • “Uhhh which version of the data did I use, again?”
    ➡ Verify results

    View Slide

  8. reproducible research
    • “Uhhh which version of the data did I use, again?”
    ➡ Verify results
    • “Help! My collaborator joined the circus and left me to
    finish the manuscript.”

    View Slide

  9. reproducible research
    • “Uhhh which version of the data did I use, again?”
    ➡ Verify results
    • “Help! My collaborator joined the circus and left me to
    finish the manuscript.”
    ➡ Collaborate with others

    View Slide

  10. reproducible research
    • “Uhhh which version of the data did I use, again?”
    ➡ Verify results
    • “Help! My collaborator joined the circus and left me to
    finish the manuscript.”
    ➡ Collaborate with others
    • “My boss wants these figures updated ASAP and I
    have concert tickets tonight.”

    View Slide

  11. reproducible research
    • “Uhhh which version of the data did I use, again?”
    ➡ Verify results
    • “Help! My collaborator joined the circus and left me to
    finish the manuscript.”
    ➡ Collaborate with others
    • “My boss wants these figures updated ASAP and I
    have concert tickets tonight.”
    ➡ Save time in the long run

    View Slide

  12. View Slide

  13. View Slide

  14. we’re often not taught how
    to make projects reproducible…

    View Slide

  15. …or we believe we
    don’t have time.

    View Slide

  16. Marwick et al. 2017 https://doi.org/10.31235/osf.io/72n8g

    View Slide

  17. – Keith Baggerly
    “The most important tool is the mindset,
    when starting, that the end product
    will be reproducible.”

    View Slide

  18. 1. Organize!

    View Slide

  19. View Slide

  20. View Slide

  21. View Slide

  22. View Slide

  23. my-project/
    ├── README.md
    |
    ├── data/
    │ ├── raw/
    │ └── processed/
    |
    ├── code/
    │ └── survival_analysis.R
    |
    ├── figures/
    │ ├── fig1.png
    │ └── fig2.png
    |
    └── manuscript/
    ├── project_manuscript.Rmd
    ├── project_manuscript.docx
    └── project_manuscript.pdf

    View Slide

  24. my-project/
    ├── README.md
    |
    ├── data/
    │ ├── raw/
    │ └── processed/
    |
    ├── code/
    │ └── survival_analysis.R
    |
    ├── figures/
    │ ├── fig1.png
    │ └── fig2.png
    |
    └── manuscript/
    ├── project_manuscript.Rmd
    ├── project_manuscript.docx
    └── project_manuscript.pdf

    View Slide

  25. • You don’t need any special tools to do this:
    organization and informative file names go a long way
    • But some R tools can take it to the next level

    View Slide

  26. usethis
    • Sets up commonly used components for projects
    and R packages
    • create_project() - set up a project
    • use_readme_md()
    • …
    usethis package by Jenny Bryan and Hadley Wickham: https://github.com/r-lib/usethis

    View Slide

  27. 2. Script

    View Slide

  28. Record everything you did, because you will
    have to do it again.

    View Slide

  29. – Broman & Woo, 2017
    “Has this happened to you? You open an
    Excel file and start typing and nothing
    happens, and then you select a cell and you
    can start typing. Where did all of that initial
    text go? Well, sometimes it got entered into
    some random cell, to be discovered later
    during data analysis.”
    https://doi.org/10.1080/00031305.2017.1375989

    View Slide

  30. View Slide

  31. View Slide

  32. Where did this data even come from?

    View Slide

  33. • Sometimes spreadsheets and hand-entered data are
    what I’ve got
    • Sometimes data is coming from a database or
    website

    View Slide

  34. View Slide

  35. View Slide

  36. Access data
    programmatically
    • Recreate the exact steps, query parameters, etc. to
    retrieve the data
    • No need to keep track of which files came from
    where
    • Original data remains untouched

    View Slide

  37. ropenaq access air quality data from openaq
    > aq_measurements(country = "US", city = "Corvallis", parameter = "pm25", limit
    = 10, page = 1)
    # A tibble: 10 x 12
    location parameter value unit country city latitude longitude

    1 Corvallis - Circl… pm25 14.2 µg/m³ US Corvall… 44.6 -123.
    2 Corvallis - Circl… pm25 15.3 µg/m³ US Corvall… 44.6 -123.
    3 Corvallis - Circl… pm25 16 µg/m³ US Corvall… 44.6 -123.
    4 Corvallis - Circl… pm25 14.9 µg/m³ US Corvall… 44.6 -123.
    5 Corvallis - Circl… pm25 13.5 µg/m³ US Corvall… 44.6 -123.
    6 Corvallis - Circl… pm25 12.5 µg/m³ US Corvall… 44.6 -123.
    7 Corvallis - Circl… pm25 10.5 µg/m³ US Corvall… 44.6 -123.
    8 Corvallis - Circl… pm25 12.5 µg/m³ US Corvall… 44.6 -123.
    9 Corvallis - Circl… pm25 10.5 µg/m³ US Corvall… 44.6 -123.
    10 Corvallis - Circl… pm25 8.4 µg/m³ US Corvall… 44.6 -123.
    # ... with 4 more variables: dateUTC , dateLocal , cityURL ,
    # locationURL
    ropenaq package by Maëlle Salmon: https://github.com/ropensci/ropenaq

    View Slide

  38. 3. Write reproducible
    reports

    View Slide

  39. R Markdown
    • Combine text, code, and figures into reproducible
    reports
    • “We surveyed `r nrow(survey_data)`
    participants.”
    • Papers, blog posts, presentations, books
    • No endless copy/pasting figures into Word!

    View Slide

  40. huskydown
    • Write your thesis in R Markdown
    • Uses UW thesis template for formatting
    huskydown package by Ben Marwick: https://github.com/benmarwick/huskydown

    View Slide

  41. huskydown
    • Write your thesis in R Markdown
    • Uses UW thesis template for formatting
    huskydown package by Ben Marwick: https://github.com/benmarwick/huskydown

    View Slide

  42. 4. Automate from end
    to end

    View Slide

  43. Projects with many moving
    pieces
    • Accessing, wrangling, and analyzing data can be
    many steps
    • Time- and computation-intensive to re-run
    • Order matters, but can be hard to remember

    View Slide

  44. View Slide

  45. drake
    • Workflow manager for R projects
    • Define a drake_plan() for all steps in the project
    • Use make() to run all steps, skipping things that
    haven’t changed
    • Supports parallel computing
    drake package by Will Landau: https://github.com/ropensci/drake/

    View Slide

  46. Transforming science through
    open data and software

    View Slide

  47. rOpenSci
    • >300 R packages for data retrieval, data extraction,
    database access, data munging, data deposition,
    reproducibility, geospatial data, text analysis

    View Slide

  48. rOpenSci
    • >300 R packages for data retrieval, data extraction,
    database access, data munging, data deposition,
    reproducibility, geospatial data, text analysis
    • Resources for developers

    https://ropensci.github.io/dev_guide/

    View Slide

  49. rOpenSci
    • >300 R packages for data retrieval, data extraction,
    database access, data munging, data deposition,
    reproducibility, geospatial data, text analysis
    • Resources for developers

    https://ropensci.github.io/dev_guide/
    • Code review & support

    https://github.com/ropensci/onboarding/issues/230

    View Slide

  50. rOpenSci
    • Discoverability

    https://ropensci.org/packages/

    https://ropensci.org/blog/

    View Slide

  51. rOpenSci
    • Discoverability

    https://ropensci.org/packages/

    https://ropensci.org/blog/
    • Community

    View Slide

  52. – Will Landau
    “rOpenSci combines expertise and
    approachability, and its community inspires
    people to collaborate as the best versions
    of themselves.”

    View Slide

  53. What I left out:
    • Data formats and best practices
    • Version control
    • Turning repeated code into functions
    • Turning projects into R packages
    • Licensing

    View Slide

  54. Summary
    • Reproducibility begins in the ~* m i n d *~
    • Reproducibility is a spectrum — many practices and
    tools can support it
    • The R ecosystem is rich with tools to help
    • rOpenSci supports many such tools, and a vibrant
    community

    View Slide

  55. thanks!
    [email protected]

    karawoo.com

    @kara_woo

    View Slide