$30 off During Our Annual Pro Sale. View Details »

Box plots: A case study in debugging and perseverance

Kara Woo
January 17, 2019

Box plots: A case study in debugging and perseverance

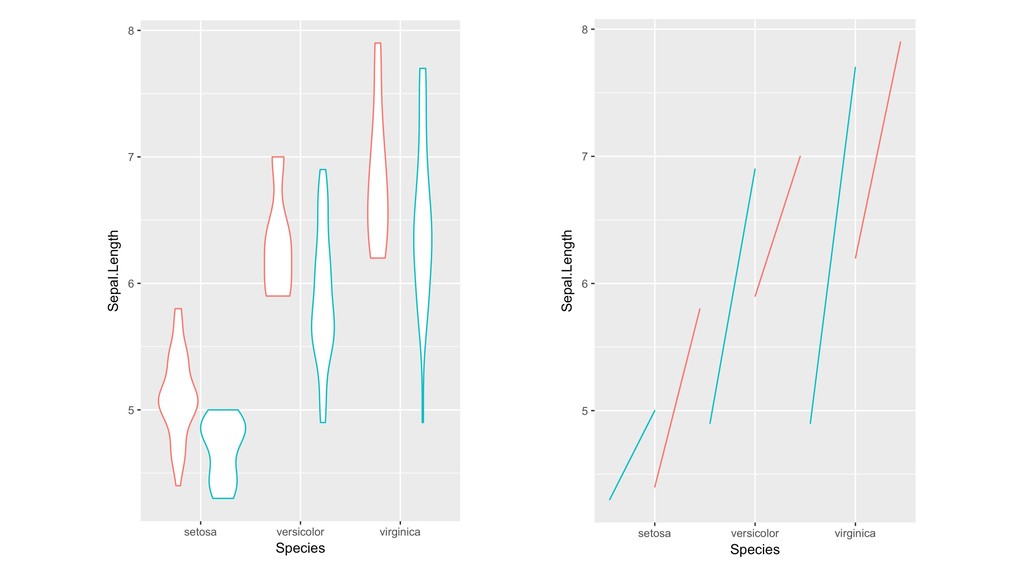
Come on a journey through pull request #2196. What started as a seemingly simple fix for a bug in ggplot2's box plots developed into an entirely new placement algorithm for ggplot2 geoms. This talk will cover tips and techniques for debugging, testing, and not smashing your computer when dealing with tricky bugs.

Kara Woo

January 17, 2019
Tweet

More Decks by Kara Woo

Other Decks in Technology

Transcript

  1. Kara Woo | @kara_woo
    Sage Bionetworks
    rstudio::conf 2019
    BOX PLOTS
    A CASE STUDY IN DEBUGGING AND PERSEVERANCE

    View Slide

  2. THIS IS ONLY KIND OF
    ABOUT BOX PLOTS

    View Slide

  3. "When I try to produce
    boxplots with colours
    depending on a
    categorical variable,
    these appear overlapping
    if varwidth is set to TRUE”
    —GitHub user mcol

    View Slide

  4. “This should be straightforward.”

    View Slide

  5. View Slide

  6. How do I know what the bug is?
    How do I know when I’m done?
    How do I fix it?

    View Slide

  7. HOW DO
    YOU KNOW
    WHAT THE
    BUG IS?
    Photo: Jia Ye
    Isolate the
    problem

    View Slide

  8. Photo: Sarah Dorweiler
    REPREX
    minimal reproducible example

    View Slide

  9. reprex::reprex()

    View Slide

  10. require(ggplot2)
    #> Loading required package: ggplot2
    ggplot(data = iris, aes(Species, Sepal.Length)) +
    geom_boxplot(aes(colour = Sepal.Width < 3.2), varwidth = TRUE)
    #> Warning: position_dodge requires non-overlapping x intervals

    View Slide

  11. require(ggplot2)
    #> Loading required package: ggplot2
    ggplot(data = iris, aes(Species, Sepal.Length)) +
    geom_boxplot(aes(colour = Sepal.Width < 3.2), varwidth = FALSE)

    View Slide

  12. Follow
    the trails
    Photo: Jia Ye

    View Slide

  13. require(ggplot2)
    #> Loading required package: ggplot2
    ggplot(data = iris, aes(Species, Sepal.Length)) +
    geom_boxplot(aes(colour = Sepal.Width < 3.2), varwidth = TRUE)
    #> Warning: position_dodge requires non-overlapping x intervals

    View Slide

  14. View Slide

  15. position_dodge()
    !" PositionDodge
    !" collide()
    !" pos_dodge()

    View Slide

  16. COLLIDE()
    Gets information about box location
    Looks for box overlap
    Passes boxes that share position to
    pos_dodge()
    POS_DODGE()
    Scales boxes down
    Places boxes side by side

    View Slide

  17. > debug(ggplot2:::collide)

    View Slide

  18. > debug(ggplot2:::collide)
    > ggplot(data = iris, aes(Species, Sepal.Length)) +
    > geom_boxplot(aes(colour = Sepal.Width < 3.2), varwidth = FALSE)
    #> debugging in: collide(data, params$width,
    #> name = “position_dodge", strategy = pos_dodge,
    #> n = params$n, check.width = FALSE)
    Browse[2]>

    View Slide

  19. > debug(ggplot2:::collide)
    > ggplot(data = iris, aes(Species, Sepal.Length)) +
    > geom_boxplot(aes(colour = Sepal.Width < 3.2), varwidth = FALSE)
    #> debugging in: collide(data, params$width,
    #> name = “position_dodge", strategy = pos_dodge,
    #> n = params$n, check.width = FALSE)
    Browse[2]> data
    #> ... x xmin xmax
    #> 1 ... 1 0.625 1.375
    #> 2 ... 2 1.625 2.375
    #> 3 ... 3 2.625 3.375
    #> 4 ... 1 0.625 1.375
    #> 5 ... 2 1.625 2.375
    #> 6 ... 3 2.625 3.375

    View Slide

  20. VARWIDTH = TRUE
    VARWIDTH = FALSE
    data
    #> ... x xmin xmax
    #> 1 ... 1 0.625 1.375
    #> 2 ... 2 1.625 2.375
    #> 3 ... 3 2.625 3.375
    #> 4 ... 1 0.625 1.375
    #> 5 ... 2 1.625 2.375
    #> 6 ... 3 2.625 3.375
    data
    #> ... x xmin xmax
    #> 1 ... 1 0.6553988 1.344601
    #> 2 ... 2 1.8750000 2.125000
    #> 3 ... 3 2.7984436 3.201556
    #> 4 ... 1 0.8063508 1.193649
    #> 5 ... 2 1.6250000 2.375000
    #> 6 ... 3 2.6599632 3.340037

    View Slide

  21. Boxes with different xmin aren’t
    treated as the same position.
    collide <- function(data, ...) {
    # ...
    plyr::ddply(data, "xmin", strategy, ..., width = width)
    # ...
    }

    View Slide

  22. HOW DO
    YOU FIX IT?
    Photo: Jia Ye
    Experiment

    View Slide

  23. ccc6bbb4 This doesn't fix position_dodge, but
    it might be in the right direction?
    f5946680 Commit before I break something else

    View Slide

  24. INITIAL
    “FIX”
    What’s wrong with
    this picture?

    View Slide

  25. •Boxes in the wrong order
    •Doesn’t work for
    continuous x axes
    •Incorrect scaling
    INITIAL
    “FIX”
    What’s wrong with
    this picture?

    View Slide

  26. Photo: Jia Ye
    Test many scenarios
    HOW DO
    YOU FIX IT?

    View Slide

  27. View Slide

  28. Photo: Jia Ye
    Make it general
    HOW DO
    YOU FIX IT?

    View Slide

  29. Can we extend to bars?
    Can we solve other open issues?
    Arbitrary rectangles?

    View Slide


  30. POSITION_DODGE2()
    Used for boxes, bars, rectangles
    Finds overlap by comparing
    xmin to previous xmax

    View Slide

  31. HOW DO YOU
    KNOW WHEN
    YOU’RE DONE?
    Photo: Jia Ye
    Again, test

    View Slide

  32. HOW DO YOU
    KNOW WHEN
    YOU’RE DONE?
    Photo: Jia Ye
    Don’t let
    perfect be the
    enemy of good

    View Slide

  33. CAN
    POSITION_DODGE2()
    REPLACE
    POSITION_DODGE()?

    View Slide

  34. View Slide

  35. View Slide

  36. • Isolate the problem
    • Follow the trails
    • Experiment
    • Test many scenarios
    • Make it general
    • Don’t let perfect be the enemy of good
    https://github.com/tidyverse/ggplot2/pull/2196

    View Slide

  37. Thank you
    Thanks to @mcol for reporting this bug,
    Hadley Wickham for repeated code
    reviews, and Sean Kross and Karthik Ram
    for feedback on this presentation.

    View Slide