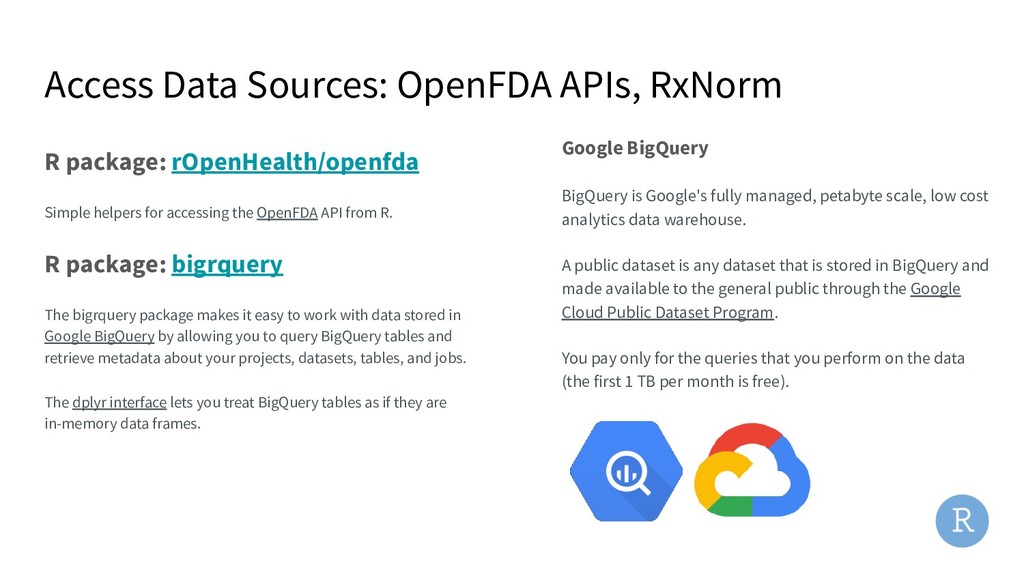
Google's fully managed, petabyte scale, low cost analytics data warehouse. A public dataset is any dataset that is stored in BigQuery and made available to the general public through the Google Cloud Public Dataset Program. You pay only for the queries that you perform on the data (the first 1 TB per month is free). R package: rOpenHealth/openfda Simple helpers for accessing the OpenFDA API from R. R package: bigrquery The bigrquery package makes it easy to work with data stored in Google BigQuery by allowing you to query BigQuery tables and retrieve metadata about your projects, datasets, tables, and jobs. The dplyr interface lets you treat BigQuery tables as if they are in-memory data frames.
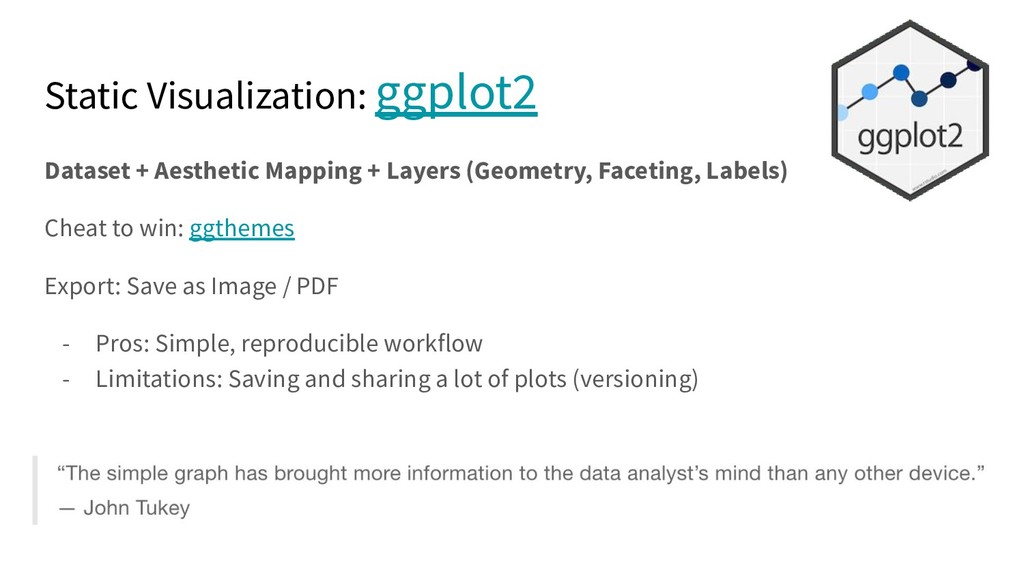
Faceting, Labels) Cheat to win: ggthemes Export: Save as Image / PDF - Pros: Simple, reproducible workflow - Limitations: Saving and sharing a lot of plots (versioning)