Upgrade to Pro — share decks privately, control downloads, hide ads and more …

Linux Tracing Technologies for Rust

Kenta Tada
October 09, 2021

Linux Tracing Technologies for Rust

Kenta Tada

October 09, 2021
Tweet

More Decks by Kenta Tada

Other Decks in Programming

Transcript

  1. R&D Center, Sony Group Corporation
    Copyright 2021 Sony Group Corporation
    Linux Tracing Technologies for Rust
    Information Exchange Meeting for Container Technologies part 15
    Kenta Tada

    View Slide

  2. About me
    ⚫ Kenta Tada
    ⚫ System Software Engineer, R&D Center, Sony Group
    Corporation
    2

    View Slide

  3. Agenda
    ⚫ Linux Tracing Technologies
    ⚫ Uprobes
    ⚫ USDT
    ⚫ Rust with Linux Tracers
    ⚫ Container Runtime Debug
    3

    View Slide

  4. Environment
    ⚫ Linux Kernel v5.14.9
    ⚫ rustc 1.55.0
    4

    View Slide

  5. Linux Tracing Technologies
    5

    View Slide

  6. Overview
    6
    https://sched.co/TPGS

    View Slide

  7. Summary
    ⚫ Data sources
    • Kprobes
    • Tracepoints
    • Uprobes
    • Uprobes + USDT
    ⚫ Tools
    • Perf
    • BCC(BPF Compiler Collection)
    • bpftrace
    • SystemTap
    7

    View Slide

  8. Uprobes
    8

    View Slide

  9. Uprobes
    ⚫ Uprobes : User-space Probes
    ⚫ Uprobes helps us to trace applications without modifying
    source codes.
    ⚫ If you investigate the offset of the probe point, you can
    probe functions.
    ⚫ Uretprobes provides the probe point at the exit of functions.
    9

    View Slide

  10. Uprobes interfaces
    ⚫ ftrace’s interface
    • Ex. /sys/kernel/debug/tracing/uprobe_events
    ⚫ perf_event_open(2)
    • perf tools
    • eBPF tools
    ⚫ uprobe_register() in the kernel
    • int uprobe_register(struct inode *inode, loff_t offset, struct
    uprobe_consumer *uc);
    • Kernel modules can use uprobe_register() to register a probe.
    – Ex. https://qiita.com/kentaost/items/1c749012d21fb2c8745e
    10

    View Slide

  11. How to use uprobe_register()
    11
    #define DEBUGGEE_FILE "/home/kentaost/debuggee_app"
    #define DEBUGGEE_FILE_OFFSET 
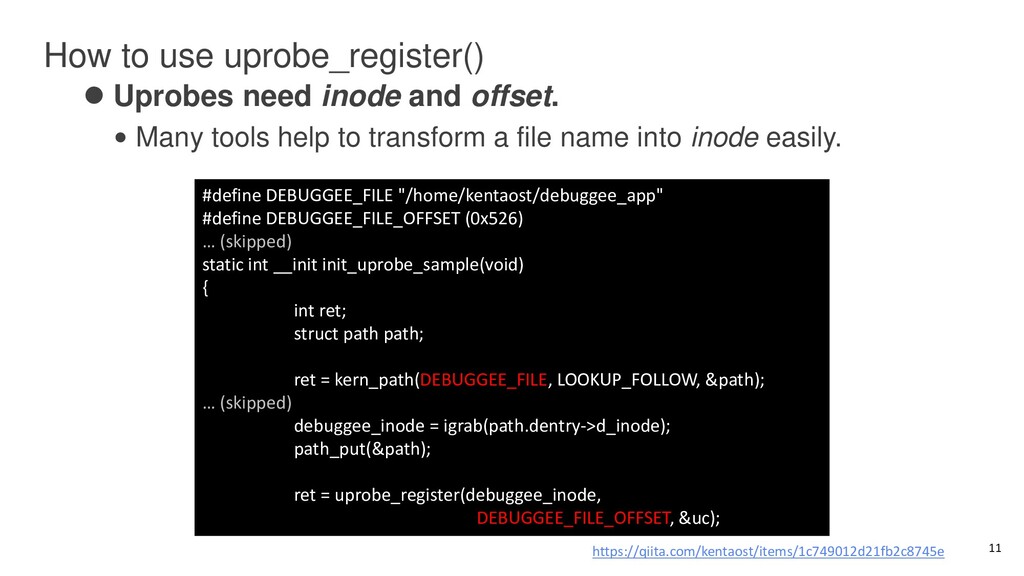
(0x526)
    … (skipped)
    static int __init init_uprobe_sample(void)
    {
    int ret;
    struct path path;
    ret = kern_path(DEBUGGEE_FILE, LOOKUP_FOLLOW, &path);
    … (skipped)
    debuggee_inode = igrab(path.dentry->d_inode);
    path_put(&path);
    ret = uprobe_register(debuggee_inode,
    DEBUGGEE_FILE_OFFSET, &uc);
    https://qiita.com/kentaost/items/1c749012d21fb2c8745e
    ⚫ Uprobes need inode and offset.
    • Many tools help to transform a file name into inode easily.

    View Slide

  12. How to probe functions
    ⚫ Breakpoint instruction is used to probe functions.
    ⚫ After the handlers are executed, kernel will single-step the
    original instruction.
    12
    https://dev.framing.life/tracing/uprobes-and-int3-insn/

    View Slide

  13. How to set up a breakpoint for Uprobes
    ⚫ Existing processes before the prove point is registered
    • When uprobe_register() is called, register_for_each_vma() inserts
    breakpoints in existing processes.
    ⚫ New processes after the prove point is registered
    • uprobe_mmap() inserts breakpoints in new processes.
    • Ex.
    mmap(2)
    → mmap_region() in the kernel
    → uprobe_mmap() in the kernel
    13

    View Slide

  14. Use Case : SSL sniffer
    ⚫ Set uprobes on SSL_write() and SSL_read() in TLS Library.
    14
    https://blog.px.dev/ebpf-openssl-tracing/

    View Slide

  15. Demo : How the breakpoint is installed for Uprobes??
    15

    View Slide

  16. USDT
    16

    View Slide

  17. USDT
    ⚫ USDT : Userland Statically Defined Tracing
    ⚫ USDT probes provide applications with static tracing
    markers.
    ⚫ You need to add markers in the source code manually.
    ⚫ You need to investigate the offset of markers
    from .note.stapsdt section when you trace applications.
    • Finally, Uprobes are used to probe the probe point.
    17

    View Slide

  18. USDT interfaces
    ⚫ Add a marker in your source code
    • Install a package
    – Ex. # apt install systemtap-sdt-dev
    • Write a header in the C source code
    – #include
    • Write a provider at the location when you want to probe
    – DTRACE_PROBE2(provider, name, arg1, arg2)
    ⚫ When the code is compiled, USDT probes will be nop.
    18
    [C source code]

    DTRACE_PROBE2(…)
    Compile
    [ELF Binary]

    nop

    .note.stapsdt

    View Slide

  19. How to use USDT
    1. When the program is loaded at first, the instruction is nop.
    2. The tracer program reads the .note.stapsdt section of the
    tracee program.
    3. The tracer program changes the instruction from nop to
    breakpoint using Uprobes.
    19

    View Slide

  20. Example : Slow queries
    ⚫ Some applications have already supported USDT.
    • MySQL, PostgreSQL, Node.js and so on.
    ⚫ dbslower.py from BCC is a tool to investigate slow queries.
    • query__start
    • query__done
    ⚫ dbslower.py tries to use Uprobes only if MySQL is without
    USDT support.
    • https://github.com/iovisor/bcc/pull/1239
    20

    View Slide

  21. Rust with Linux Tracers
    21

    View Slide

  22. What we need to use Uprobes/USDT for Rust
    ⚫ Mangling
    ⚫ USDT for Rust
    22

    View Slide

  23. Mangling
    ⚫ Rust symbols are mangled in the binary except using the
    no_mangle attribute.
    ⚫ You need to demangle symbols to find the offset of the
    specified function before using Uprobes.
    ⚫ Tools
    • objdump -Ct
    • https://github.com/rust-lang/rustc-demangle
    23

    View Slide

  24. USDT for Rust
    ⚫ All you need is to inject USDT probes into your ELF binary.
    ⚫ Some tools have been already provided.
    • Ex. https://github.com/cuviper/rust-libprobe
    24

    View Slide

  25. Container Runtime Debug
    25

    View Slide

  26. Container Runtime is complex
    26
    User space
    Kernel space
    cgroup
    Low-Level
    Container Runtime
    systemd
    cgroupfs
    driver
    systemd
    driver
    D-Bus
    High-Level
    Container RUntime
    Kubelet
    cgroupfs
    driver
    systemd
    driver
    D-Bus

    View Slide

  27. Demo : Trace the value of CPU shares without modification
    27

    View Slide

  28. Key takeaways
    ⚫ Uprobes is a great technology to observe applications.
    ⚫ USDT enhance the traceability of Uprobes.
    ⚫ Make Rust libraries more traceable using kernel
    technologies.
    28

    View Slide

  29. SONY is a registered trademark of Sony Group Corporation.
    Names of Sony products and services are the registered trademarks and/or trademarks of Sony Group Corporation or its Group companies.
    Other company names and product names are registered trademarks and/or trademarks of the respective companies.

    View Slide