Presentation on data warehousing given in 2002 to the National Fraternal Congress of America (NFCA), now the American Fraternal Alliance. Three sections:
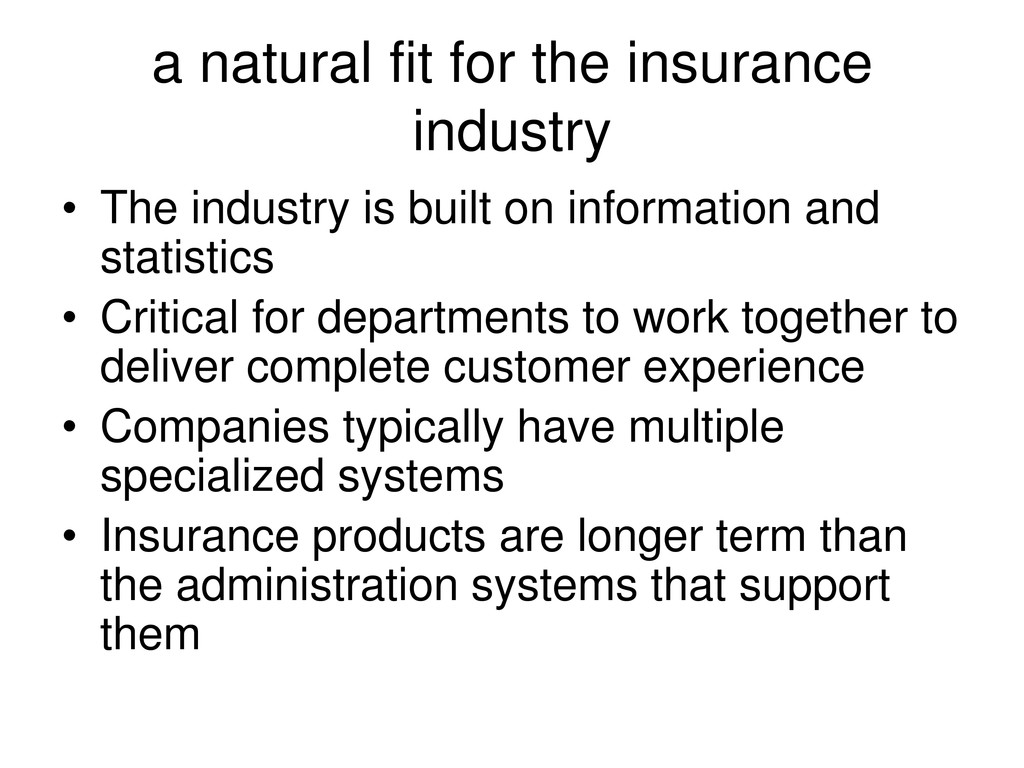
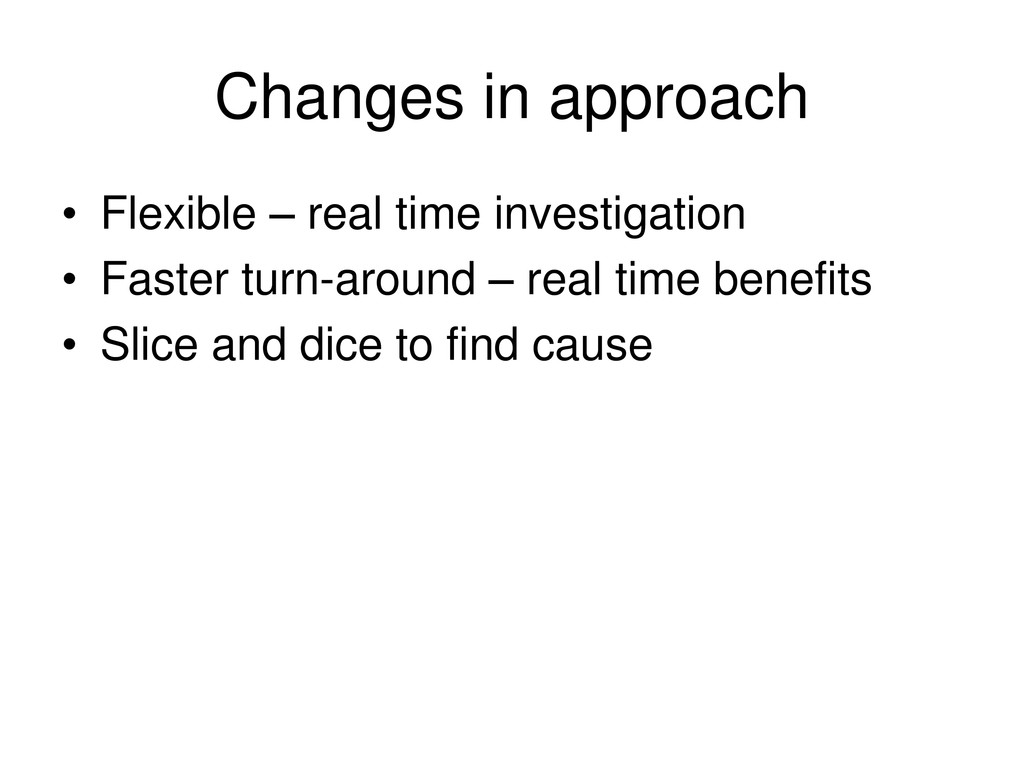
is built on information and statistics • Critical for departments to work together to deliver complete customer experience • Companies typically have multiple specialized systems • Insurance products are longer term than the administration systems that support them
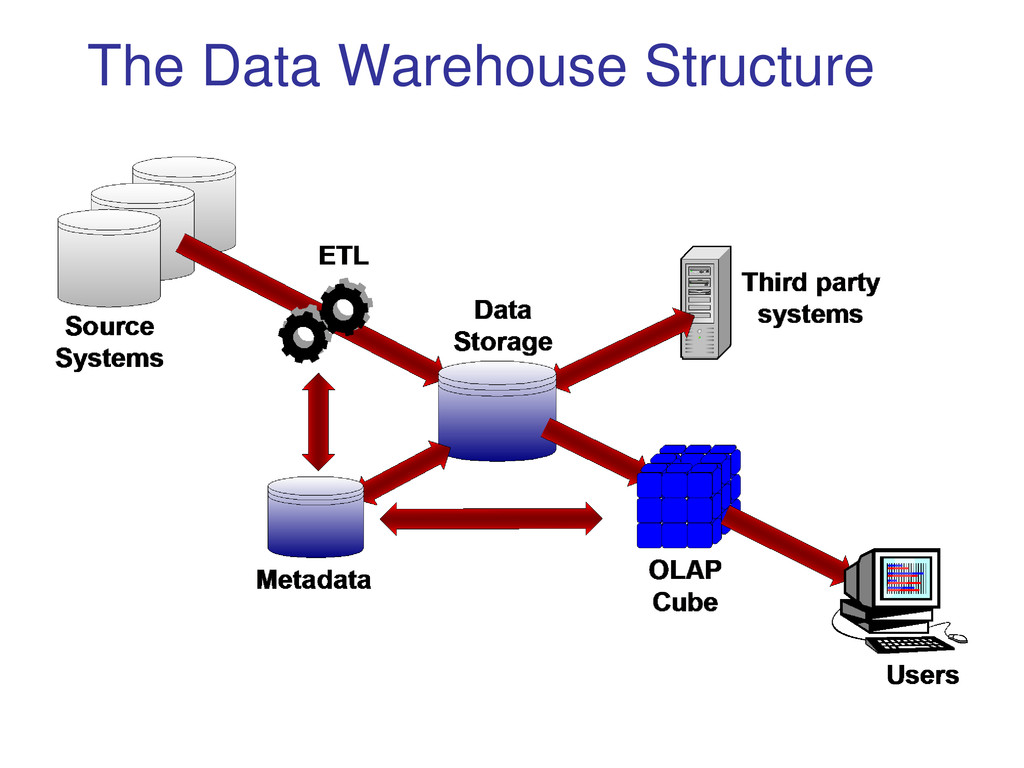
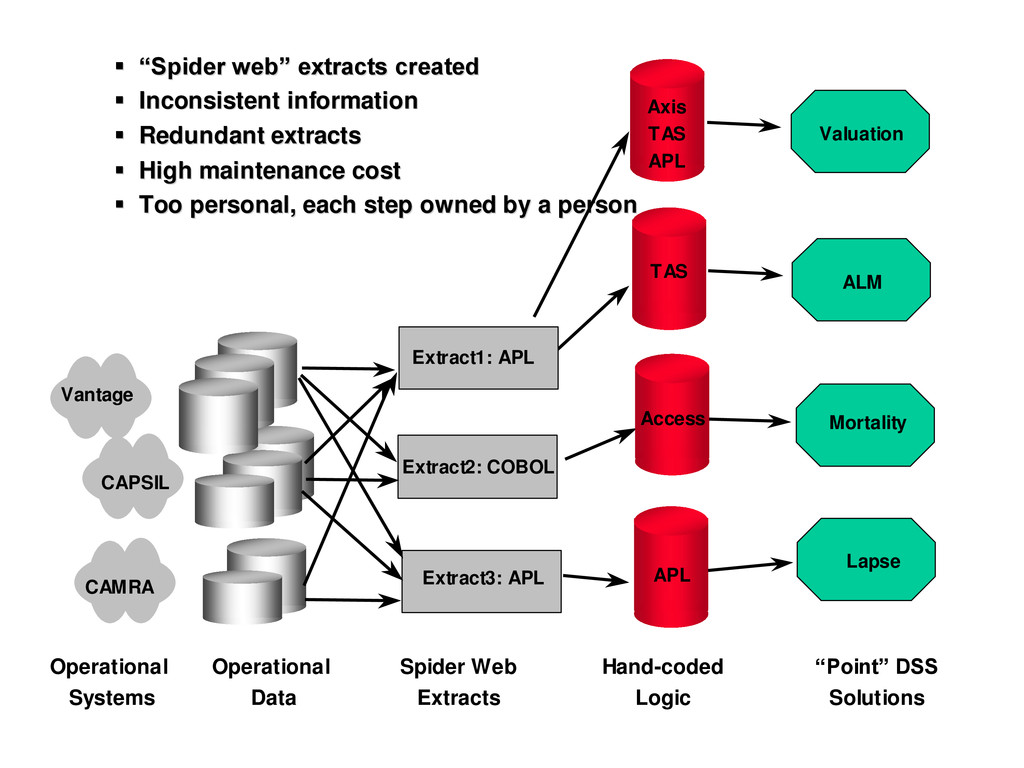
Inconsistent information Inconsistent information Redundant extracts Redundant extracts High maintenance cost High maintenance cost Too personal, each step owned by a person Too personal, each step owned by a person Operational Operational Systems Systems Operational Operational Data Data Spider Web Spider Web Extracts Extracts Hand Hand- -coded coded Logic Logic “Point” DSS “Point” DSS Solutions Solutions Vantage CAPSIL CAMRA Extract1: APL Extract2: COBOL Extract3: APL ALM Mortality Lapse TAS Access APL Valuation Axis TAS APL
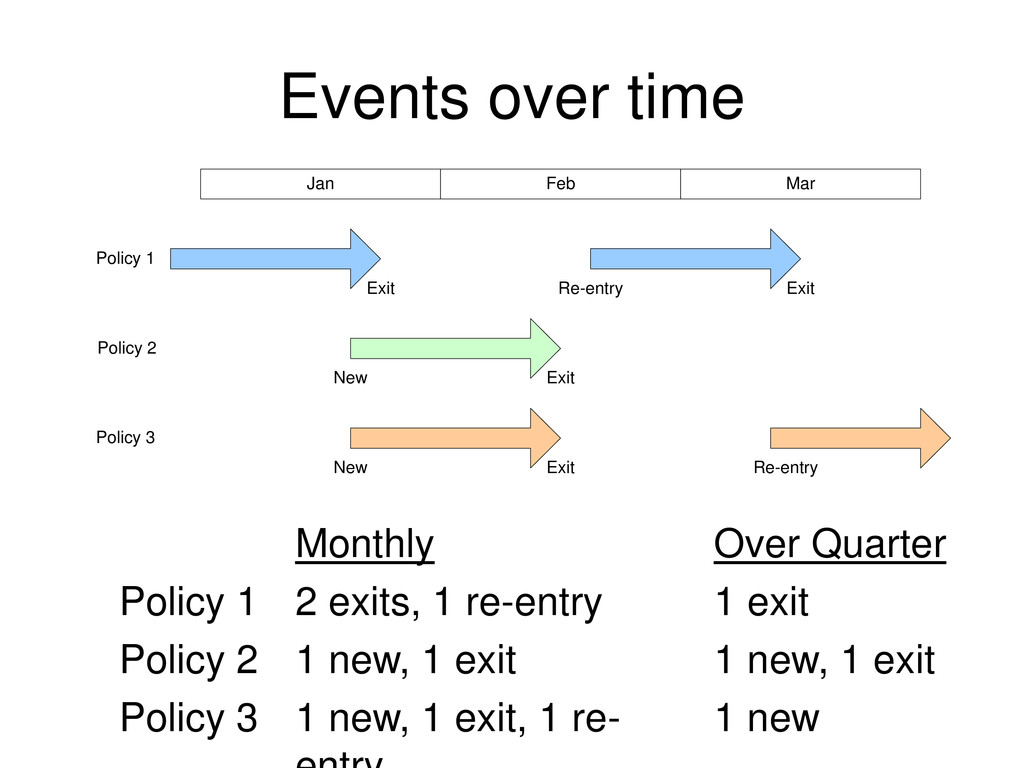
start, entries, A/E Analysis by (10) – e.g. Policy Count, Premium, Risk Amount Ratio by (6) – e.g. Policy Count, Sum Assured Three dimensions instead of 540 measures
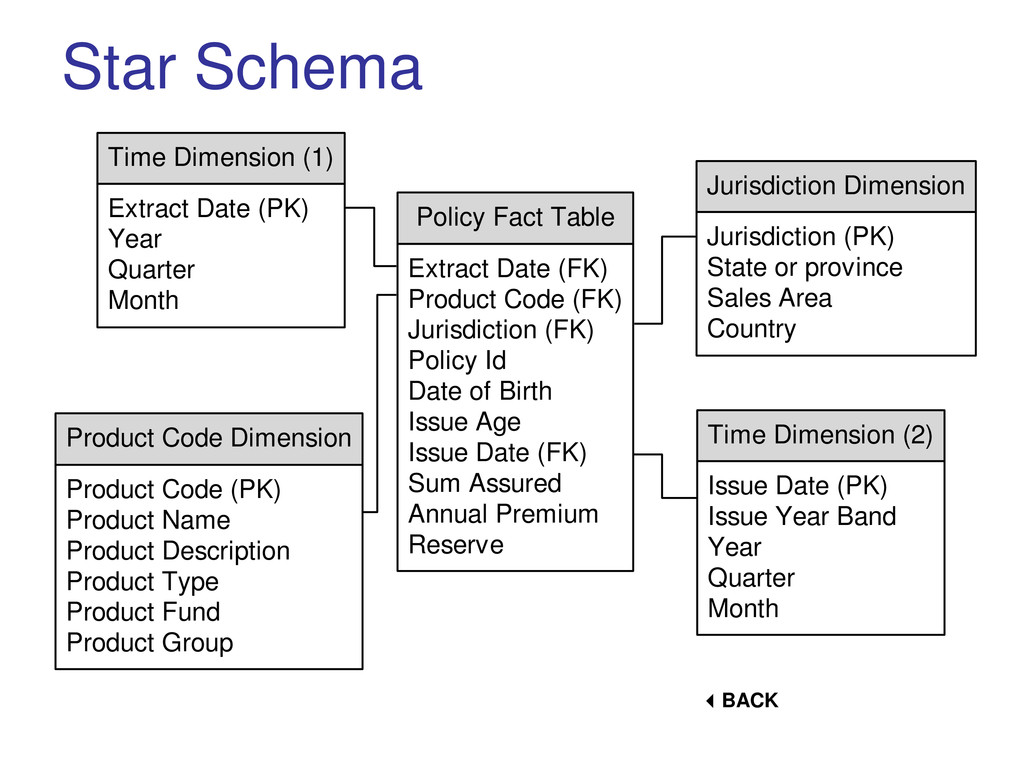
Code (FK) Jurisdiction (FK) Policy Id Date of Birth Issue Age Issue Date (FK) Sum Assured Annual Premium Reserve Time Dimension (1) Extract Date (PK) Year Quarter Month Product Code Dimension Product Code (PK) Product Name Product Description Product Type Product Fund Product Group Jurisdiction Dimension Jurisdiction (PK) State or province Sales Area Country Time Dimension (2) Issue Date (PK) Issue Year Band Year Quarter Month
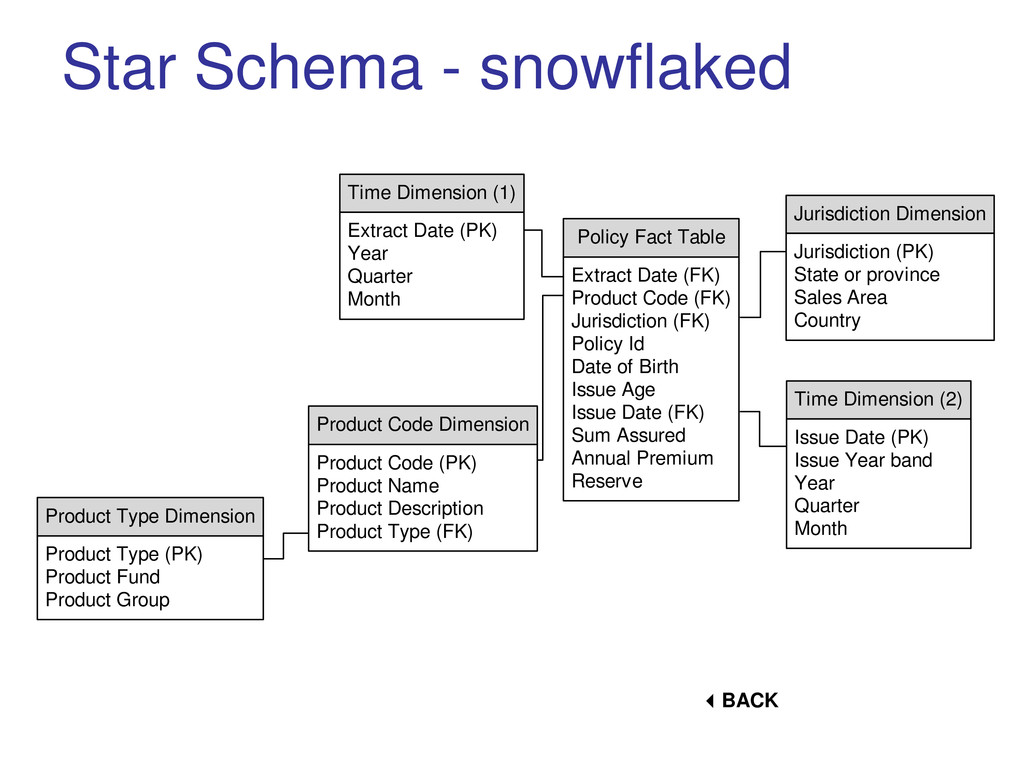
(FK) Product Code (FK) Jurisdiction (FK) Policy Id Date of Birth Issue Age Issue Date (FK) Sum Assured Annual Premium Reserve Time Dimension (1) Extract Date (PK) Year Quarter Month Product Code Dimension Product Code (PK) Product Name Product Description Product Type (FK) Jurisdiction Dimension Jurisdiction (PK) State or province Sales Area Country Time Dimension (2) Issue Date (PK) Issue Year band Year Quarter Month Product Type Dimension Product Type (PK) Product Fund Product Group
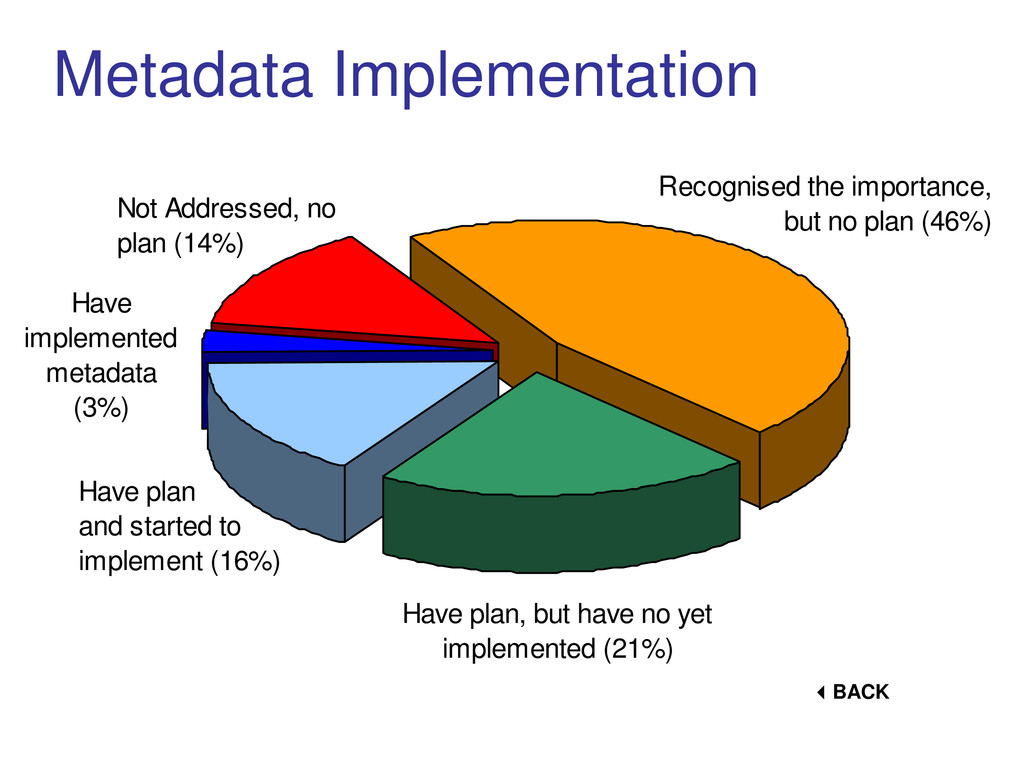
Recognised the importance, but no plan (46%) Not Addressed, no plan (14%) Have implemented metadata (3%) Have plan and started to implement (16%) BACK
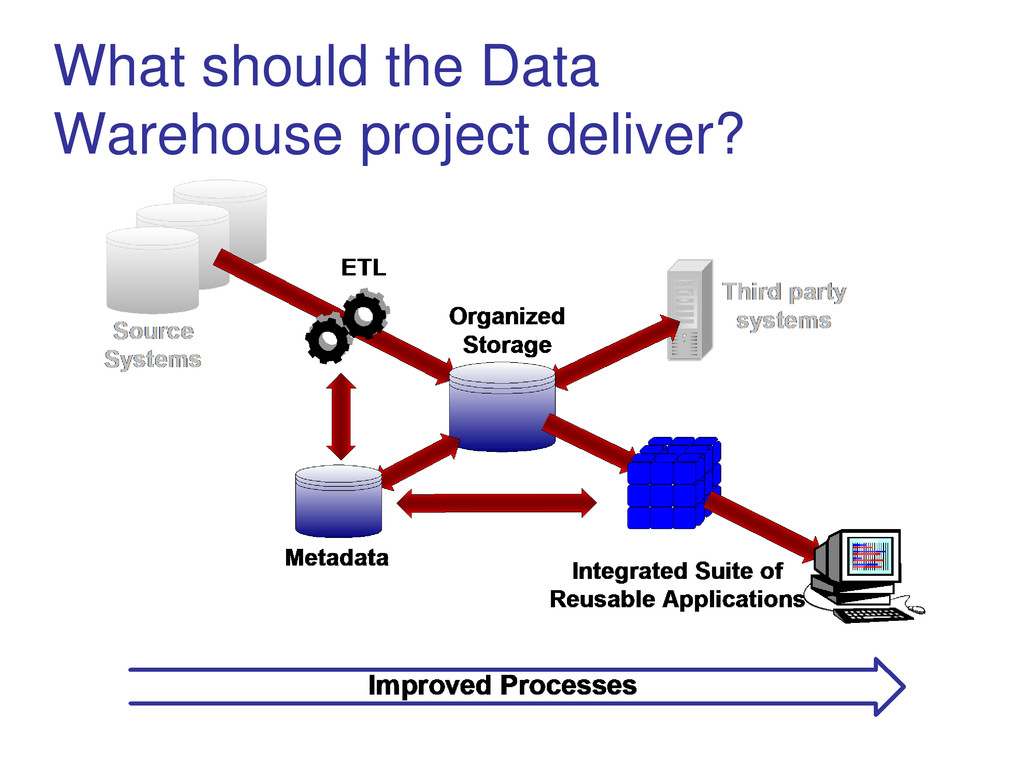
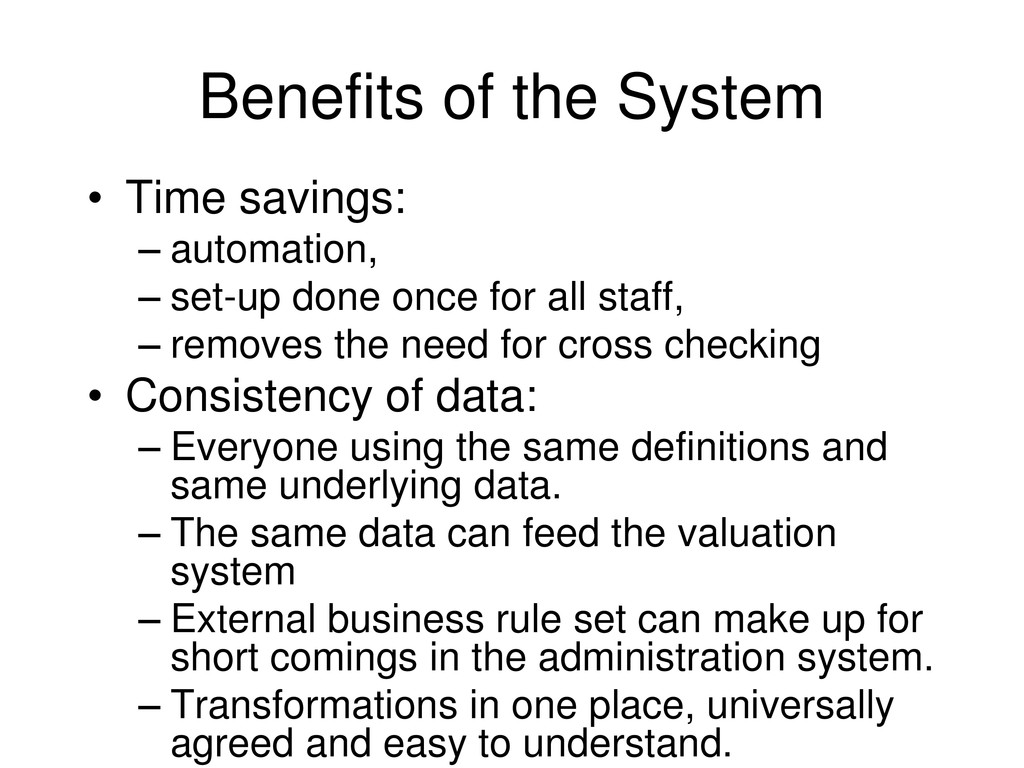
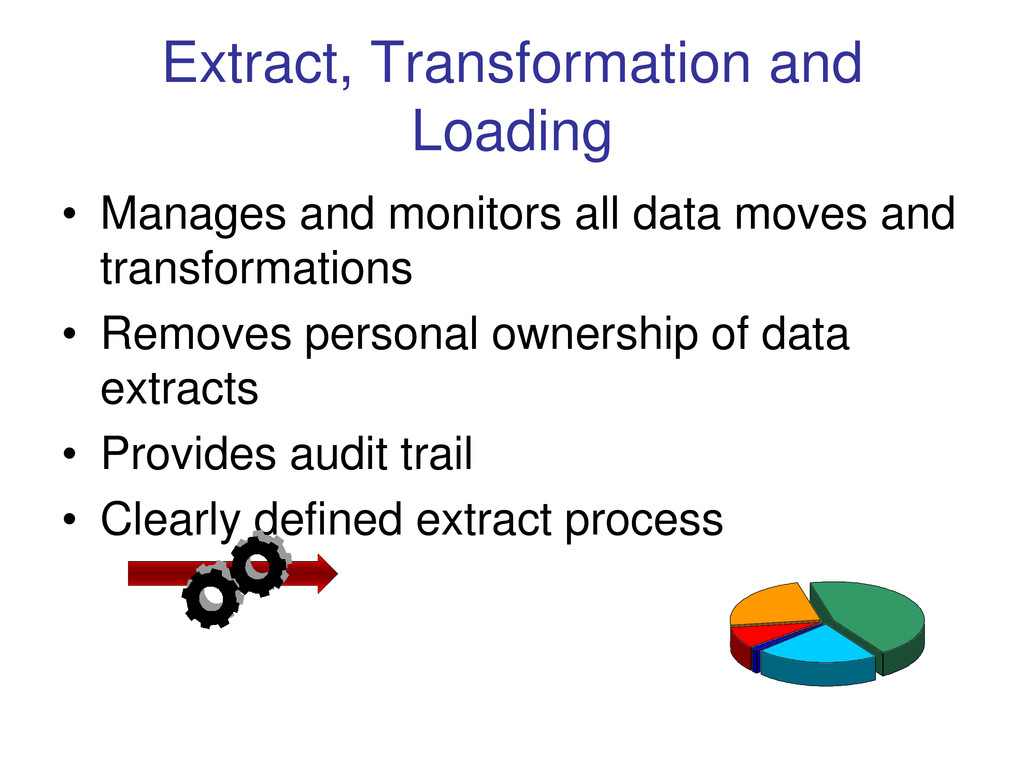
set-up done once for all staff, – removes the need for cross checking • Consistency of data: – Everyone using the same definitions and same underlying data. – The same data can feed the valuation system – External business rule set can make up for short comings in the administration system. – Transformations in one place, universally agreed and easy to understand.
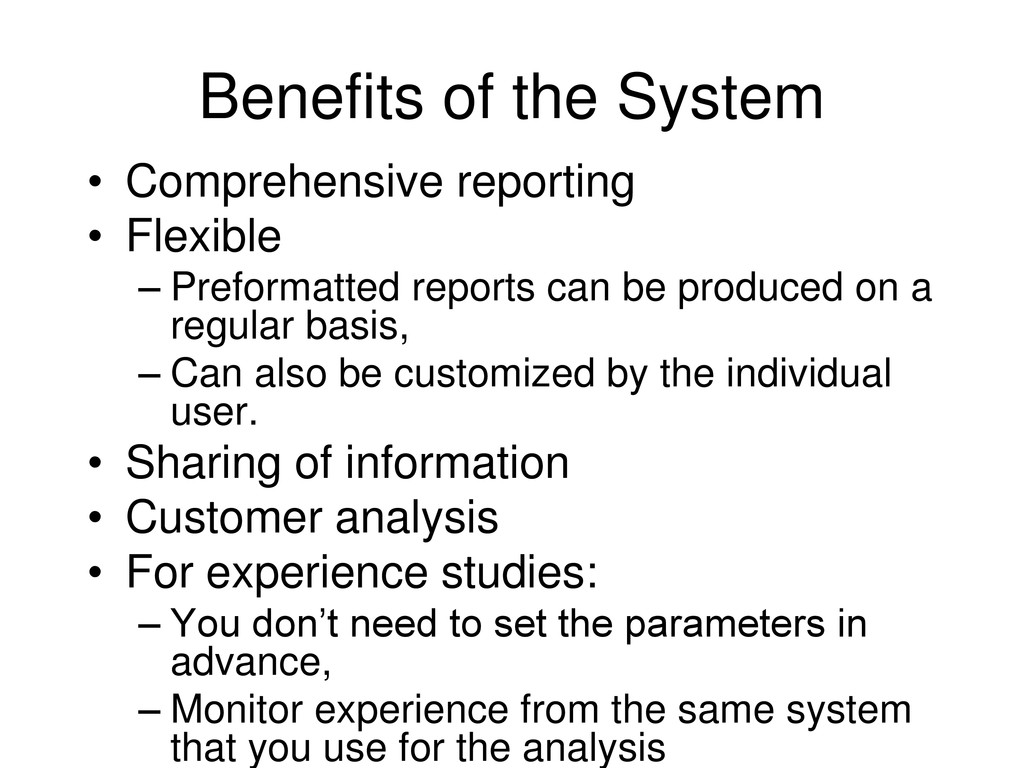
Preformatted reports can be produced on a regular basis, – Can also be customized by the individual user. • Sharing of information • Customer analysis • For experience studies: – You don’t need to set the parameters in advance, – Monitor experience from the same system that you use for the analysis
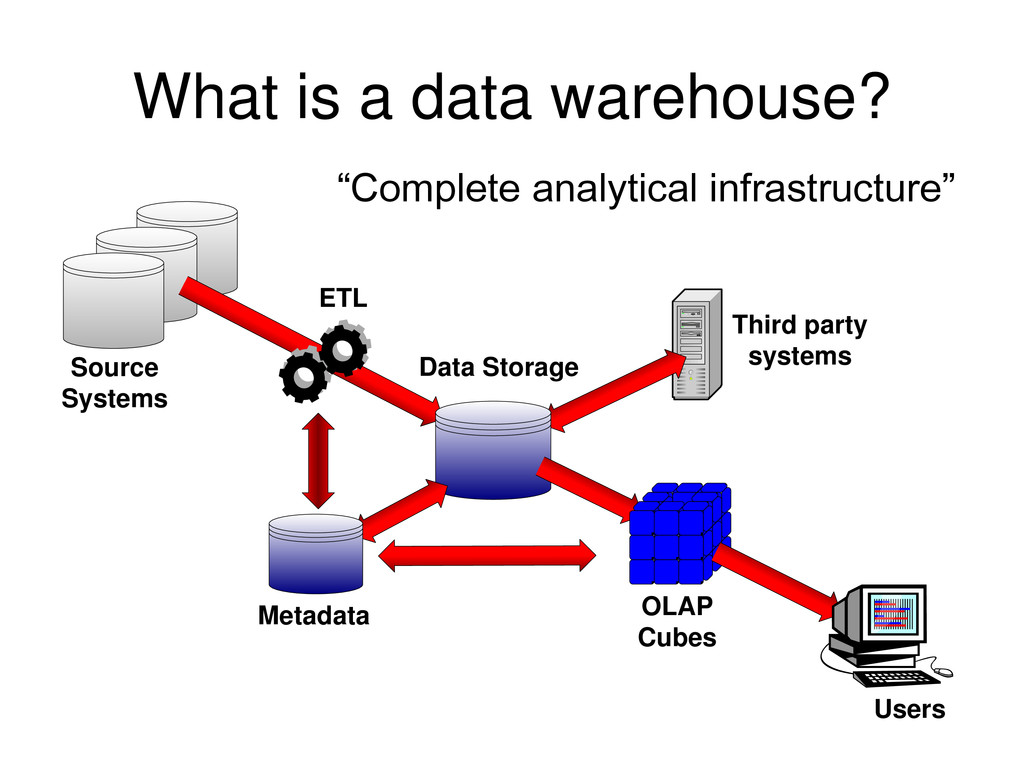
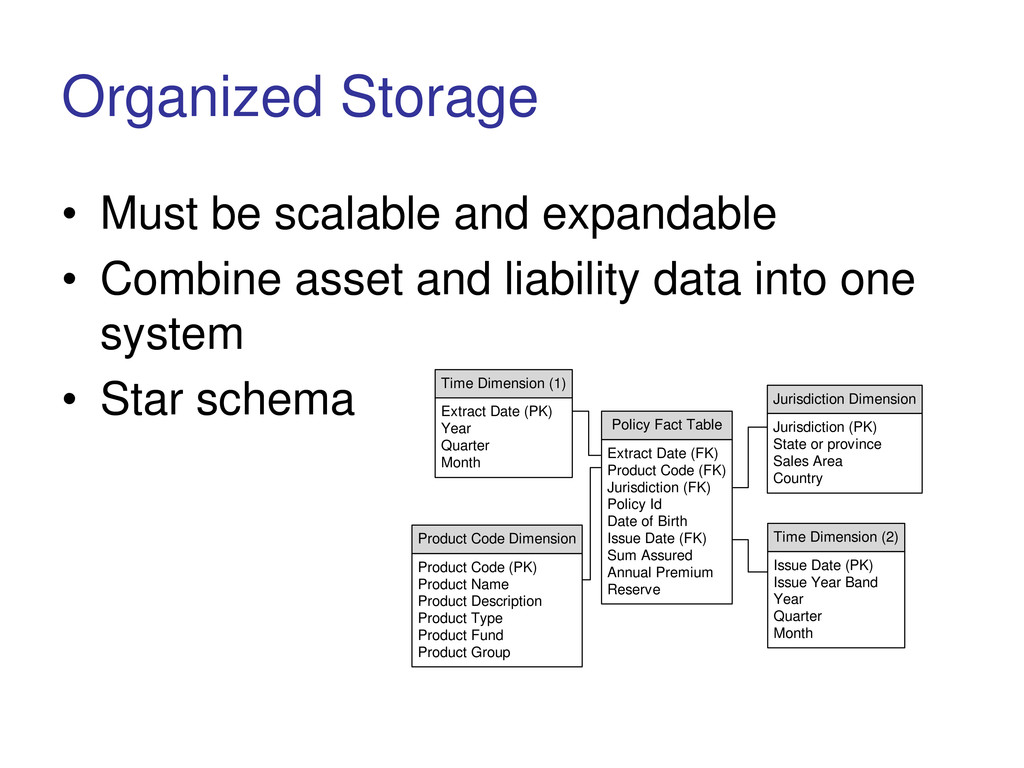
asset and liability data into one system • Star schema Policy Fact Table Extract Date (FK) Product Code (FK) Jurisdiction (FK) Policy Id Date of Birth Issue Date (FK) Sum Assured Annual Premium Reserve Time Dimension (1) Extract Date (PK) Year Quarter Month Product Code Dimension Product Code (PK) Product Name Product Description Product Type Product Fund Product Group Jurisdiction Dimension Jurisdiction (PK) State or province Sales Area Country Time Dimension (2) Issue Date (PK) Issue Year Band Year Quarter Month
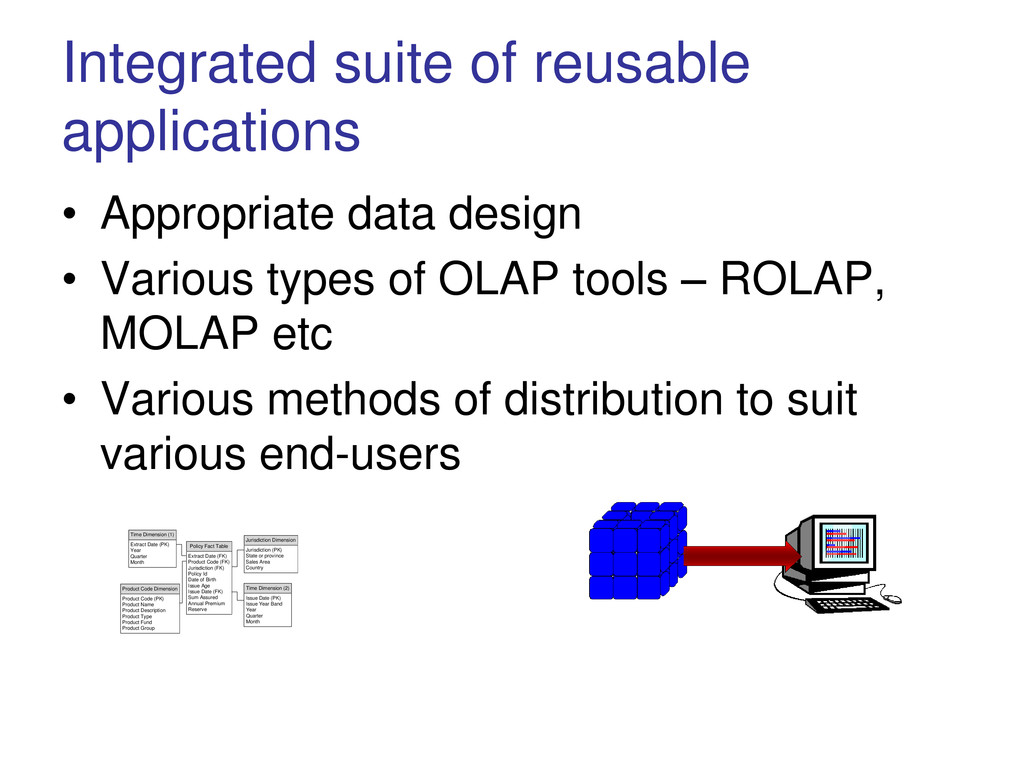
Various types of OLAP tools – ROLAP, MOLAP etc • Various methods of distribution to suit various end-users Policy Fact Table Extract Date (FK) Product Code (FK) Jurisdiction (FK) Policy Id Date of Birth Issue Age Issue Date (FK) Sum Assured Annual Premium Reserve Time Dimension (1) Extract Date (PK) Year Quarter Month Product Code Dimension Product Code (PK) Product Name Product Description Product Type Product Fund Product Group Jurisdiction Dimension Jurisdiction (PK) State or province Sales Area Country Time Dimension (2) Issue Date (PK) Issue Year Band Year Quarter Month
![Further Information Presenter Kevin Pledge (416) 429-2692 [email protected] Web •](https://files.speakerdeck.com/presentations/50148b53a049a3000201cc54/slide_30.jpg)