• But, writing correct concurrent programs is even harder • Sharing resources without synchronization: Concurrency Bugs Non-deterministic Scheduling • Example: NetBeans – trying to patch a single class over 14 times for fixing a thread related problem Profiling Concurrency, August 18, 2011
carefully considered design • instead: use testing tools – Analytical Quality Assurance Profiler Dynamic Program Analysis • measure program routines and memory consumption • monitor and trace events, measure the costs • kind of measured values depends on the requirements Profiling Concurrency, August 18, 2011
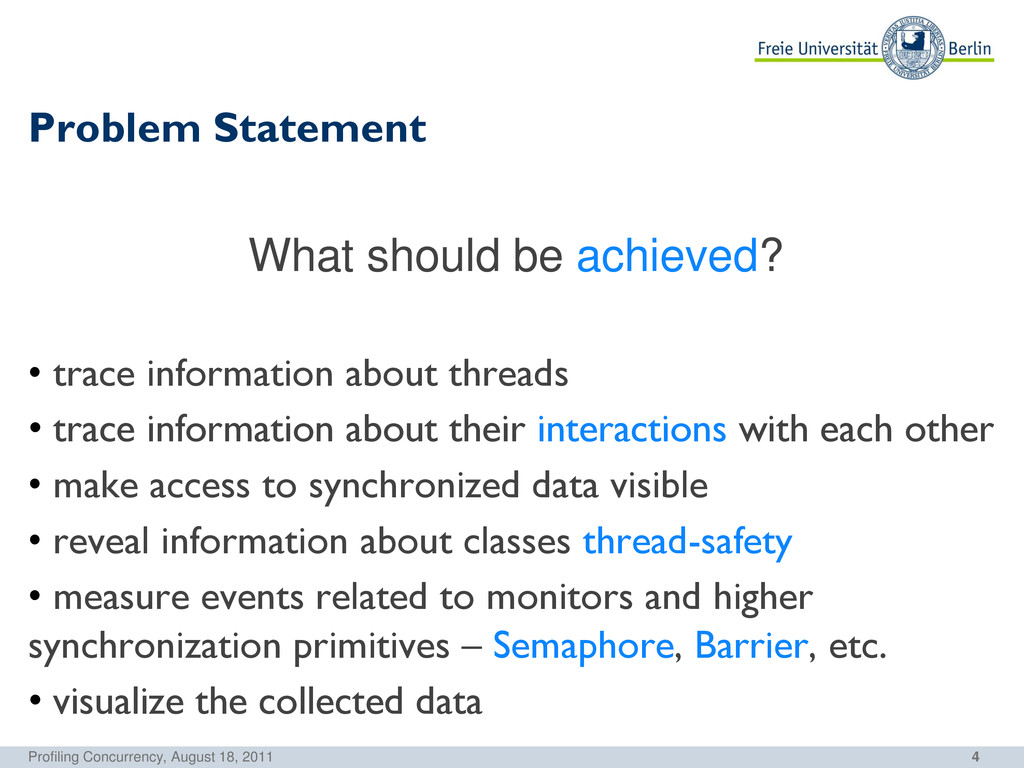
information about their interactions with each other • make access to synchronized data visible • reveal information about classes thread-safety • measure events related to monitors and higher synchronization primitives – Semaphore, Barrier, etc. • visualize the collected data Profiling Concurrency, August 18, 2011 What should be achieved?
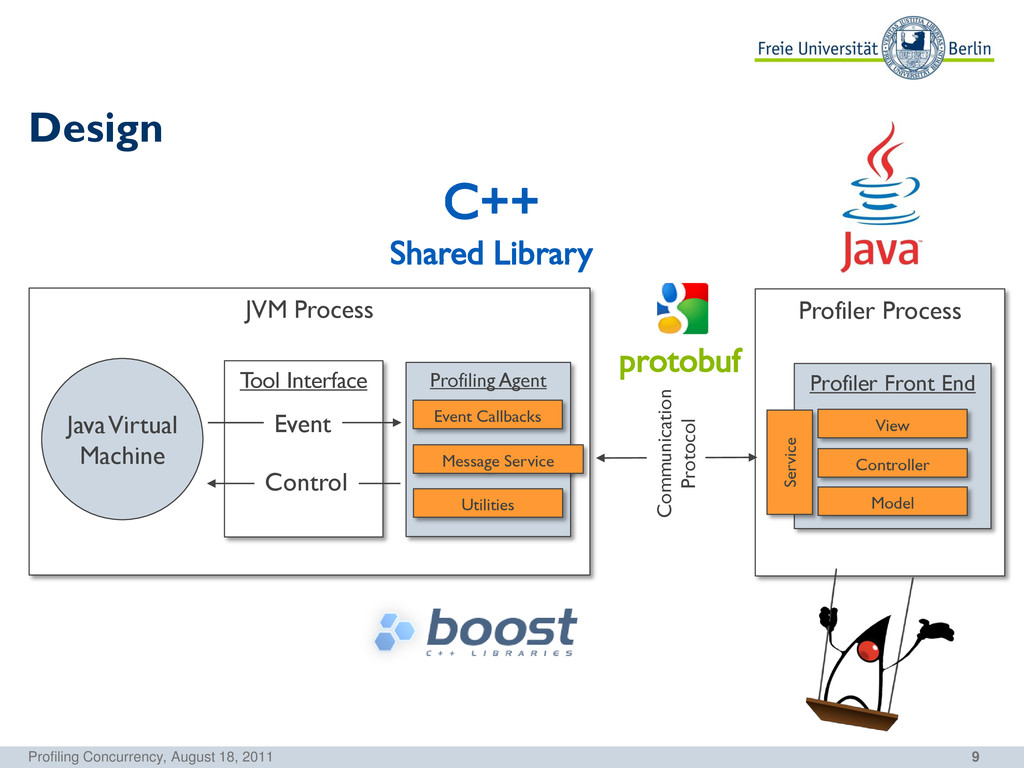
JVMTI decouples JVM and presentation of the profiling information Profiling Concurrency, August 18, 2011 Profiler Process Profiler Front End JVM Process Java Virtual Machine Profiling Agent Tool Interface Event Control Communication Protocol
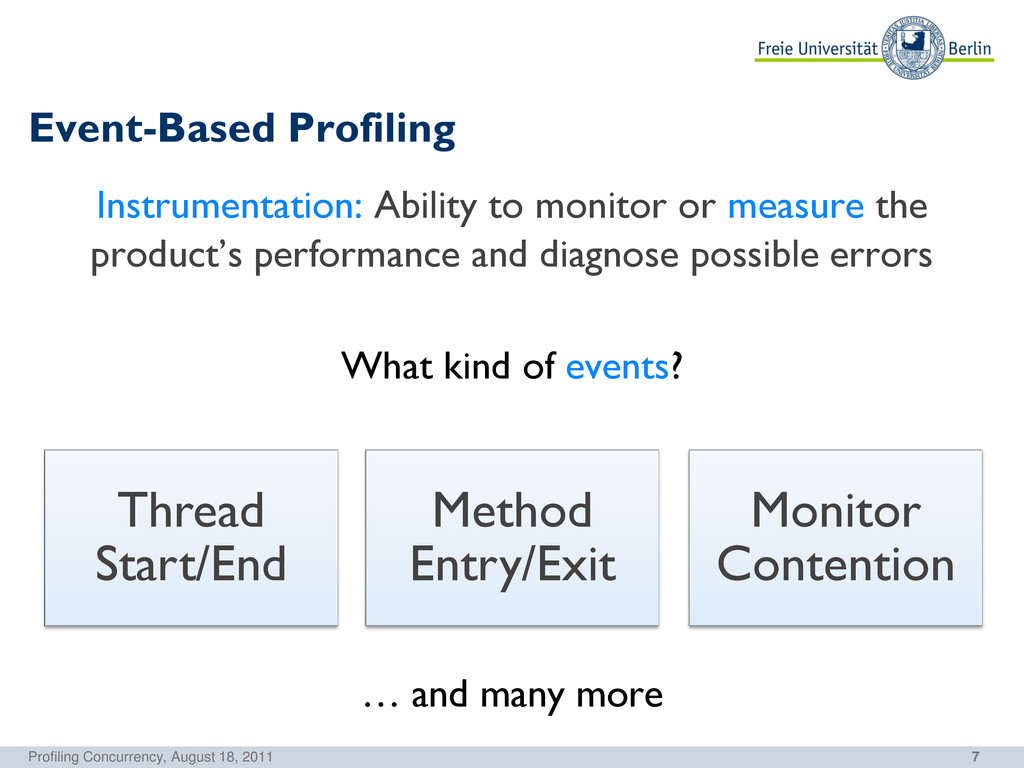
product’s performance and diagnose possible errors What kind of events? … and many more Profiling Concurrency, August 18, 2011 Thread Start/End Method Entry/Exit Monitor Contention
Front End JVM Process Java Virtual Machine Profiling Agent Tool Interface Event Control Communication Protocol C++ Shared Library Event Callbacks Message Service Utilities View Controller Model Service protobuf
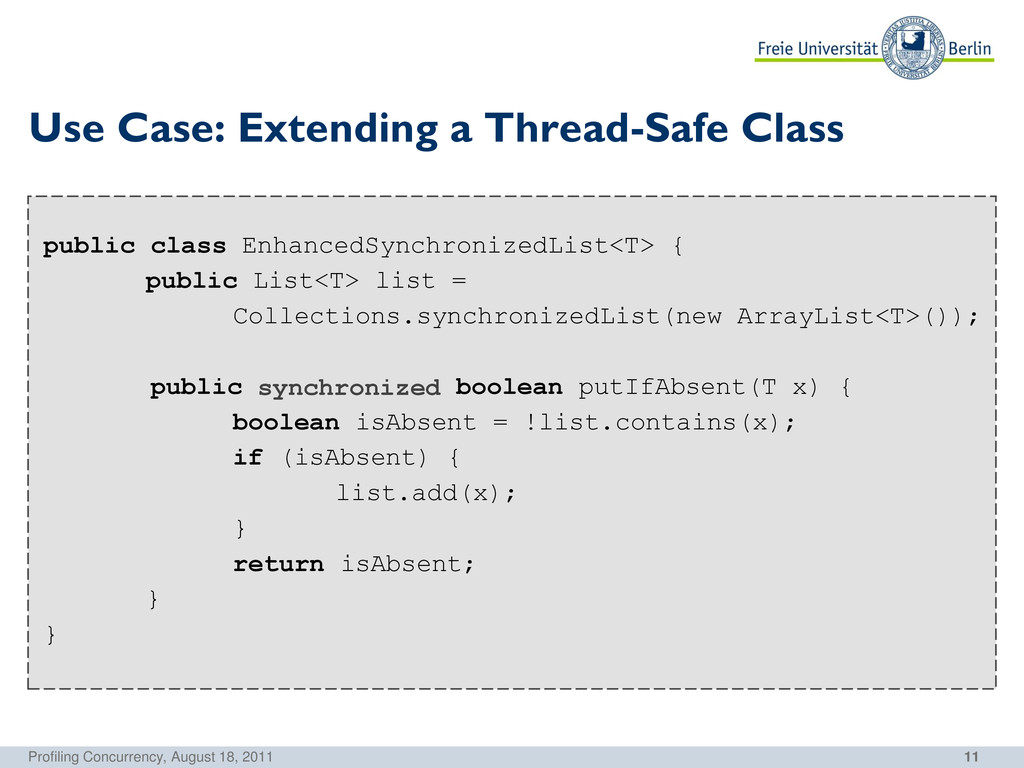
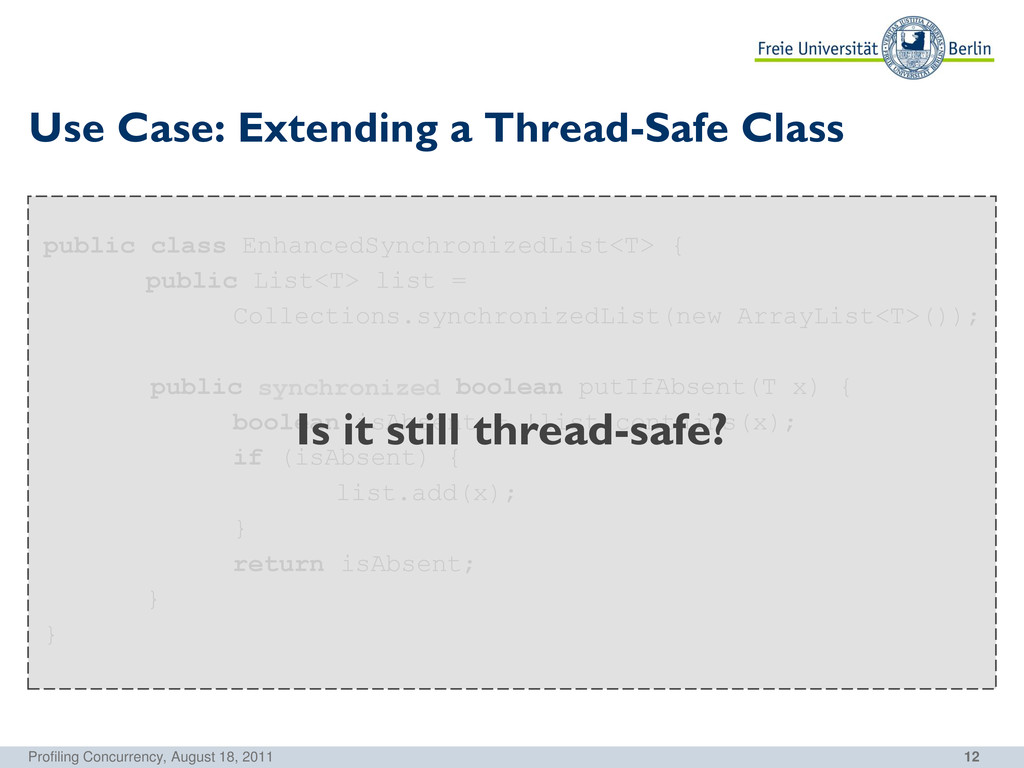
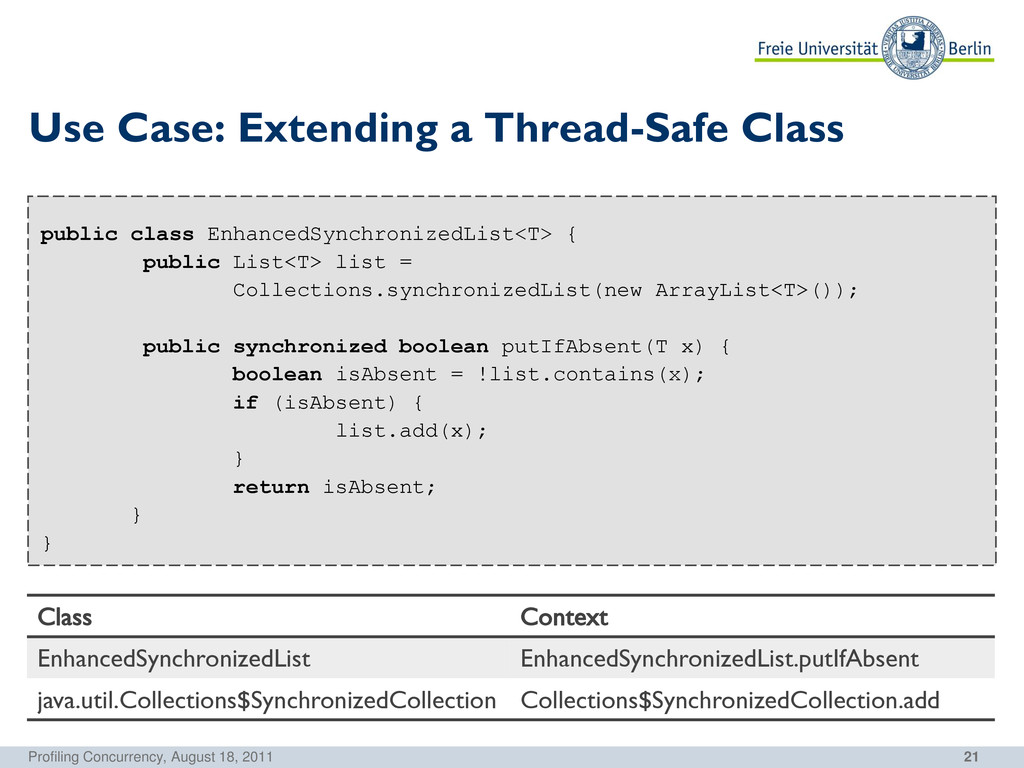
ArrayList<T>()); public boolean putIfAbsent(T x) { boolean isAbsent = !list.contains(x); if (isAbsent) { list.add(x); } return isAbsent; } } Use Case: Extending a Thread-Safe Class Profiling Concurrency, August 18, 2011 synchronized Is it still thread-safe?
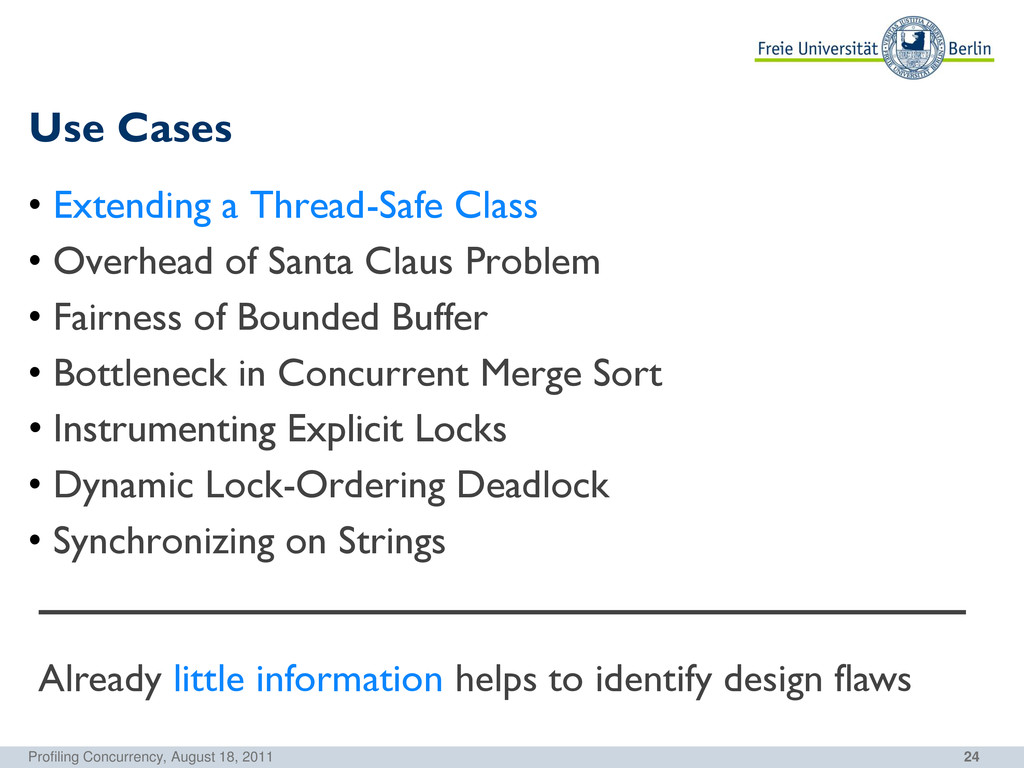
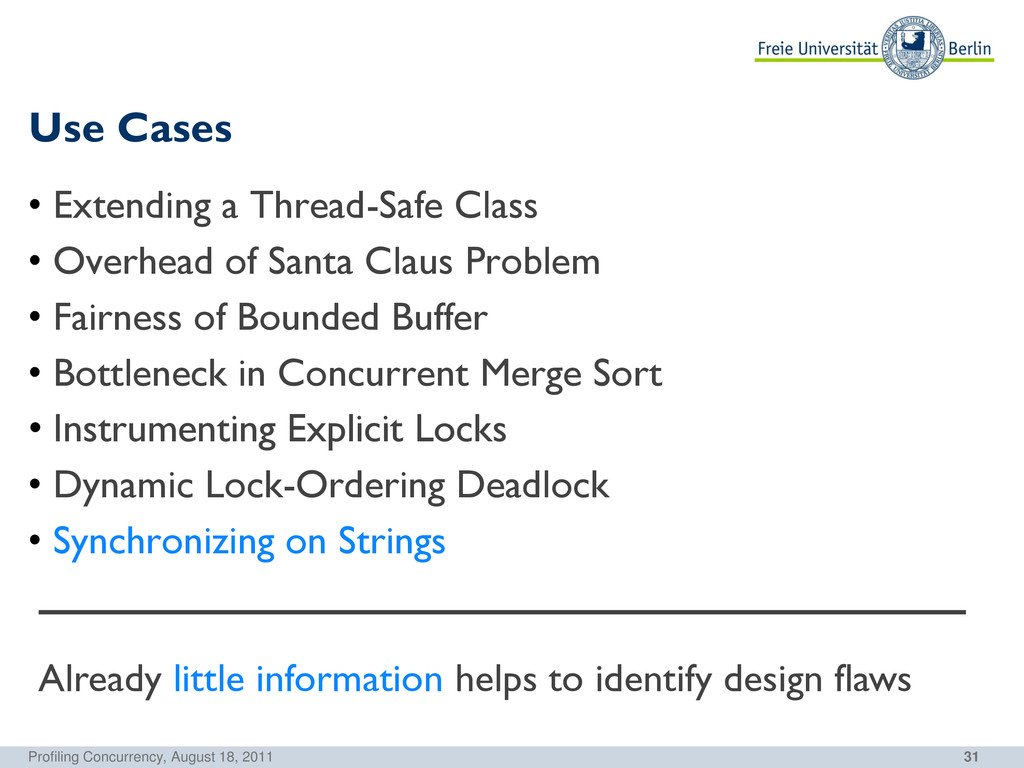
a Thread-Safe Class • Overhead of Santa Claus Problem • Fairness of Bounded Buffer • Bottleneck in Concurrent Merge Sort • Instrumenting Explicit Locks • Dynamic Lock-Ordering Deadlock • Synchronizing on Strings Already little information helps to identify design flaws
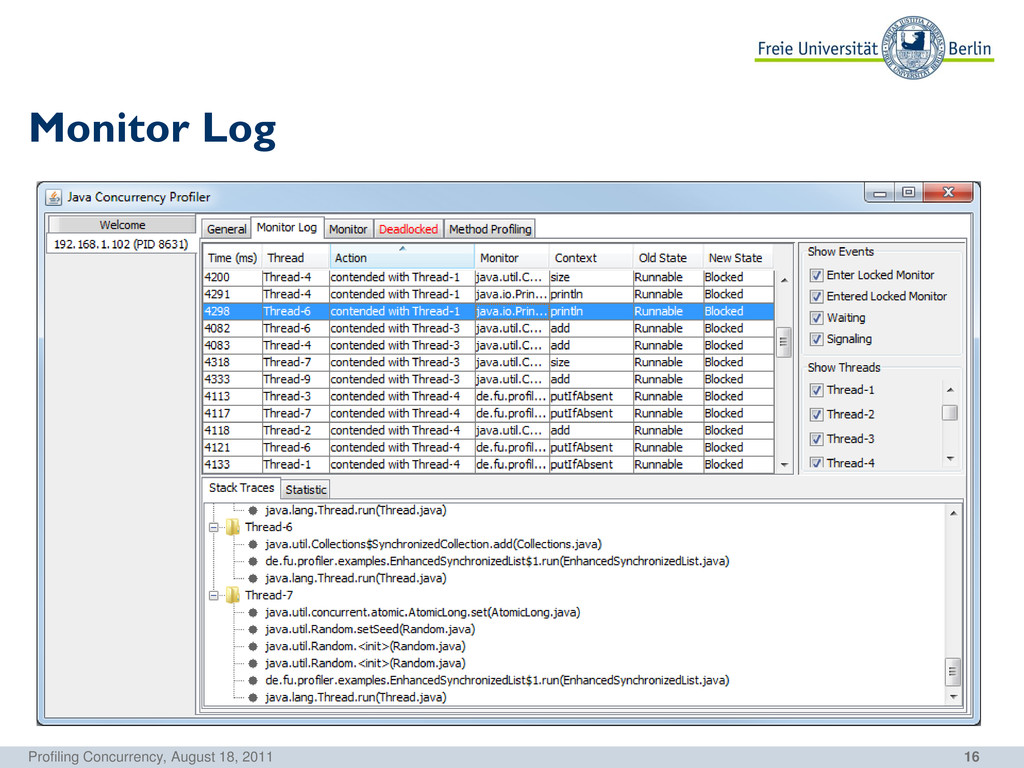
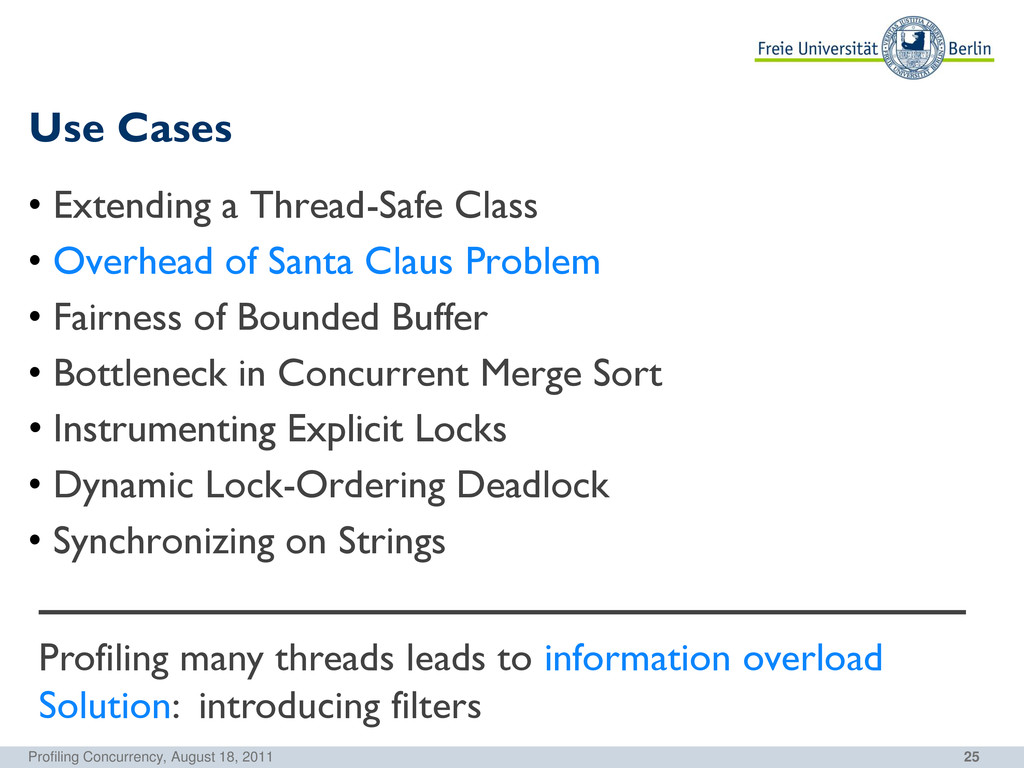
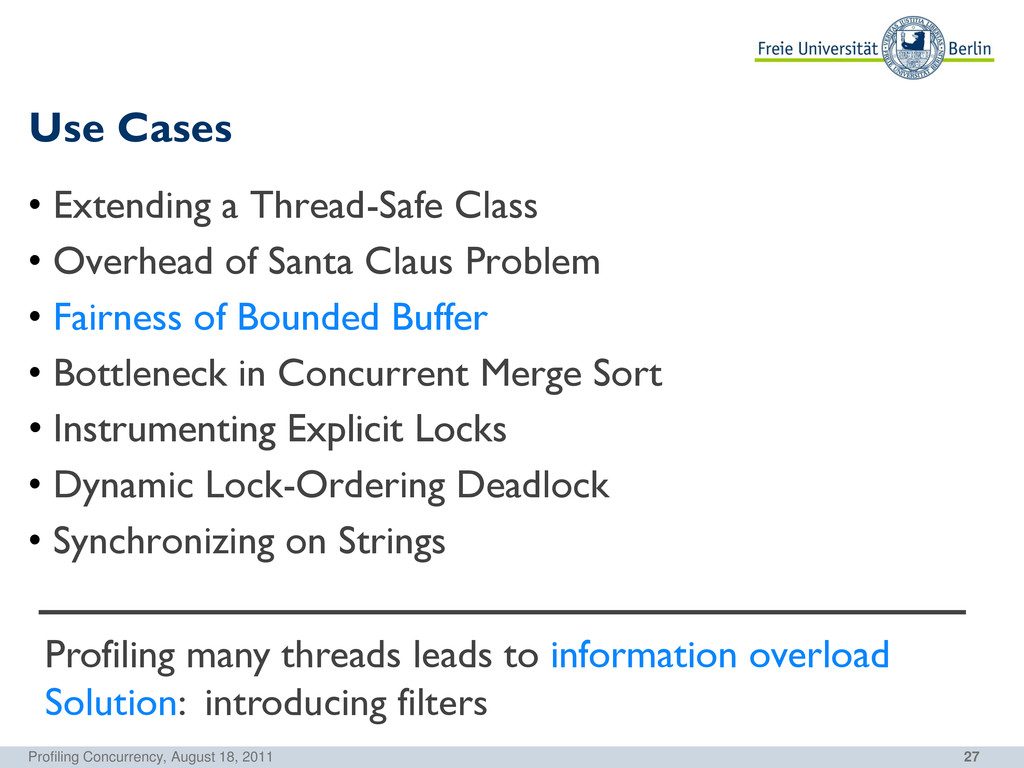
a Thread-Safe Class • Overhead of Santa Claus Problem • Fairness of Bounded Buffer • Bottleneck in Concurrent Merge Sort • Instrumenting Explicit Locks • Dynamic Lock-Ordering Deadlock • Synchronizing on Strings Profiling many threads leads to information overload Solution: introducing filters
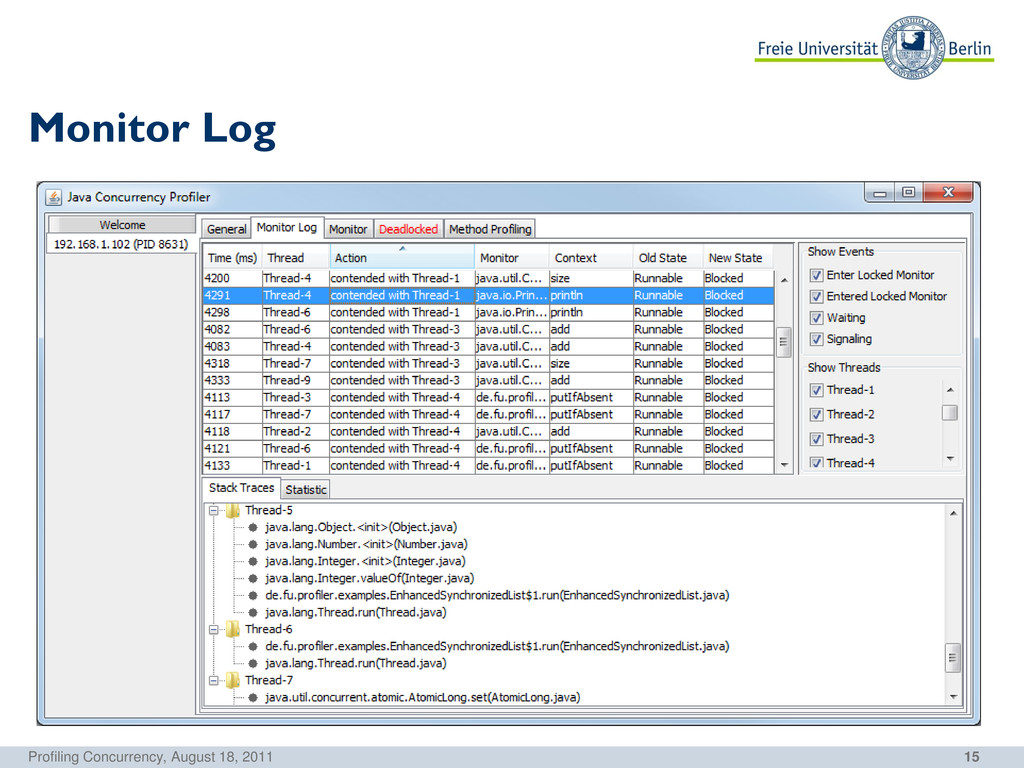
a Thread-Safe Class • Overhead of Santa Claus Problem • Fairness of Bounded Buffer • Bottleneck in Concurrent Merge Sort • Instrumenting Explicit Locks • Dynamic Lock-Ordering Deadlock • Synchronizing on Strings Stack traces put the traced events into a context
a Thread-Safe Class • Overhead of Santa Claus Problem • Fairness of Bounded Buffer • Bottleneck in Concurrent Merge Sort • Instrumenting Explicit Locks • Dynamic Lock-Ordering Deadlock • Synchronizing on Strings Profiling many threads leads to information overload Solution: introducing filters
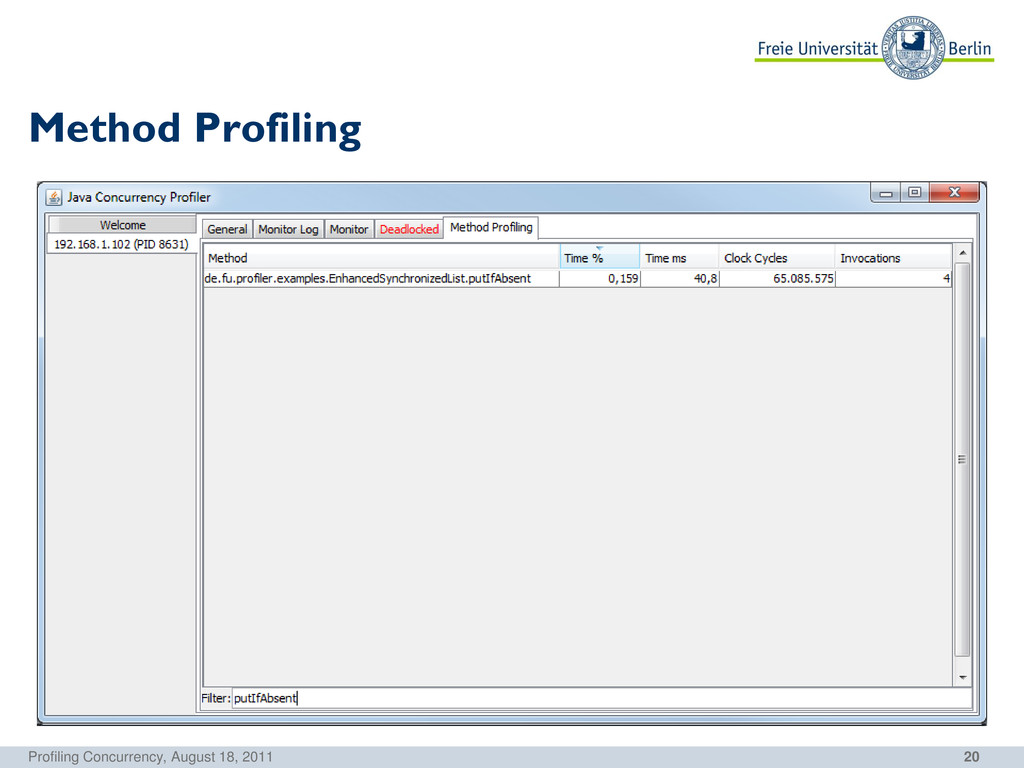
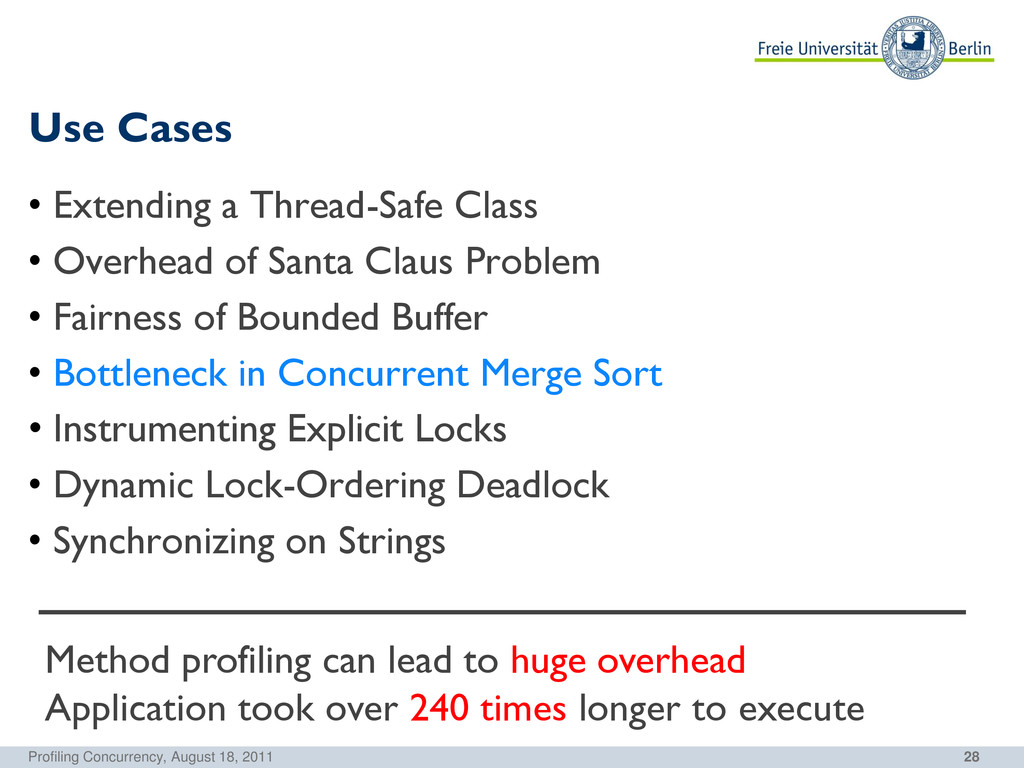
a Thread-Safe Class • Overhead of Santa Claus Problem • Fairness of Bounded Buffer • Bottleneck in Concurrent Merge Sort • Instrumenting Explicit Locks • Dynamic Lock-Ordering Deadlock • Synchronizing on Strings Method profiling can lead to huge overhead Application took over 240 times longer to execute
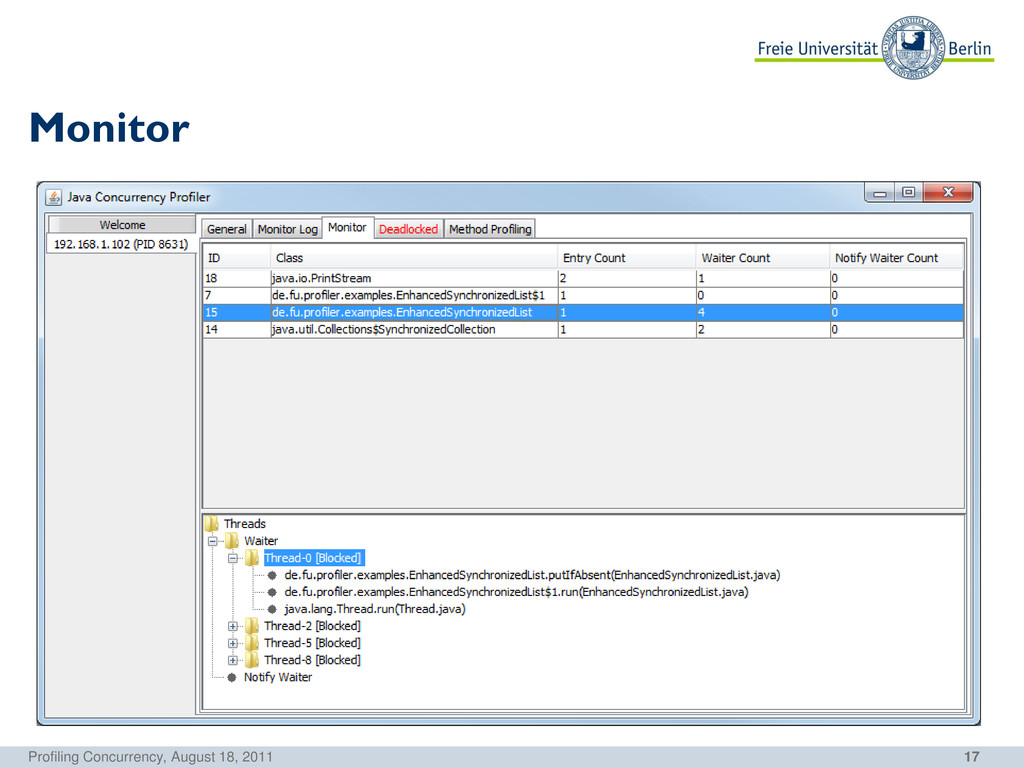
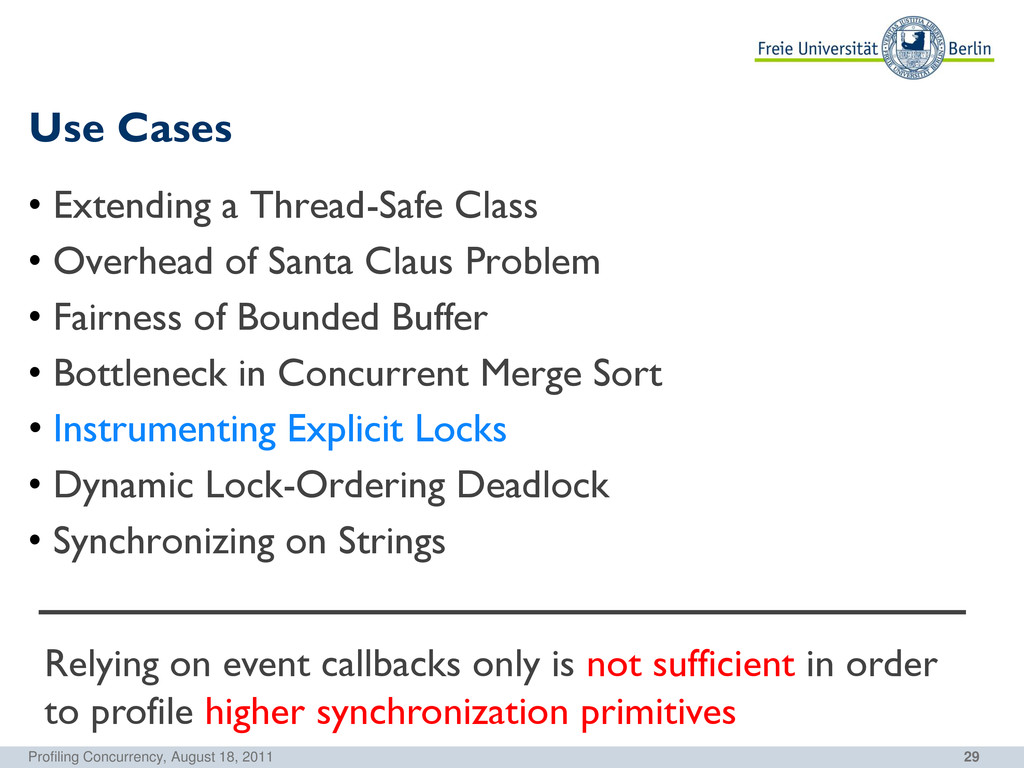
a Thread-Safe Class • Overhead of Santa Claus Problem • Fairness of Bounded Buffer • Bottleneck in Concurrent Merge Sort • Instrumenting Explicit Locks • Dynamic Lock-Ordering Deadlock • Synchronizing on Strings Relying on event callbacks only is not sufficient in order to profile higher synchronization primitives
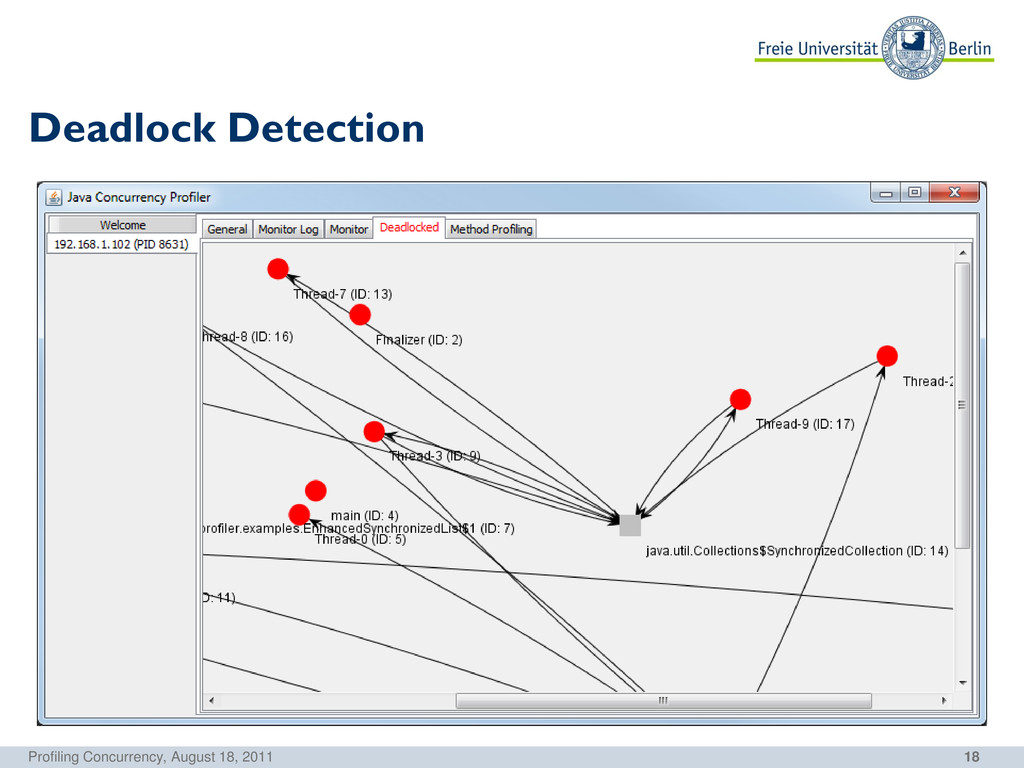
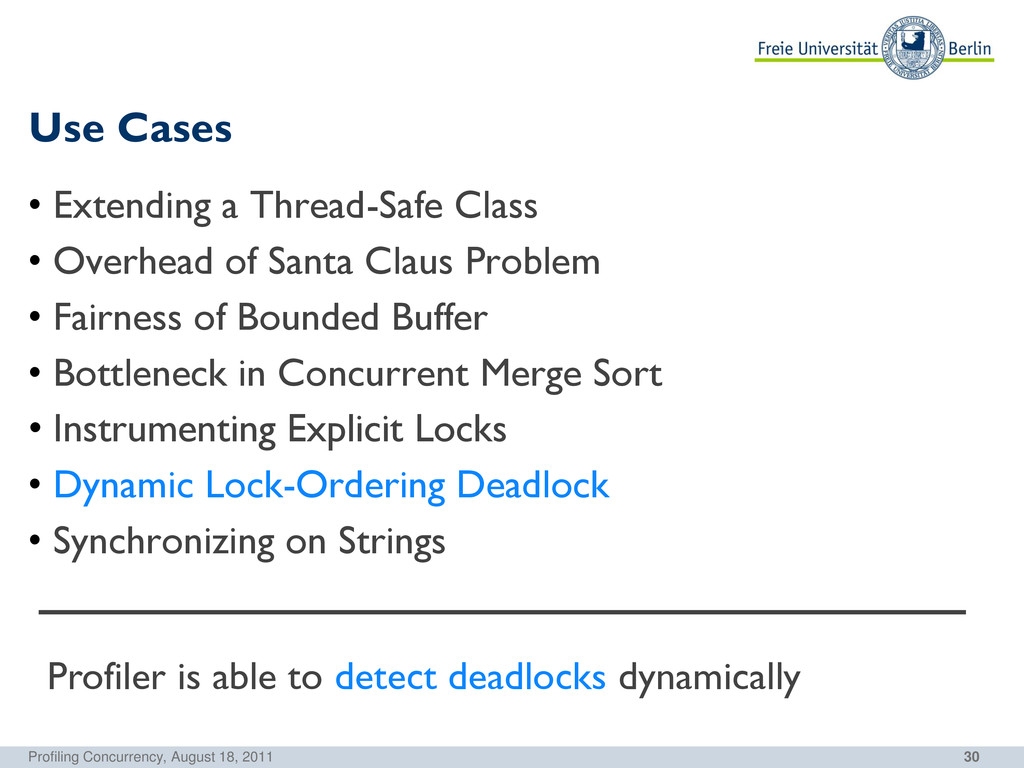
a Thread-Safe Class • Overhead of Santa Claus Problem • Fairness of Bounded Buffer • Bottleneck in Concurrent Merge Sort • Instrumenting Explicit Locks • Dynamic Lock-Ordering Deadlock • Synchronizing on Strings Profiler is able to detect deadlocks dynamically
a Thread-Safe Class • Overhead of Santa Claus Problem • Fairness of Bounded Buffer • Bottleneck in Concurrent Merge Sort • Instrumenting Explicit Locks • Dynamic Lock-Ordering Deadlock • Synchronizing on Strings Already little information helps to identify design flaws
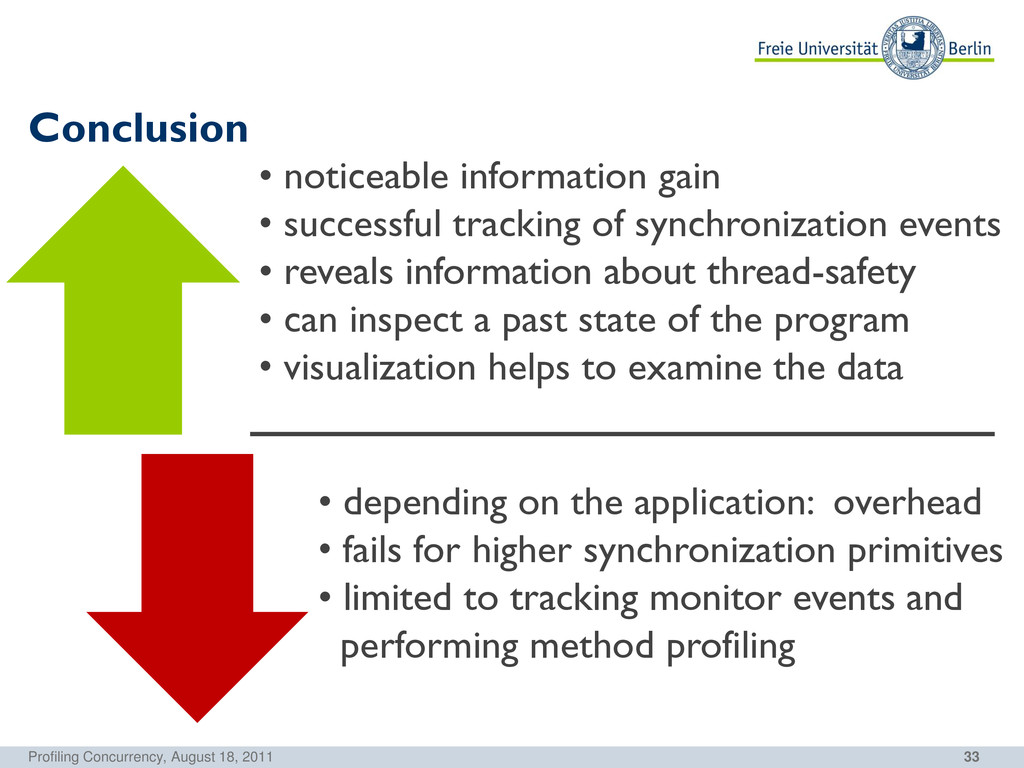
gain • successful tracking of synchronization events • reveals information about thread-safety • can inspect a past state of the program • visualization helps to examine the data • depending on the application: overhead • fails for higher synchronization primitives • limited to tracking monitor events and performing method profiling
a decoupled profiler • tracing events is easy when the type of event is supported • using event callbacks only is not sufficient and inefficient • overhead can be reduced through heavy use of filters and byte code instrumentation • extend profiler by using bytecode instrumentation • record scheduling decisions • reduce overhead • compare with alternative profiling methods Profiling Concurrency, August 18, 2011