Upgrade to Pro — share decks privately, control downloads, hide ads and more …

Genome-wide association identi!es candidate genes that infuence the human electroencephalogram

Kenn White
December 21, 2013

Genome-wide association identi!es candidate genes that infuence the human electroencephalogram

Hodgkinson CA, Enoch MA, Srivastava V, Sankararaman S, Yamani G, Yuan Q, Zhou Z, Albaugh B, White K, Shen PH, Goldman D. (2010) Genome-wide association analysis identifies candidate genes that influence the human electroencephalogram. Proceedings of the National Academy of Sciences, 107(19), 8695-8700.

Kenn White

December 21, 2013
Tweet

More Decks by Kenn White

Other Decks in Science

Transcript

  1. Genome-wide association identifies candidate genes that influence the human electroencephalogram

    Colin A. Hodgkinsona,1, Mary-Anne Enocha, Vibhuti Srivastavaa, Justine S. Cummins-Omana, Cherisse Ferriera, Polina Iarikovaa, Sriram Sankararamanb, Goli Yaminia, Qiaoping Yuana, Zhifeng Zhoua, Bernard Albaughc, Kenneth V. Whitea, Pei-Hong Shena, and David Goldmana aLaboratory of Neurogenetics, National Institute on Alcohol Abuse and Alcoholism, Rockville, MD 20852; bComputer Science Department, University of California, Berkeley, CA 94720; and cCenter for Human Behavior Studies, Weatherford, OK 73096 Edited* by Raymond L. White, University of California, Emeryville, CA, and approved March 31, 2010 (received for review July 23, 2009) Complex psychiatric disorders are resistant to whole-genome analysis due to genetic and etiological heterogeneity. Variation in resting electroencephalogram (EEG) is associated with common, complex psychiatric diseases including alcoholism, schizophrenia, and anxiety disorders, although not diagnostic for any of them. EEG traits for an individual are stable, variable between individuals, and moderately to highly heritable. Such intermediate phenotypes appear to be closer to underlying molecular processes than are clinical symptoms, and represent an alternative approach for the identification of genetic variation that underlies complex psychiat- ric disorders. We performed a whole-genome association study on alpha (α), beta (β), and theta (θ) EEG power in a Native American cohort of 322 individuals to take advantage of the genetic and en- vironmental homogeneity of this population isolate. We identified three genes (SGIP1, ST6GALNAC3, and UGDH) with nominal associ- ation to variability of θ or α power. SGIP1 was estimated to account for 8.8% of variance in θ power, and this association was replicated in US Caucasians, where it accounted for 3.5% of the variance. Bayesian analysis of prior probability of association based upon earlier linkage to chromosome 1 and enrichment for vesicle-related transport proteins indicates that the association of SGIP1 with θ power is genuine. We also found association of SGIP1 with alcohol- ism, an effect that may be mediated via the same brain mechanisms accessed by θ EEG, and which also provides validation of the use of EEG as an endophenotype for alcoholism. alcoholism | electroencephalogram | endophenotype | genetics | whole-genome association Genetic studies of behavior and psychiatric disorders are ham- pered by etiologic heterogeneity of these complex phenotypes. Addiction vulnerability arises from both internalizing (emotional) and externalizing (dyscontrol) behavioral dimensions (1), and both of these broad aspects of behavior are strongly influenced by early life trauma and other gene/environment interactions (2). Etiologic heterogeneity dilutes power to detect genetic effects, and is a reason for failures to detect and replicate genome-wide associations (GWAS) in complex disorders. Increasing sample size does not remove underlying heterogeneity and can introduce additional confounds. In neuropsychiatry, these considerations have led to the use of intermediate phenotypes (or endophenotypes) that are her- itable, relevant to disease, and have good measurement properties and assay variation more closely related to gene function (3) as surrogates to probe the underlying biology of complex disorders. Risk genes for schizophrenia have recently been identified using quantitative variables derived from functional magnetic resonance imagingincomparativelysmallcohorts(4).Therefore,animportant strategy to increase power for GWAS of psychiatric disorders might be the use of endophenotypes. The resting electroencephalogram (EEG) is a safely and in- expensively obtained phenotype relevant to normal behavioral variation and to psychiatric disease. The EEG recorded at the scalp is the sum of postsynaptic currents of synchronously depo- larized, radially oriented pyramidal cells in the cerebral cortex, and reflects rhythmic electrical activity of the brain. EEG patterns dynamically and quantitatively index cortical activation, cognitive function, and state of consciousness. EEG traits were among the original intermediate phenotypes in neuropsychiatry, having been first recorded in humans in 1924 by Hans Berger, who documented the α rhythm, seen maximally during states of relaxation with eyes closed, and supplanted by faster β waves during mental activity. EEG can be used clinically for the evaluation and differential di- agnosis of epilepsy and sleep disorders, differentiation of en- cephalopathy from catatonia, assessment of depth of anesthesia, prognosis in coma, and determination of brain death (5, 6). EEG also has moderate predictive value for personality variation and psychiatric disease including depression (7), bipolar disorder (8), attention-deficit/hyperactivity disorder (9), and obsessive-com- pulsive disorder (10). Increased β power is associated with both alcoholism and family history of alcoholism (11, 12), θ power is altered in alcoholics (13–15), and reduced α power has been as- sociated with a family history of alcoholism and with alcoholism with comorbid anxiety disorders (16, 17). However, the EEG is not clinically useful for diagnosis of any specific psychiatric disorder. The stability and heritability of the EEG make it suitable for genetic analysis. Under standardized conditions the resting EEG is a stable trait in healthy adults, with high test-retest correlations [e.g., 0.7 even at >10 months (18)]. The marked interindividual variability in the resting EEG spectral band power is largely genetically determined and heritability of EEG spectral power is uniformly high for all wave forms (19, 20). We have performed GWAS in a sample of Plains American Indians, in which α (8–13 Hz), β (13–30 Hz), and θ (3–8 Hz) EEG spectral power are moderately heritable with high test-retest cor- relations over 2 years (15). Notably, this sample represents a population isolate evidencing a small but, as it turned out, useful degree of European admixture, and is genetically distinct from other Native American populations. In this dataset, common fa- milial traits such as alcoholism and other psychiatric disorders do not themselves generate statistical signals approaching genome- wide significance. However, we were able to identify a set of genes and possible pathways that affect α and θ EEG wave forms that are relevant to some of these same complex behavioral traits. Two of the gene associations were replicated in a US Caucasian dataset. Results Genome-Wide Significant Loci for Resting EEG Power. Five separate genomic regions, three for θ power [Fig. 1A, all on chromosome Author contributions: C.A.H., M.-A.E., and D.G. designed research; C.A.H., M.-A.E., J.S.C.-O., C.F., P.I., Z.Z., B.A., and K.V.W. performed research; S.S. contributed new reagents/analytic tools; C.A.H., M.-A.E., V.S., J.S.C.-O., C.F., P.I., G.Y., Q.Y., Z.Z., P.-H.S., and D.G. analyzed data; and C.A.H., M.-A.E., V.S., and D.G. wrote the paper. The authors declare no conflict of interest. *This Direct Submission article had a prearranged editor. 1To whom correspondence should be addressed. E-mail: [email protected]. This article contains supporting information online at www.pnas.org/lookup/suppl/doi:10. 1073/pnas.0908134107/-/DCSupplemental. www.pnas.org/cgi/doi/10.1073/pnas.0908134107 PNAS | May 11, 2010 | vol. 107 | no. 19 | 8695–8700 GENETICS
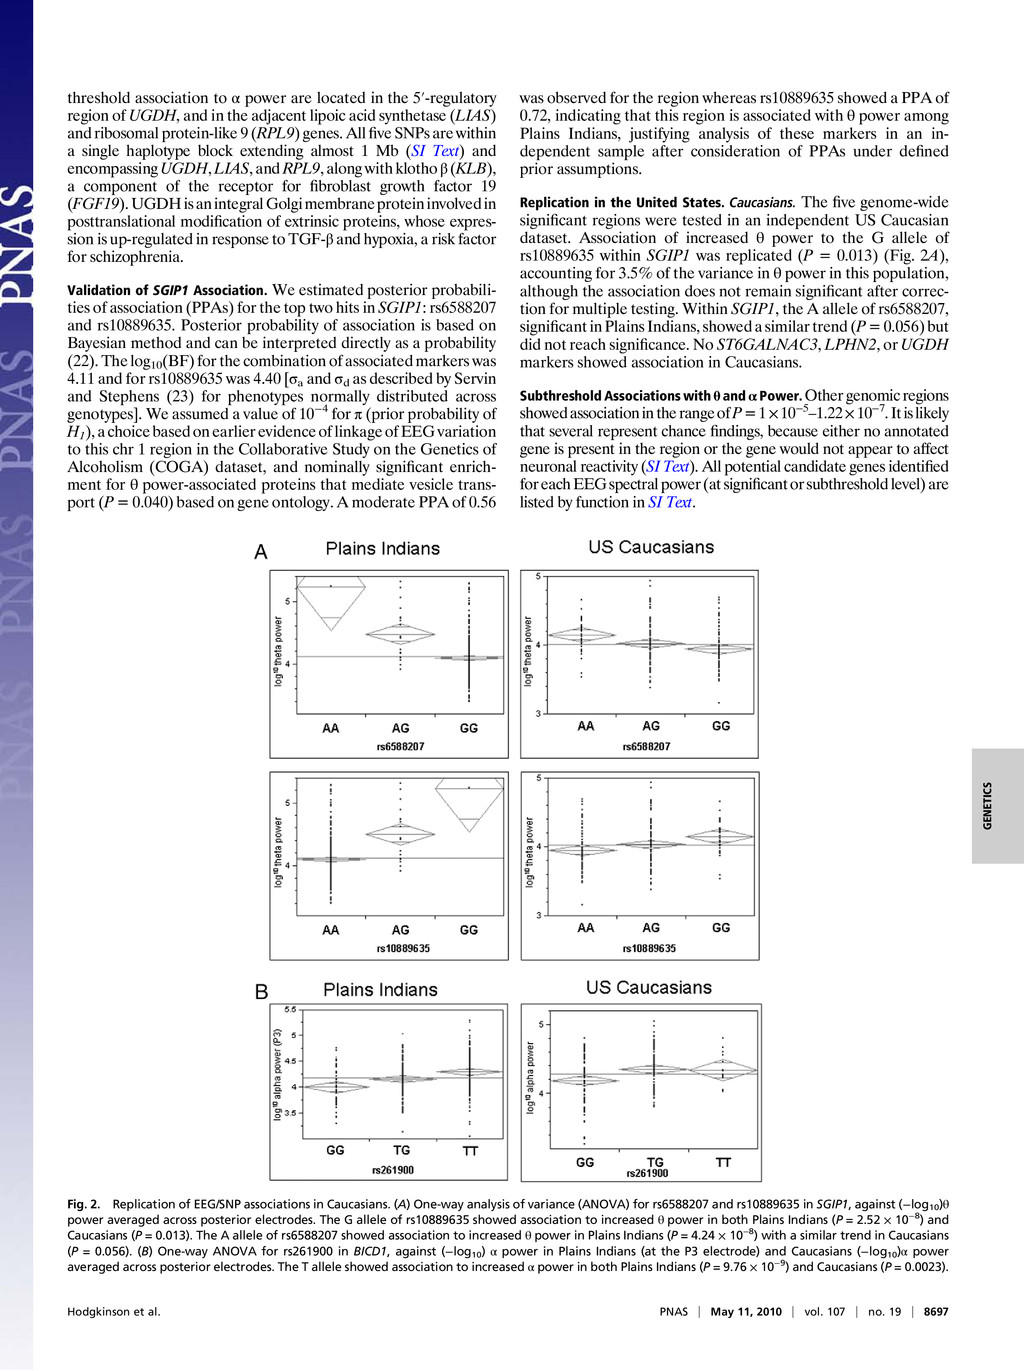
  2. (chr) 1] and two for α power (Fig.1B,chr 1 and

    4), showed genome- wide significant association (P < 1.23 × 10⁻⁷) to a single EEG trait (Table 1). No genome-wide significant associations were observed for β power (Fig. 1C) or for the complex psychiatric diagnosis of alcohol use disorder (SI Text), demonstrating that random ge- nome-wide significant signals are not generated for common fa- milial traits in a dataset of this size. Quantile-quantile plots show an excess of low P values for θ power but little or no excess for α power or β power (SI Text). Due to the population structure of the Plains Indians there exist close family relationships between study participants confirmed by λ values of 1.3 (α and θ) and 1.1 (β), and these could lead to spurious association. Empirically derived P values (Table 1) that correct for family structure for nominally significant single-nucleotide polymorphisms (SNPs) (P < 1 × 10⁻⁵) remained suggestive of association, although no marker remained significant after Bonferroni correction. Genomic Regions Associated with θ Power. The three genomic regions associated with θ power are all located at chr 1p31, each identifying a single candidate gene (Table 1). In Plains Indians, four significant (and two subthreshold) alleles are represented on two closely related low-frequency haplotypes (SI Text) that span almost the whole of the SH3-domain GRB2-like (endophilin) -interacting protein 1 gene (SGIP1), and an additional three sub- threshold markers lie within another haplotype block that extends 3′ from SGIP1 into the adjacent Tctex1-containing 1 gene (TCTEX1D1). The association with SGIP1 accounts for 8.8% of observed variation in θ power. Two missense polymorphisms in exon 7 of SGIP1, rs17490057 and rs7526812, can be excluded as the functional locus because of their distributions within haplotypes. Four haplotypes, including a common one (frequency = 0.24) carrying the increased θ power-associated alleles, are present in HapMap Caucasians (SI Text). A single marker significant for θ power was found in both ST6 (α-N-acetylneuraminyl-2,-3-β-ga- lactosyl-1,3)-N-acetylgalactosamine-α-2,6-sialyltransferase 3 (ST- 6GALNAC3: rs6696780) and latrophilin 2 (LPHN2: rs12145665). ST6GALNAC3 is an integral Golgi membrane protein which catalyzes the transfer of sialic acids to carbohydrate groups on glycoproteins and glycolipids. LPHN2 is a G-protein-coupled re- ceptor related to the receptor that binds black widow (Latrodectus) spider venom in synaptic membranes (21). Genomic Regions Associated with α Power. Two genomic regions show significant association to α power. Although the ST6GAL- NAC3 gene overlaps with our findings for θ power, the two α power-associated markers (rs410076 and rs172714) both lie within the third intron of ST6GALNAC3 and are in linkage disequilib- rium with each other, but not with the θ power-associated rs6696780 located more than 169 kb away. The signals for asso- ciation to α and θ power are therefore likely to be independent in this gene region. α power was also associated with UDP-glucose dehydrogenase gene (UGDH) through two markers, rs7667766 and rs6817264, that are located in introns 1 and 9, respectively. An additional three SNPs adjacent to this region that show sub- Fig. 1. Manhattan plots for resting EEG spectral power: θ (A), α (B), and β (C). The three plots show association (−log10 P value) (y axis) for individual SNPs (uncorrected for family structure) against chromosome position (x axis). Threshold P values of 1 × 10⁻⁷ (**) and 1 × 10⁻⁵ (*) are indicated by dotted lines. Table 1. Markers with significant association to EEG traits accompanied by subthreshold markers within significant regions EEG frequency band SNP Location Position Gene HWE P value Plains Indians minor allele frequency Plains Indians P value Plains Indians corrected P value* Caucasians P value Theta rs6588207 1p31.3 66839146 SGIP1 0.5972 0.03 4.24 × 10⁻⁸ 7.1 × 10⁻⁶ 0.056 Theta rs10889635 1p31.3 66848163 SGIP1 0.5526 0.03 2.52 × 10⁻⁸ 4.9 × 10⁻⁶ 0.013 Theta rs6656912 1p31.3 66856259 SGIP1 1 0.02 4.24 × 10⁻⁷ 1.61 × 10⁻⁵ ND Theta rs6681460 1p31.3 66895645 SGIP1 0.4659 0.03 7.30 × 10⁻⁸ 1.3 × 10⁻⁵ ND Theta rs10789215 1p31.3 66923773 SGIP1 1 0.03 8.51 × 10⁻⁸ 1.2 × 10⁻⁵ NS Theta rs2146904 1p31.3 66932924 SGIP1 1 0.03 4.37 × 10⁻⁷ 3.63 × 10⁻⁵ ND Theta rs536410 1p31.3 66963672 SGIP1 0.8271 0.04 1.69 × 10⁻⁷ 1.43 × 10⁻⁵ ND Theta rs2483704 1p31.3 66967941 SGIP1 1 0.04 3.63 × 10⁻⁷ 2.59 × 10⁻⁵ ND Theta rs2916 1p31.3 66989285 TCTEX1D1 0.6424 0.03 1.87 × 10⁻⁷ 1.92 × 10⁻⁵ ND Theta rs6696780 1p31.1 76504495 ST6GALNAC3 0.2083 0.02 8.47 × 10⁻⁸ 3.89 × 10⁻⁵ ND Alpha rs410076 1p31.1 76774219 ST6GALNAC3 0.6564 0.35 1.03 × 10⁻⁷ 1.1 × 10⁻⁶ NS Alpha rs172714 1p31.1 76787701 ST6GALNAC3 0.2563 0.35 7.34 × 10⁻⁸ 3.0 × 10⁻⁷ NS Theta rs1245665 1p31.1 81800834 LPHN2 1 0.02 3.00 × 10⁻⁹ 7.1 × 10⁻⁶ NS Alpha rs2608830 4p13 39135549 RPL9/LIAS 0.5768 0.11 1.29 × 10⁻⁶ 6.8 × 10⁻⁶ ND Alpha rs2259073 4p13 39135549 UGDH 0.4204 0.11 4.55 × 10⁻⁷ 2.5 × 10⁻⁶ ND Alpha rs2687964 4p13 39151469 UGDH 0.6905 0.10 4.54 × 10⁻⁶ 1.39 × 10⁻⁵ ND Alpha rs7667766 4p13 39172667 UGDH 0.6632 0.11 7.04 × 10⁻⁸ 8.0 × 10⁻⁷ NS Alpha rs6827264 4p13 39194505 UGDH 0.5355 0.11 4.23 × 10⁻⁸ 7.0 × 10⁻⁷ NS HWE, Hardy-Weinberg equilibrium; ND, not determined; NS, not significant. *Empirical P values correcting for participant relatedness. 8696 | www.pnas.org/cgi/doi/10.1073/pnas.0908134107 Hodgkinson et al.
  3. threshold association to α power are located in the 5′-regulatory

    region of UGDH, and in the adjacent lipoic acid synthetase (LIAS) and ribosomal protein-like 9 (RPL9) genes. All five SNPs are within a single haplotype block extending almost 1 Mb (SI Text) and encompassing UGDH, LIAS, and RPL9, along with klotho β (KLB), a component of the receptor for fibroblast growth factor 19 (FGF19).UGDHisanintegralGolgimembraneproteininvolvedin posttranslational modification of extrinsic proteins, whose expres- sion is up-regulated in response to TGF-β and hypoxia, a risk factor for schizophrenia. Validation of SGIP1 Association. We estimated posterior probabili- ties of association (PPAs) for the top two hits in SGIP1: rs6588207 and rs10889635. Posterior probability of association is based on Bayesian method and can be interpreted directly as a probability (22). The log10 (BF) for the combination of associated markers was 4.11 and for rs10889635 was 4.40 [σa and σd as described by Servin and Stephens (23) for phenotypes normally distributed across genotypes]. We assumed a value of 10−4 for π (prior probability of H1 ), achoice based on earlier evidence oflinkage of EEG variation to this chr 1 region in the Collaborative Study on the Genetics of Alcoholism (COGA) dataset, and nominally significant enrich- ment for θ power-associated proteins that mediate vesicle trans- port (P = 0.040) based on gene ontology. A moderate PPA of 0.56 was observed for the region whereas rs10889635 showed a PPA of 0.72, indicating that this region is associated with θ power among Plains Indians, justifying analysis of these markers in an in- dependent sample after consideration of PPAs under defined prior assumptions. Replication in the United States. Caucasians. The five genome-wide significant regions were tested in an independent US Caucasian dataset. Association of increased θ power to the G allele of rs10889635 within SGIP1 was replicated (P = 0.013) (Fig. 2A), accounting for 3.5% of the variance in θ power in this population, although the association does not remain significant after correc- tion for multiple testing. Within SGIP1, the A allele of rs6588207, significant in Plains Indians, showed a similar trend (P = 0.056) but did not reach significance. No ST6GALNAC3, LPHN2, or UGDH markers showed association in Caucasians. Subthreshold Associations with θ and α Power. Other genomic regions showedassociationintherangeofP=1×10⁻⁵–1.22×10⁻⁷.Itislikely that several represent chance findings, because either no annotated gene is present in the region or the gene would not appear to affect neuronal reactivity (SI Text). All potential candidate genes identified foreach EEGspectral power(at significant orsubthreshold level)are listed by function in SI Text. Fig. 2. Replication of EEG/SNP associations in Caucasians. (A) One-way analysis of variance (ANOVA) for rs6588207 and rs10889635 in SGIP1, against (−log10 )θ power averaged across posterior electrodes. The G allele of rs10889635 showed association to increased θ power in both Plains Indians (P = 2.52 × 10⁻⁸) and Caucasians (P = 0.013). The A allele of rs6588207 showed association to increased θ power in Plains Indians (P = 4.24 × 10⁻⁸) with a similar trend in Caucasians (P = 0.056). (B) One-way ANOVA for rs261900 in BICD1, against (−log10 ) α power in Plains Indians (at the P3 electrode) and Caucasians (−log10 )α power averaged across posterior electrodes. The T allele showed association to increased α power in both Plains Indians (P = 9.76 × 10⁻⁹) and Caucasians (P = 0.0023). Hodgkinson et al. PNAS | May 11, 2010 | vol. 107 | no. 19 | 8697 GENETICS
  4. Golgi Transport Candidates Among Subthreshold Signals. Analysis of thegeneontologyforall candidategenessuggestedthataproportion

    of the genes are involved in similar cellular processes (SI Text). Like SGIP1, four of these genes, BICD1, FAM125B, ANKRD27, and C11orf2, are either involved in retrograde Golgi transport or at least contain a domain similar to those found in vesicular transport pro- teins. Additionally, RTN1, RPH3AL, and CECR2 are involved in vesicle-mediated transport and neuroendocrine processes. BICD1 (bicaudal D homolog 1) is particularly interesting in that although there was only subthreshold association [rs261900: P = 4.32 × 10⁻⁷ (uncorrected)/4.5 × 10−6 (empirical)] to α power across posterior scalp electrodes, the T allele of rs261900 is also associated (P = 0.0023) with increased α power in Caucasians (Fig. 2B). β EEG Power. Several candidate genes associated to β power have functions that may affect neuronal electrical activity neurons. These include the α3 glycine receptor gene (GLRA3), a brain- expressed synaptic receptor that inhibits neuroexcitability, with four SNPs in a single haplotype block. rs12027066 is near ALD9A (aldehyde dehydrogenase, 9 family, member A1, an enzyme in- volved in GABA synthesis). Genetic variation in GABA receptors has been associated with disorders for which EEG has been pro- posed as an intermediate phenotype, including alcoholism (24) and schizophrenia (25). SGIP1 Association with θ Power Is Revealed by Admixture Mapping. The Plains Indian population was selected because of its charac- teristics as a population isolate with low admixture (European admixture; mean 5.23% and median 1.6%) and is genetically dis- tinct even from other Indian tribes (SI Text). However, despite the isolate character of Plains Indians, analysis of the θ power asso- ciation on chr 1 suggests that this signal was detected via admixture mapping, making it feasible to identify the introgressed European- derived chromosomal region and extended haplotypes harboring the putative functional locus. The minor allele frequency (MAF) in Plains Indians for the significant SNP rs10889635 is low (>0.03) compared with Caucasians (MAF = 0.41). When MAF is plotted against European ethnic factor score, a measure of European ancestry, the frequency of the minor G allele increases with in- creasing European admixture (SI Text), an effect seen also for θ power-associated markers in ST6GALNAC3 and LPHN2, and to a lesser extent in the more distant SEP15 gene. Localized admix- ture for the region surrounding SGIP1 on chr 1 was assessed forthe 17 Plains Indians carrying the G allele of rs10889635 and 9 Plains Indians with low European admixture (mean = 1.3%, median = 1.0%). In all carriers of the G allele, at least one copy of SGIP1 was European-derived (Fig. 3). The relatively small size of the com- puted blocks of admixture suggests that introduction of European DNA into this population is not recent (26). The association of SGIP1 to θ power is unlikely to be a stratification artifact because there is no correlation between degree of European ancestry and EEG power in any of the frequency bands (SI Text), and because the association at SGIP1 was replicated in Caucasians. Instead, this appears to be a serendipitous example of admixture mapping within a GWAS. The nonreplicating associations of LPHN2 and ST6GALNAC3 to θ power are likely to arise as a consequence of this admixture, and probably do not represent true associations. For α power, European ancestry does not predict the associated minor allele frequencies in ST6GALNAC3 and UGDH (SI Text), indicating these associations may be valid but population-specific. EEG as an Endophenotype for Alcoholism. To evaluate whether SGIP1 is a candidate gene for alcoholism, in addition to EEG variation we analyzed significant SGIP1 markers for association with alcohol use disorders (AUD) in the Plains Indian cohort (Table 2). Alleles significant (but subthreshold) for association with increased θ power were underrepresented in individuals with AUD. Reduced θ power in alcoholics had been reported for this dataset (15). The present data indicate a relationship between SGIP1 genotype and AUD. Significant SNPs at other loci did not show association to AUD except for SNPs at LPHN2 and ST6GALNAC3 that were linked to rs1088935 by their common European ancestry. Moreover, strength of these associations weakened with increasing distance from SGIP1. Discussion This GWAS in Plains American Indians identified two chro- mosomal regions, both previously implicated in linkage studies, containing multiple candidate genes for variability in resting EEG power. SGIP1 and ST6GALNAC3 lie within a linkage peak on chr 1p (95–115 cM), linked to β2 EEG spectral power (16–20 Hz) in the COGA (27, 28). UGDH, LIAS, RPL9, and KLB lie in a region of chr 4 previously linked to EEG in this Plains Indian dataset (15), together with an additional Native American pop- ulation (29) and in the COGA dataset (30). Additionally, the study has identified BICD1 located on chr 12p11 as a candidate gene for resting α power variability. Linkage studies have identified other chromosome regions po- tentially harboring genes involved in EEG variability. Low-voltage α power mapped to chr 20q (31). Convergence of linkage was found for α, β, and θ resting EEG power to chr 5q13-14 in this Plains Indian dataset, suggesting common loci that regulate EEG across the frequency spectrum (15).This finding was not replicated in this GWAS, most likely because of the relatively small effect of this locus on EEG power. In the present study, failure to replicate associations of ST6GALNAC3 and UGDH in Caucasians may reflect cross-population heterogeneity in loci influencing the EEG. With regard to this point, the haplotype block structure of the chr 4 region containing UGDH is more complex in Caucasians compared with Plains Indians, and it is possible that the associa- tion signal arises from variation in other genes in the region in- cluding KLB and LIAS. KLB is an interesting candidate because FGF-19 signaling affects cortical development (32) and voltage- gated Na+ channels, thereby altering neuronal reactivity (33). The EEG, although an intermediate phenotype, is itself a com- plex trait reflecting the rhythmic electrical activity of the brain, which is probably modulated by many loci. Discovery of a single locus accounting for 8.8% of variance in θ EEG is therefore for- tuitous. In US Caucasians this locus accounts for 3.5% of variance, the diminution due to the increased frequency of the informative alleles and relative haplotype frequencies. Fig. 3. Local admixture of chr 1 region (61.47–70.76 Mb) containing SGIP1 in 17 Plains Indians (E) carrying the θ power-associated G allele of rs10889635 compared with 9 Plains Indians (L) with low European admixture. The analysis shows a common European chromosomal segment at SGIP1 in all Plains Indi- ans carrying the G allele of rs10889635, indicating that the association signal (P = 2.52 × 10⁻⁸) is in part due to admixture at the SGIP1 locus. The only Plains Indian homozygous for the G allele of rs10889635 is indicated (†). 8698 | www.pnas.org/cgi/doi/10.1073/pnas.0908134107 Hodgkinson et al.
  5. The data from the significant and subthreshold genes suggest that

    many of the genes involved in determining EEG variability are involved in intracellular transport processes rather than cell-sur- face receptor activity, although two subthreshold genes were in- volved in glycine ion channel and GABAergic function. SGIP1 is directly involved in vesicle formation at the plasma membrane through interactions with phospholipids and EPS15, an adaptor protein. Knockdown of SGIP1 expression reduces clathrin-medi- ated endocytosis (34). Alterations in the efficiency of endocytosis might change neuronal activity via receptor turnover or neuro- transmitter uptake. The rabphilin 3A-like (without C2 domains) gene (RPHAL) generated only a modest P value [6.2 × 10⁻⁶ (un- corrected)/1.2 × 10−5 (empirical)] but is involved in exocytosis and vesicle transport, and is on chr 17 located within a linkage peak identified for the maximum-drinks phenotype in the COGA study (35). Coincidentally, D17S1308, which gave the strongest linkage signal, maps adjacent to the vacuolar protein-sorting 53 homolog gene (VPS53), a gene involved in retrograde vesicle trafficking in the late Golgi. BICD1 is also involved in vesicle trafficking and is essential for retrograde Golgi-to-endoplasmic reticulum transport via interaction with the adaptor protein Rab6a. Disruption of BICD1/Rab6a interaction uncouples vesicles from the dynein- dynactin transport machinery, resulting in the accumulation of vesicles at the cell periphery (36). BICD1 also appears to have an important function in nuclear positioning in neurons during de- velopment. The involvement of BICD1 with EEG variability is further suggested because BICD1 interacts directly with LIS1 (37), a protein that also interacts directly with DISC1 (38). Variation at DISC1 has been associated with alteration in the P300-evoked potential, another phenotype of neuronal reactivity (39). Two other subthreshold genes, cadherin 13 (CDH13) and fibro- blast growth factor 14 (FGF14), were identified in a GWAS for nicotine dependence (40) and more recently in a GWAS for alcohol dependence (41). FGF14 potentially alters neuronal reactivity through interaction with voltage-gated Na+ channels (33). Analysis of response to contextual imagery in cigarette smokers suggested that alteration of EEG activity may be a common feature associated with craving (42). The adaptor-related protein complex 2, α sub- unit2 gene (AP2A2), which encodes another protein involved in endocytosis, is located close to D11S1984, which generated the maximum linkage signal to alcohol dependence in a southwestern Native American population (29). Although it appears that our main findings are for genes that solely influence EEG power, con- vergences of findings at the subthreshold level to previous results in addictions suggest that by using an intermediate phenotype we po- tentially identified genes that have a general influence on addiction. ThePlainsIndiansareapopulationisolate,offeringadvantagesof reducedgeneticandenvironmentalheterogeneity.Asdescribed,this isarelativelynonadmixedtribe,withmedianEuropeanadmixtureof 1.5%. Although it is a family-based sample (SI Text), we were able to correct our analyses for the relatedness of the participants. In conclusion, this GWAS suggests that neuronal excitability in the brain is determined in part by the ability to recycle neu- ronal membrane components. Replication of association of SGIP1 to θ power validates the use of the GWAS approach on intermediate phenotype datasets of modest size. The success of this study in identifying novel genes and cellular processes in determining EEG traits demonstrates that if there are loci of moderate effect size, which is more likely for an intermediate phenotype in a population isolate, it may be unnecessary to have datasets numbering in the thousands, and that the analysis of accurately measured, heritable traits in relatively homogeneous populations is an informative alternative in the genetic analysis of complex psychiatric diseases and behavior. Methods Participant Recruitment. Plains American Indians. Participants were recruited from a tribe in rural Oklahoma (15) (fully described in SI Text). Written in- formed consent was obtained according to a human research protocol ap- proved by the Tribal Council and the human research committee of the National Institute on Alcohol Abuse and Alcoholism. EEG was obtained from 359 people. The alcohol use disorder (AUD) cohort comprised 225 cases and 156 controls. AUD was defined as DSM-III alcohol abuse (without dependence) (222 individuals) or DSM-III alcohol dependence (3 individuals). The replication dataset (described in SI Text) consisted of 185 European Americans (104 women and 81 men: 61 healthy controls and 124 individuals with a variety of DSM-III diagnoses) recruited in Bethesda, MD (43). Written informed consent was obtained via a human research protocol approved by the NIAAA institutional review board. EEG Acquisition and Analysis. Details of EEG methods and analysis are in Enoch et al. (15) and SI Text. Resting EEG was recorded using a fitted electrode cap in a field setting while the subject was seated with eyes closed and relaxed in a darkened noise-baffled room. To balance data quality against participant time, data were collected from six scalp electrodes (one frontal, two occip- ital, three parietal) selected to maximize information for α and θ power. Spectral power was determined for θ (3–8 Hz), α (8–13 Hz), and β (13–30 Hz), and log-transformed to normalize the distribution. For each frequency band, power was averaged for the five posterior electrodes to reduce variability due to individual electrode measurement and was justified by high corre- lations between α and θ power at the selected electrodes (15), coherence between these signals (44), and the higher θ and α activity in posterior and occipital regions (45). These data were used for association (see SI Text for means and ranges). No outliers were removed. Genotyping. Samples (399) were genotyped using the Illumina HapMap550K. Fourteen were discarded due to low genotype call rate (<97%), and four were discarded after gender and allele transmission testing. Genotypes were called using BeadStudio 3.2 (Illumina). Thirty-five replicate pairs showed average genotype reproducibility of 0.99994. Following quality control, association with log10 EEG power was performed on 322 individuals (137 male, 185 fe- male) for whom EEG was available. Replication genotyping was performed by 5′-exonuclease assay. Statistical Analysis. Association was tested using the standard linear regression model in PLINK (46). SNPs with MAF < 1% or a call rate < 90% were excluded, leaving 405,281 SNPs. Threshold for association was set at <1.23 × 10⁻⁷ using the Bonferroni method. Posthoc analyses using sex and age as covariates both in- dividually and together did not influence associations. P value inflation due to geneticrelatednesswasestimatedusingtheGCprogram(47).Tocorrectforfamily structure, QFAM family-based association tests for SNPs determined to be nomi- nally significant were performed within PLINK with 107 rounds of permutation, yielding empirical P values. Following GWAS, we estimated PPAs for the two top SGIP1markers,rs6588207andrs10889635.Bayesfactors(BF)werecalculatedusing Bayesian IMputation-Based Association Mapping (http://quartus.uchicago.edu/ ∼yguan/bimbam). PPAs werecalculated as described in Stephens andBalding(22). Enrichment in gene ontology terms was detected using GOTM (48). Local Admixture. Localized admixture on chr 1 was detected using Local Ancestry in adMixed Populations (LAMP) (49) v2.0 with an r2 cutoff of 0.95 to minimize exclusion of informative SNPs due to variable LD between Euro- Table 2. Comparison of minor allele frequency for seven SGIP1 SNPs between individuals with alcohol use disorder and controls shows significant underrepresentation of alleles associated with increased θ power rs6588207 rs10889635 rs66881460 rs10789215 rs2146904 rs536410 rs2483704 Alcohol use disorder 0.018 0.018 0.018 0.018 0.018 0.020 0.018 Controls 0.054 0.051 0.045 0.039 0.051 0.067 0.061 P value, 1 degree of freedom 0.005 0.009 0.028 0.076 0.009 0.001 0.002 χ2 7.843 6.78 4.824 3.139 6.87 10.903 10.024 Hodgkinson et al. PNAS | May 11, 2010 | vol. 107 | no. 19 | 8699 GENETICS
  6. peans and American Indians. Computational runs using generation time estimates

    of 3, 5, 7, and 9 yielded similar estimates of local admixture. A recombination rate of 1 × 10⁻⁸ and seed α values of 0.04 (Europeans) and 0.96 (American Indians) were used. Population Substructure and Admixture Determination. Ancestry informative markers (186) (50) were typed in the EEG samples and the HGDP-CEPH Human GenomeDiversityCellLinePanel(http://www.cephb.fr/HGDP-CEPH-Panel).PHASE Structure 2.2 (http://pritch.bsd.uchicago.edu/software.html) was run using ances- try informative marker data from the EEG and CEPH datasets simultaneously to identify population substructure and compute individual ethnic factor scores. ACKNOWLEDGMENTS. We thank the study participants for their contribu- tions, and Longina Akhtar and Elisa Moore for technical assistance. This study was funded by the intramural program of National Institute on Alcohol Abuse and Alcoholism. 1. Kendler KS, et al. (2008) The structure of genetic and environmental risk factors for DSM-IV personality disorders: A multivariate twin study. Arch Gen Psychiatry 65: 1438–1446. 2. Caspi A, et al. (2002) Role of genotype in the cycle of violence in maltreated children. Science 297:851–854. 3. Gottesman II, Gould TD (2003) The endophenotype concept in psychiatry: Etymology and strategic intentions. Am J Psychiatry 160:636–645. 4. Potkin SG, et al.; FBIRN (2009) A genome-wide association study of schizophrenia using brain activation as a quantitative phenotype. Schizophr Bull 35:96–108. 5. Niedermeyer E (1993) The normal EEG of the waking adult. Electroencephalography: Basic Principles, Clinical Applications, and Related Fields, ed Lopez de Silva F (Williams and Wilkins, Baltimore), pp 97–117. 6. Nunez PL, Srinivasan R (2005) Electric Fields of the Brain (Oxford Univ Press, New York), 2nd Ed, p 9. 7. Knott V, Mahoney C, Kennedy S, Evans K (2001) EEG power, frequency, asymmetry and coherence in male depression. Psychiatry Res 106:123–140. 8. Cook BL, Shukla S, Hoff AL (1986) EEG abnormalities in bipolar affective disorder. J Affect Disord 11:147–149. 9. Barry RJ, Clarke AR, Johnstone SJ (2003) A review of electrophysiology in attention- deficit/hyperactivity disorder: I. Qualitative and quantitative electroencephalography. Clin Neurophysiol 114:171–183. 10. Pogarell O, et al. (2006) Symptom-specific EEG power correlations in patients with obsessive-compulsive disorder. Int J Psychophysiol 62:87–92. 11. Rangaswamy M, et al. (2002) Beta power in the EEG of alcoholics. Biol Psychiatry 52: 831–842. 12. Pollock VE, Earleywine M, Gabrielli WF (1995) Personality and EEG beta in older adults with alcoholic relatives. Alcohol Clin Exp Res 19:37–43. 13. Rangaswamy M, et al. (2003) Theta power in the EEG of alcoholics. Alcohol Clin Exp Res 27:607–615. 14. Coutin-Churchman P, Moreno R, Añez Y, Vergara F (2006) Clinical correlates of quantitative EEG alterations in alcoholic patients. Clin Neurophysiol 117:740–751. 15. Enoch MA, et al. (2008) Common genetic origins for EEG, alcoholism and anxiety: The role of CRH-BP. PLoS One 3:e3620. 16. Finn PR, Justus A (1999) Reduced EEG alpha power in the male and female offspring of alcoholics. Alcohol Clin Exp Res 23:256–262. 17. Enoch MA, et al. (1999) Association of low-voltage alpha EEG with a subtype of alcohol use disorders. Alcohol Clin Exp Res 23:1312–1319. 18. Salinsky MC, Oken BS, Morehead L (1991) Test-retest reliability in EEG frequency analysis. Electroencephalogr Clin Neurophysiol 79:382–392. 19. Smit DJ, Posthuma D, Boomsma DI, Geus EJ (2005) Heritability of background EEG across the power spectrum. Psychophysiology 42:691–697. 20. van Beijsterveldt CE, Molenaar PC, de Geus EJ, Boomsma DI (1996) Heritability of human brain functioning as assessed by electroencephalography. Am J Hum Genet 58:562–573. 21. Lang J, Ushkaryov Y, Grasso A, Wollheim CB (1998) Ca2+-independent insulin exocytosis induced by α-latrotoxin requires latrophilin, a G protein-coupled receptor. EMBO J 17:648–657. 22. Stephens M, Balding DJ (2009) Bayesian statistical methods for genetic association studies. Nat Rev Genet 10:681–690. 23. Servin B, Stephens M (2007) Imputation-based analysis of association studies: Candidate regions and quantitative traits. PLoS Genet 3:e114. 24. Enoch MA (2008) The role of GABA(A) receptors in the development of alcoholism. Pharmacol Biochem Behav 90:95–104. 25. Lang UE, Puls I, Muller DJ, Strutz-Seebohm N, Gallinat J (2007) Molecular mechanisms of schizophrenia. Cell Physiol Biochem 20:687–702. 26. Stephens JC, Briscoe D, O’Brien SJ (1994) Mapping by admixture linkage disequilibrium in human populations: Limits and guidelines. Am J Hum Genet 55: 809–824. 27. Ghosh S, et al. (2003) Linkage mapping of beta 2 EEG waves via non-parametric regression. Am J Med Genet B Neuropsychiatr Genet 118B:66–71. 28. Porjesz B, et al. (2002) Linkage disequilibrium between the beta frequency of the human EEG and a GABAA receptor gene locus. Proc Natl Acad Sci USA 99:3729–3733. 29. Long JC, et al. (1998) Evidence for genetic linkage to alcohol dependence on chromosomes 4 and 11 from an autosome-wide scan in an American Indian population. Am J Med Genet 81:216–221. 30. Porjesz B, et al. (2002) Linkage and linkage disequilibrium mapping of ERP and EEG phenotypes. Biol Psychol 61:229–248. 31. Steinlein O, Anokhin A, Yping M, Schalt E, Vogel F (1992) Localization of a gene for the human low-voltage EEG on 20q and genetic heterogeneity. Genomics 12:69–73. 32. Borello U, et al. (2008) FGF15 promotes neurogenesis and opposes FGF8 function during neocortical development. Neural Dev 3:17. 33. Laezza F, et al. (2007) The FGF14(F145S) mutation disrupts the interaction of FGF14 with voltage-gated Na+ channels and impairs neuronal excitability. J Neurosci 27: 12033–12044. 34. Uezu A, et al. (2007) SGIP1α is an endocytic protein that directly interacts with phospholipids and Eps15. J Biol Chem 282:26481–26489. 35. Saccone NL, et al. (2000) A genome screen of maximum number of drinks as an alcoholism phenotype. Am J Med Genet 96:632–637. 36. Matanis T, et al. (2002) Bicaudal-D regulates COPI-independent Golgi-ER transport by recruiting the dynein-dynactin motor complex. Nat Cell Biol 4:986–992. 37. Claussen M, Suter B (2005) BicD-dependent localization processes: From Drosophilia development to human cell biology. Ann Anat 187:539–553. 38. Brandon NJ, et al. (2004) Disrupted in Schizophrenia 1 and Nudel form a neurodevelopmentally regulated protein complex: Implications for schizophrenia and other major neurological disorders. Mol Cell Neurosci 25:42–55. 39. Blackwood DH, Muir WJ (2004) Clinical phenotypes associated with DISC1, a candidate gene for schizophrenia. Neurotox Res 6:35–41. 40. Uhl GR, et al. (2007) Molecular genetics of nicotine dependence and abstinence: Whole genome association using 520,000 SNPs. BMC Genet 8:10. 41. Treutlein J, et al. (2009) Genome-wide association study of alcohol dependence. Arch Gen Psychiatry 66:773–784. 42. Knott V, et al. (2008) EEG correlates of imagery-induced cigarette craving in male and female smokers. Addict Behav 33:616–621. 43. Enoch MA, et al. (1999) Association of low-voltage alpha EEG with a subtype of alcohol use disorders. Alcohol Clin Exp Res 23:1312–1319. 44. Winterer G, et al. (2003) EEG phenotype in alcoholism: Increased coherence in the depressive subtype. Acta Psychiatr Scand 108:51–60. 45. Porjesz B, et al. (2005) The utility of neurophysiological markers in the study of alcoholism. Clin Neurophysiol 116:993–1018. 46. Purcell S, et al. (2007) PLINK: A tool set for whole-genome association and population-based linkage analyses. Am J Hum Genet 81:559–575. 47. Devlin B, Bacanu SA, Roeder K (2004) Genomic Control to the extreme. Nat Genet 36: 1129–1130, author reply 1131. 48. Zhang B, Schmoyer D, Kirov S, Snoddy J (2004) GOTree Machine (GOTM): A web- based platform for interpreting sets of interesting genes using gene ontology hierarchies. BMC Bioinformatics 5:16. 49. Sankararaman S, Sridhar S, Kimmel G, Halperin E (2008) Estimating local ancestry in admixed populations. Am J Hum Genet 82:290–303. 50. Hodgkinson CA, et al. (2008) Addictions biology: Haplotype-based analysis for 130 candidate genes on a single array. Alcohol 43:505–515. 8700 | www.pnas.org/cgi/doi/10.1073/pnas.0908134107 Hodgkinson et al.
  7. Supporting Information Appendix. Participant Recruitment Plains American Indians Participants were

    recruited from a Plains Indian tribe living in rural Oklahoma. The dataset is fully described in Enoch et al.1,2,3. Exclusion criteria included a history of severe head injury with loss of consciousness, epilepsy, seizures, stroke, brain tumors, neurological disease, current use of psychotropic medications, chronic drug use, positive breath test for alcohol and clinical alcohol withdrawal symptoms at time of testing. Blind- rated DSM-III-R lifetime psychiatric diagnoses were derived from the Schedule for Affective Disorders and Schizophrenia-Lifetime Version (SADS-L). A total of 225 individuals had a diagnosis of Alcohol Use Disorder (AUD) (101 women, mean (SD) age = 41.8 (12.1) yrs; 124 men, mean (SD) age = 41.0 (11.4) yrs). There were 156 non- alcoholics (112 women, mean (SD) age = 44.5 (16.3) yrs; 44 men, mean (SD) age = 39.6 (18.5) yrs. Forty five participants had anxiety disorders (26 women, 19 men). AUD was defined as DSM-III alcohol abuse (without dependence) or DSM-III alcohol dependence. Only 3 individual included in the AUD diagnostic group have alcohol abuse (without dependence). Almost all of the participants had lifetime exposure to alcohol. Within the 322 GWAS sample the number of relative pairs at different degrees of relationships for 303 participants were as follows: 1st degree; 286: 2nd degree; 820: 3rd degree: 38311: 4th degree: 3019. For 19 individuals there was no known relationship to any other participant. >97% of the relative pairs are that the 3rd degree, 4th degree, or unrelated degree of relationship. North American Caucasians This cohort comprised 185 volunteers (81 male, 104 female), all Caucasians living in the North East of the USA4,5. The mean (S.D.) ages of these participants were: women - 43.2 (15.8) yrs, and men - 40.8 (16.9) yrs. The group included 61 healthy controls (31 male, 30 female), and 124 with a variety of DSM-III diagnoses (often co-morbid) which included AUD, depression, specific phobia and anxiety disorders4,5.
  8. EEG acquisition and analysis Full details are provided in Enoch

    et al, 20081. EEG data were collected at an improved setting to allow access for the Native American study group. Participants were seated in a sound-dampened, darkened room. The resting EEG was recorded with the subjects’ eyes closed for 3 minutes. EEG signals were recorded using a fitted cap (Electro-Cap International Inc, Eaton, OH) with pure tin electrodes in a six channel montage: FZ (frontal-central), P3, PZ, P4 (parietal-central, left and right) and O1, O2 (occipital left and right) with reference to balanced sternovertebral electrodes. Data collection was performed in the field and therefore data were only gathered for six electrodes to reduce the time required for each subject whilst maintaining data quality. The electrodes were selected because α power is maximal posteriorly, and to obtain frontal θ & β EEG. Data quality was confirmed by comparison to repeat measurements made after two years. To monitor electro-oculographic artifacts electrodes were applied below and lateral to the left eye. An observer monitored the participant and EEG tracing for signs of drowsiness (alpha wave drop-out) or movement. The session was repeated if substantial drowsiness, sleep or movement was detected. FPZ was used as the ground electrode. EEG signals were continuously digitized at a sampling rate of 200 Hz. Quantitative spectral analysis was then performed6. Data records were partitioned into consecutive 512-point subunits (2.56 sec each) autoregressively filtered to remove low frequency subharmonics and Fast Fourier transformed to produce power spectrum estimates in 0.39 Hz steps for the three frequency domains: 3 – 8 Hz, 8 – 13 Hz and 13 – 30 Hz. The absolute spectral power in each of the three frequency bands at each of the six electrode locations was log10 transformed to normalize the distribution. The strong cross correlation of the spectral power obtained for the five posterior electrodes1,5 allowed us to average log10 spectral wave power for these five electrodes. This reduced the number of primary analyses performed and helps to reduce artifacts arising from random statistical variation.
  9. log10 θ log10 α log10 β Mean 4.119 4.113 3.269

    Standard Deviation 0.368 0.359 0.263 Range 3.378-5.300 3.234-5.216 2.613-4.22 Table 1: Summary of mean values and ranges for log10 α, β & θ spectral power in the Plains Indian Dataset used in the GWAS study.
  10. Supplementary Figures: Figure S1: (A) Manhattan plot for p values

    for association to alcohol use disorder in the Plains Indian dataset using the Illumina 550K array. Threshold p-values 1x10⁻⁵ (*) are indicated by dotted lines. P-values are not corrected for family structure. (B) Quantile- quantile plot of expected frequency of p-values plotted against the observed frequencies for association to Alcohol Use Disorder shows no enrichment of low p-values for this complex phenotype.
  11. Figure S2: Q-Q plot of expected frequency of observed p-values

    for association to log10 θ (A), log10 α (B) and log10 β (C) spectral power plotted against the expected frequencies.
  12. Figure S3: Diagram showing the LD structure (D’) and haplotypes

    for the SGIP1 region (66.797Kb-66.961Kb) of Chromosome 1 the Plains Indians (A) and HapMap Caucasians (B). D’>0.9 is shown as red shading in the LD plot. Markers showing genome-wide significance for association to increased log10θ spectral power (rs6588207, rs10889635, rs6681460, rs10789215 from left to right) are shown (*). The alleles associated with increased theta (red boxes) at genome-wide significance are present on only two low frequency haplotypes. The two mis-sense polymorphisms (rs17490057: E112Q and rs7526812: R131K) present in SGIP1 exon 7 are shown (blue boxes). The two haplotype carrying the alleles associated with increased theta found in Plains Indians are marked (†), and only differ at one marker (blue box – E112Q mis-sense polymorphism). Haplotype frequencies were estimated by Haploview 4.0 and are shown at the right of each haplotype. Yellow shading indicates the alleles not found in Plains Indians for other markers that distinguish two additional Caucasian haplotypes (including a common haplotype – freq=0.24) that carry the alleles associated with increased theta power.
  13. Figure S4: Diagram showing the LD structure (D’) of the

    Chromosome 4 region in the Plains Indians (39,108Kb-39,234Kb) containing the KLB, RPL9, LIAS and UGDH genes (shown above LD plot). D’>0.9 is indicated by red shading. Markers with genome-wide (*) and sub-threshold (*) significance are indicated. Alleles associated with increased alpha power are shown (red boxes). Haplotype frequencies are shown to the right of each haplotype.
  14. Figure S5: Genes identified with association at genome-wide significant or

    sub-threshold level for theta power arranged according to gene function or subcellular compartment. Gene function and/or location was determined based upon the NCBI Entrez Gene entry and PubMed entries for each gene.
  15. Figure S6: Genes identified with association at genome-wide significant or

    sub-threshold level for alpha power arranged according to gene function or subcellular compartment. Gene function and/or location was determined based upon the NCBI Entrez Gene entry and PubMed entries for each gene.
  16. Subsaharan Africa North Africa Europe Middle East Central Asia Far

    East Asia Oceania Americas Plains Indians Figure S7A: Eigenvectors plotted for 186 AIMs genotyped in the Plains Indians and the 51 world-wide populations of the CEPH diversity panel9, showing that the Plains Indians cluster with other groups from the Americas, and are distinct from European, African and Asian populations.
  17. Americas Plains Indians Figure S7B Eigenvectors plotted for 186 AIMs

    in Plains Indians and CEPH diversity panel populations from the Americas which show that although closely related to other populations within the Americas, including another North American Indian tribe (South West Indians) that the Plains Indians represent a distinct population.
  18. 0.00 5.00 10.00 15.00 20.00 25.00 30.00 <10% 10-20% 20%-30%

    >30% European Admixture Minor Allele Freq (%) rs10889635 rs6696780 rs12145665 rs6693416 Figure S8: Effect of Admixture on Association: Loci showing genome-wide significant association to increased theta power were clustered at chromosome 1p, and the distribution of the associated alleles for SGIP1, ST6GALNAC3 and LPHN2 to a few individuals suggested that the association signals are linked, and potentially arise due to admixture. Analysis of European ancestry with the theta power associated markers in SGIP1 (rs10889635), ST6GALNAC3 (rs6696780), LPHN2 (rs12145665) and SEP15 (rs6693416), covering a 20Mbase region shows that there is an apparent correlation between genotype at these loci and increasing European ancestry.
  19. Figure S9: Bivariate analysis of -log10θ(i), -log10 10 α (ii)

    and –log β (iii) power against European admixture component shows that there is no correlation between degree of admixture and EEG power for θ(r2=0.00152), α (r2 2 =0.0042) or β(r =0.00039).
  20. 0 5 10 15 20 25 30 35 40 45

    <10% 10-20% 20%-30% >30% European Ancestry (%) Minor Allele Freq (%) rs172714 rs6817264 Figure S10: Analysis of ST6GALNAC3 and UGDH markers (rs172714 and rs6817264 respectively) associated with increasing alpha power shows no similar relationship of increasing minor allele frequency with increasing European ancestry. These data suggest that the genome-wide significant association signals from these two loci do not arise as a result of admixture.
  21. References: 1. Enoch MA, Shen PH, Ducci F, Yuan Q,

    Liu J, White KV, Albaugh B, Hodgkinson CA, Goldman D. Common genetic origins for EEG, alcoholism and anxiety: the role of CRH-BP. PLoS ONE. 3 (10) :e3620 (2008). 2. Enoch MA, Schwartz L, Albaugh B, Virkkunen & Goldman D. Dimensional Anxiety Mediates Linkage of GABRA2 Haplotypes with Alcoholism. Am J Med Genet B Neuropsychiatr Genet. 141B (6):599-607 (2006). 3. Enoch MA, Waheed JF, Harris CR, Albaugh B, Goldman D. Sex Differences in the Influence of COMT Val158Met on Alcoholism and Smoking in Plains American Indians. Alcohol Clin Exp Res. 30 (3):399-406 (2006). 4. Enoch MA, White KV, Harris CR, Robin RW, Ross J, Rohrbaugh JW, et al. Association of low-voltage alpha EEG with a subtype of alcohol use disorders. Alcohol Clin Exp Res. 23, 1312- 1319 (1999). 5. Enoch MA, Rohrbaugh JW, Davis EZ, Harris CR, Ellingson RJ, Andreason P, Moore V, Varner JL, Brown GL, Eckardt MJ, et al. Relationship of genetically transmitted alpha EEG traits to anxiety disorders and alcoholism. Am J Med Genet. 1995 Oct 9;60(5):400-8. (1995). 6. Coppola R. Isolating low frequency activity EEG spectrum analysis. Eectroencephalogr Clin Neurophysiol. 46, 224-6 (1979). 7. Devlin, B., Bacanu, S., Roeder K. Genomic Control in the Extreme. Nat Genet 36, 1129-1130 (2004). 8. Price AL, Patterson NJ, Plenge RM, Weinblatt ME, Shadick NA, Reich D.Principal components analysis corrects for stratification in genome-wide association studies. Nat Genet. 38, 904-909 (2006). 9. Addictions biology: haplotype-based analysis for 130 candidate genes on a single array. Hodgkinson CA, Yuan Q, Xu K, Shen PH, Heinz E, Lobos EA, et al Alcohol Alcohol. 43(5):505-515 (2008).
  22. Table2: SNP markers from chromosome 1 included in haplotype analysis

    of Figure S3. Marker number corresponds to numbering in Figure S3A. Marker # SNP Chr1: Position Alleles 46 rs1988415 66797467 G:A 47 rs1338188 66802450 C:T 48 rs1975523 66809463 A:C 49 rs963140 66810164 T:G 50 rs1159851 66812831 G:T 51 rs10889633 66817218 G:T 52 rs1867631 66818714 A:C 53 rs1445573 66820030 G:A 54 rs10128053 66820545 A:G 55 rs11208917 66835973 C:A 56 rs12023176 66836119 C:T 57 rs6588207 66839143 G:A 58 rs10889635 66848163 A:G 59 rs6656912 66856259 C:T 60 rs6588212 66859469 A:G 61 rs6664698 66862006 G:A 62 rs4655643 66862687 C:A 63 rs6696812 66872897 C:T 64 rs17490057 66881865 G:C 65 rs7526812 66881923 G:A 66 rs6689755 66885638 A:G 67 rs1925341 66887672 G:A 68 rs1925342 66887818 A:C 69 rs9659684 66890492 A:G 70 rs6681460 66895645 G:A 71 rs1570814 66897531 C:T 72 rs12094526 66898702 G:A 73 rs6692318 66906914 T:C 74 rs1325264 66907823 T:G 76 rs6689451 66915440 G:A 77 rs11208944 66916150 G:A 78 rs11208946 66919227 T:C 79 rs10789215 66923773 C:T 80 rs1408852 66927916 C:A 82 rs2146905 66939481 C:A 83 rs3738167 66943854 G:T 84 rs9633417 66944000 C:A 85 rs609707 66949571 T:C 86 rs510771 66951234 C:A
  23. Table 3: Gene Hits for Theta Power (3-8Hz): Regions with

    no annotated gene have been excluded. Maximum p-values shown are uncorrected* and corrected† for family structure. Vesicle Transport Maximum p-value* Corrected p-value† 1p31.3 SGIP1 SH3-domain GRB2-like (endophilin) interacting protein 1 2.52x10⁻⁸ 4.9x10⁻⁶ 9q33.3 FAM125B family with sequence similarity 125, member B 9.04x10⁻⁶ 1.28x10⁻⁴ 11q13 C11orf2 chromosome 11 open reading frame2 9.17x10⁻⁶ 2.44x10⁻⁵ 17p13.3 RPH3AL rabphilin 3A-like (without C2 domains) 6.20x10⁻⁶ 1.2x10⁻⁵ 19q13.11 ANKRD27 ankyrin repeat domain 27 (VPS9 domain) 5.60x10⁻⁶ 3.15x10⁻⁵ Receptors 1p36.11 IL22RA1 interleukin 22 receptor, alpha 1 4.43x10⁻⁶ 4.47x10⁻⁵ 1p36.1-34.3 OPRD1 15Kb from OPRD1 8.05x10⁻⁶ 1.47x10⁻⁴ 1p32-p31 ROR1 receptor tyrosine kinasx1like orphan receptor 1 3.22x10⁻⁶ 2.49x10⁻⁴ 1p31.1 LPHN2 latrophilin 2 3.00x10⁻⁹ 2.8x10⁻⁶ 1q22-q23 RXRG retinoid X receptor, gamma 5.90x10⁻⁷ 1.41x10⁻⁵ 11p15.4 OR52B5P olfactory receptor, family 52, subfamily B, member 5 pseudogene 1.82x10⁻⁷ 3.41x10⁻⁵ 17p13.3 OR3A4 olfactory receptor, family 3, subfamily A, member 4 1.04x10⁻⁶ 1.01x10⁻⁵ Golgi/ER Component 1p31.1 ST6GALNAC3 ST6 (alpha-N-acetyl-neuraminyl-2,3-beta- galactosyl-1,3)-N-acetylgalactosaminide alpha-2,6-sialyltransferase 3 8.47x10⁻⁸ 3.89x10⁻⁵ 1p22.3 SEP15 15 kDa selenoprotein 1.39x10⁻⁷ 2.44x10⁻⁴ 11q13 TM7SF2 transmembrane 7 superfamily member 2 8.29x10⁻⁶ 2.9x10⁻⁵ 16q22 CHST6 carbohydrate (N-acetylglucosamine 6-O) sulfotransferase 6 1.20x10⁻⁶ 1.64x10⁻⁵ 22q.12.3 LARGE likx1glycosyltransferase 6.87x10⁻⁷ 3.12x10⁻⁵ Signal Transduction 2q22.2 ARHGAP15 Rho GTPase activating protein 15 4.58x10⁻⁶ 7.54x10⁻⁵ 6q23 SGK1 serum/glucocorticoid regulated kinase 1 5.53x10⁻⁶ 1.97x10⁻³ 13q34 FGF14 fibroblast growth factor 14 8.99x10⁻⁶ 3.85x10⁻⁵ Synaptic Function 6p24.1 PHACTR1 phosphatase and actin regulator 1 6.65x10⁻⁶ 6.52x10⁻⁵ 16q2 SNTB2 syntrophin, beta 2 (dystrophin-associated protein A1, 59kDa, basic component 2) 6.83x10⁻⁶ 2.85x10⁻⁴ Cell Cycle 11q12.1 CDCA5 cell division associated 5 9.27x10⁻⁶ 3.0x10⁻⁵ 18q21.1 ZBTB7C zinc finger and BTB domain containing 7C 2.05x10⁻⁶ 6.75x10⁻⁵ Growth Regulation 1p31.1 NEGR1 neuronal growth regulator 1 7.19x10⁻⁷ 2.6x10⁻⁶
  24. Ribosome Function 1p31.1 TYW3 tRNA-yW synthesizing protein 3 homolog (S.

    cerevisiae) 7.39x10⁻⁶ 2.4x10⁻³ 3p21.3 LARS2 leucyl-tRNA synthetase 2, mitochondrial 9.23x10⁻⁶ 6.91x10⁻⁵ 11q13 MRPL49 mitochondrial ribosomal protein L49 8.29x10⁻⁶ 2.9x10⁻⁵ 11q13 FAU Finkel-Biskis-Reilly murine sarcoma virus (FBR-MuSV) ubiquitously expressed 8.29x10⁻⁶ 2.9x10⁻⁵ Cell Adhesion/Signalling 16q24.2-q24.3 CDH13 cadherin 13, H-cadherin (heart) 8.37x10⁻⁷ 1.58x10⁻⁵ Transmembrane Transporters 11q13.1 SLC22A20 solute carrier family 22, member 20 8.54x10⁻⁶ 2.23x10⁻⁵ 12q24.31- q24.32 TMEM132B transmembrane protein 132B 6.17x10⁻⁶ 5.1x10⁻⁵ 17p13.2 SPNS3 spinster homolog 3 (Drosophila) 1.78x10⁻⁶ 1.8x10⁻⁶ DNA Binding/Modification 11q13.1 POLA2 polymerase (DNA directed), alpha 2 (70kD subunit) 8.54x10⁻⁶ 2.25x10⁻⁵ 11q23.3 MLL myeloid/lymphoid or mixed-lineage leukemia (trithorax homolog, Drosophila) 3.18x10⁻⁶ 1.18x10⁻⁴ 16q23.2 CDYL2 chromodomain protein, Y-like 2 5.50x10⁻⁶ 5.79x10⁻⁵ Misc 1q21-q25 KIRREL kin of IRRE like (Drosophila) 6.36x10⁻⁶ 8.57x10⁻⁵ 10q23 ANXA11 annexin A11 5.40x10⁻⁶ 2.52x10⁻⁵ 17pter-p13 ASPA aspartoacylase (Canavan disease) 8.71x10⁻⁷ 5.7x10⁻⁶ Unknown Function 1p31.3 TCTEX1D1 1D1 Tctex1 domain containing 1 1.87x10⁻⁷ 1.92x10⁻⁵ 2p25 Image clone 30348154 7.16x10⁻⁷ 2.67x10⁻⁵ 10q26.13 C10orf122 Chromosome 10 open reading frame 122 8.82x10⁻⁶ 1.69x10⁻⁴ 11q13 ZNHIT2 zinc finger, HIT type 2 8.29x10⁻⁶ 2.9x10⁻⁵ 11q23.3 C11orf60 chromosome 11 open reading frame 60 7.71x10⁻⁶ 2.49x10⁻⁴ 12q24.3 Hs637708 3.12x10⁻⁶ 1.14x10⁻⁴
  25. Table 4: Gene Hits for Alpha Power (8-13Hz): Regions with

    no annotated gene have been excluded. Maximum p-values shown are uncorrected* and corrected† for family structure. Vesicle Transport Maximum p-value* Corrected p-value† 4q31.3 LRBA LPS-responsive vesicle trafficking, beach and anchor containing 7.94x10⁻⁶ 3.79x10⁻⁵ 12p11.2-p11.1 BICD1 bicaudal D homolog 1 (Drosophila) 4.32x10⁻⁷ 2.6x10⁻⁶ 14q21.1 TTC6 tetrapeptide repeat domain 7.32x10⁻⁶ 4.58x10⁻⁵ 14q23.1 RTN1 reticulon 1 3.64x10⁻⁶ 1.1x10⁻⁵ 22q11.2 CECR2 cat eye syndrome chromosome region, candidate 2 2.48x10⁻⁶ 2.14x10⁻⁵ Golgi/ER Component 1p31.1 ST6GALNAC3 ST6 (alpha-N-acetyl-neuraminyl- 2,3-beta-galactosyl-1,3)-N- acetylgalactosaminide alpha-2,6- sialyltransferase 3 7.34x10⁻⁸ 3.0x10⁻⁷ 22q12.2 SELM selenoprotein M 2.90x10⁻⁶ 1.48x10⁻⁵ Cell Adhesion/Signalling 1q22-q23 IGSF9 immunoglobulin superfamily, member 9 9.23x10⁻⁶ 4.06x10⁻⁵ 11q25 OPCML opiod binding protein/cell adhesion molecule-like 6.34x10⁻⁶ 2.96x10⁻⁵ Transmembrane proteins/Transporters 1q24.1-q25.3 FAM5B Family with sequence similarity 5, member B (FAM5B) 6.67x10⁻⁶ 3.26x10⁻⁵ 1q31.2 ATP2B4 ATPase, Ca++ transporting, plasma membrane 4 3.17x10⁻⁶ 1.13x10⁻⁵ 1q41 SLC30A10 solute carrier family 30, member 10 6.83x10⁻⁶ 1.6x10⁻⁵ Signal Transduction 4q26 SYNPO2 synaptopodin 2 6.16x10⁻⁶ 2.29x10⁻⁵ Metaboolic Enzyme 4p13 LIAS lipoic acid synthetase 4.55x10⁻⁷ 2.5x10⁻⁶ 4p13 UGDH UDP-glucose dehydrogenase 4.23x10⁻⁸ 7.0x10⁻⁷ DNA Binding/Modification 12q24.31 MLXIP MLX interacting protein 5.98x10⁻⁶ 3.36x10⁻⁵ Ribosome Function 4p13 RPL9 ribosomal protein L9 1.29x10⁻⁶ 6.8x10⁻⁶ Misc 15q24-q25.1 PSTPIP1 proline-serine-threonine 6.14x10⁻⁶ 6.5x10⁻⁵
  26. phosphatase interacting protein 1 Unknown Function 1q32.3 Hs553186 8.65x10⁻⁶ 7.18x10⁻⁵

    1q41 LOC725510 4.88x10⁻⁷ 1.6x10⁻⁶ 20q13.32 ZNF831 zinc finger protein 831 4.74x10⁻⁶ 1.97x10⁻⁵
  27. Table 5: Gene Hits for Beta Power (13-30Hz): Regions: *TCOM1

    and ALDH9A1 are closely located on chromosome 1 and represent two candidates identified by the same set of four SNPs. Two regions on chromosome 6 and 8 had no identifiable transcript located close to the sub-threshold SNP(s). Maximum p-values shown are uncorrected* and corrected† for family structure. . Golgi/ER Component Maximum p-value* Corrected p-value† 1q24.1 TCMO1 transmembrane and coiled-coil domains 1 1.67x10⁻⁶ 1.33x10⁻⁵ Receptors 4q33-q34 GLRA3 glycine receptor, alpha 3 1.08x10⁻⁶ 1.8x10⁻⁶ Neurotransmitter Biosynthesis 1q24.1 ALDH9A1 aldehyde dehydrogenase 9 family, member A1 1.00x10⁻⁶ 9.4x10⁻⁶ Transmembrane proteins/Transporters 1q25 FAM5B Family with sequence similarity 5, member B (FAM5B) 3.83x10⁻⁶ 1.75x10⁻⁵ Integral Membrane Protein 3q26.1 C3orf57 ortholog of down regulated by androgen in mouse prostate 7.92x10⁻⁶ 1.07x10⁻⁵ 13q13.1 FRY1 furry homolog (Drosophila) 4.18x10⁻⁶ 2.4x10⁻⁵ Signal Transduction 17q23-q24 AXIN2 axin 2 9.17x10⁻⁶ 5.21x10⁻⁵