Upgrade to Pro — share decks privately, control downloads, hide ads and more …

Metrics and Monitoring

Metrics and Monitoring

Introduction to Metrics and Monitoring including steps - steps that can be implemented to achieve good monitoring.

Kuncara Adi Nugraha

January 09, 2016
Tweet

More Decks by Kuncara Adi Nugraha

Other Decks in Programming

Transcript

  1. Metrics indicators to find what is on track and what

    needs to be changed before it is too late
  2. Monitoring Core Principles 1. Identify important topics as many as

    possible 2. Identify all topics as early as possible 3. Generate alarms as few as possible 4. Do it with as little work as possible
  3. Tools • Alert Alarms that wakes us up if something

    happened • Graph Summarize all of trends. We are visual beings. • Logs Base source of truth and contains all of details
  4. Development Practices 1. Naive Implementation 2. Measure Implementation 3. Optimize

    (if needed) • Measure Everything • Logging is Cheap
  5. Insights • Potential thresholds • Consequences for failures • Filtered

    important resources to be monitored • Where to do improvement or optimization
  6. Where to set our eyes? Layer 0: Application Layer 1:

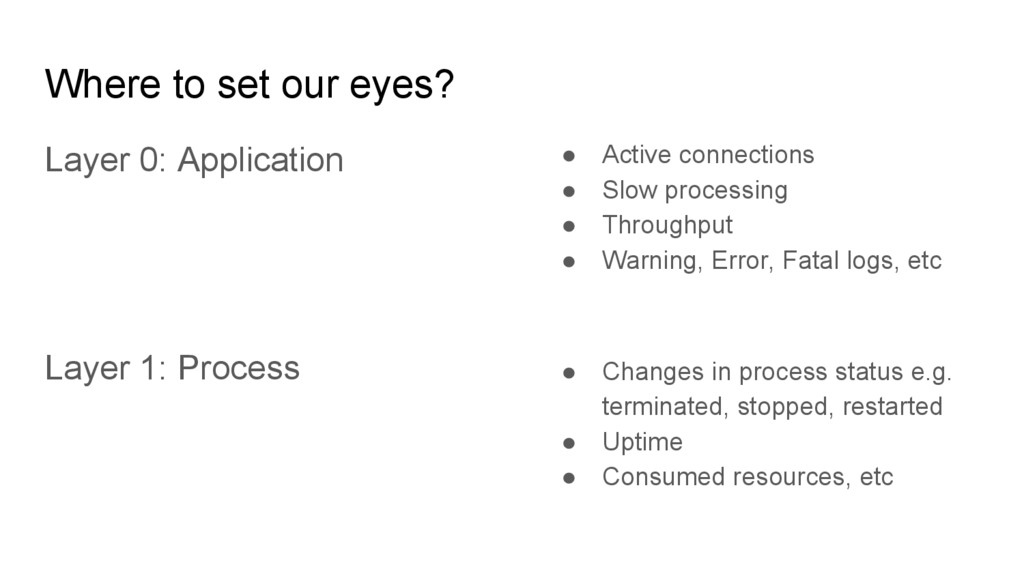
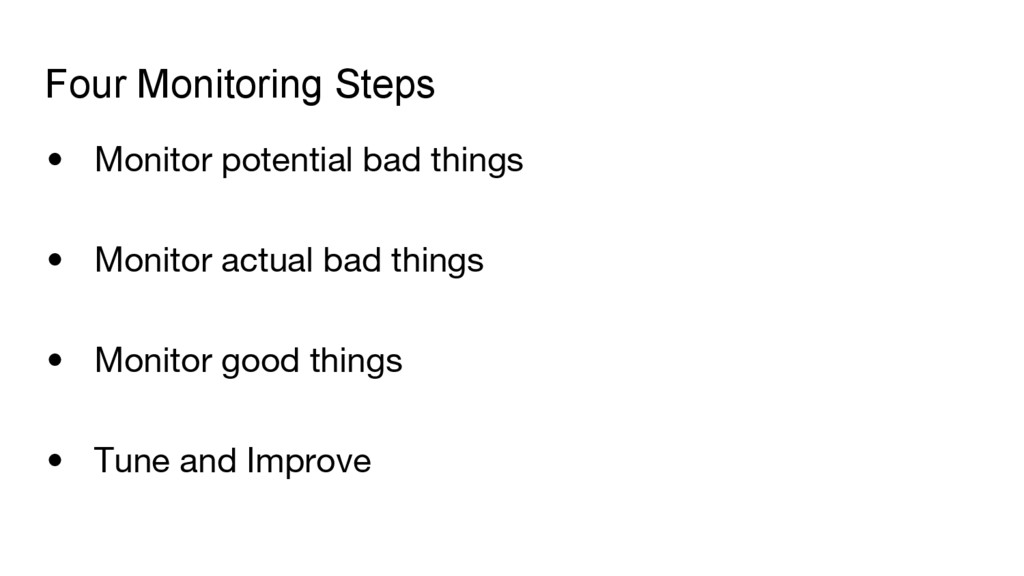
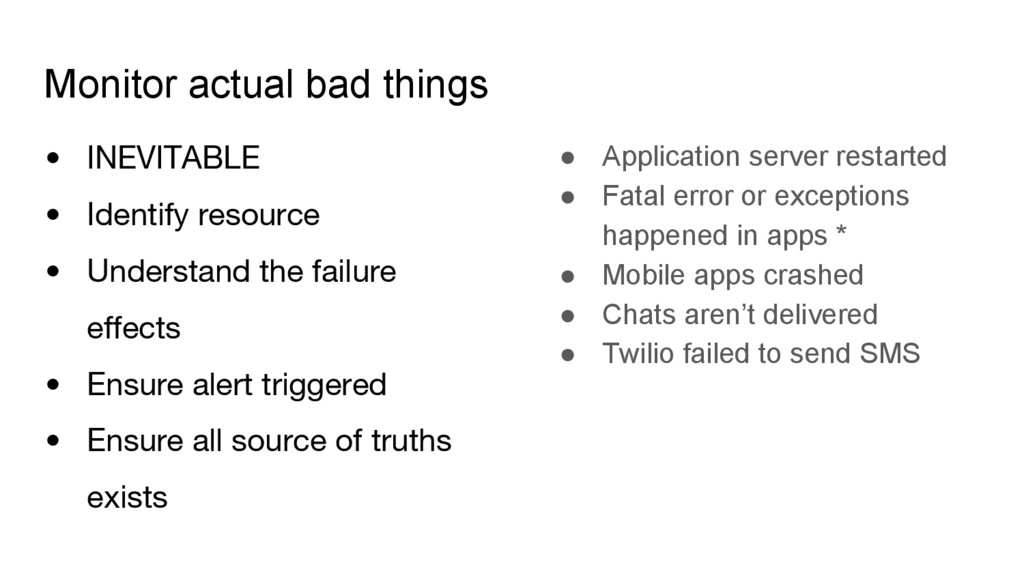
    Process • Active connections • Slow processing • Throughput • Warning, Error, Fatal logs, etc • Changes in process status e.g. terminated, stopped, restarted • Uptime • Consumed resources, etc
  7. Where to set our eyes? Layer 2: Server Layer 3:

    Hosting • Number of running processes • System resource ( CPU, network, IO, memory, etc) • Hardware health, etc • Latency • Availability • Maintenance schedules, etc
  8. Where to set our eyes? Layer 4: External Dependencies Layer

    5: USERS!! • API Changes • SSL-APNS certificates renewals • Policy changes, etc • Behaviours • Crashes • Device types • Social Media oauth logins • Successful responses * • Sessions, etc
  9. Four Monitoring Steps • Monitor potential bad things • Monitor

    actual bad things • Monitor good things • Tune and Improve
  10. Monitor potential bad things • Identify resource • Understand the

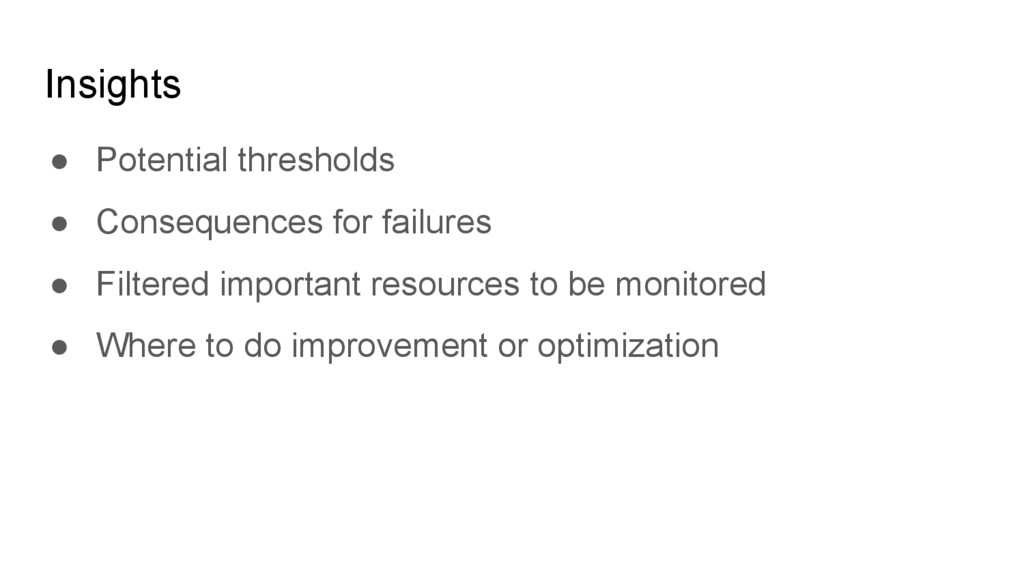
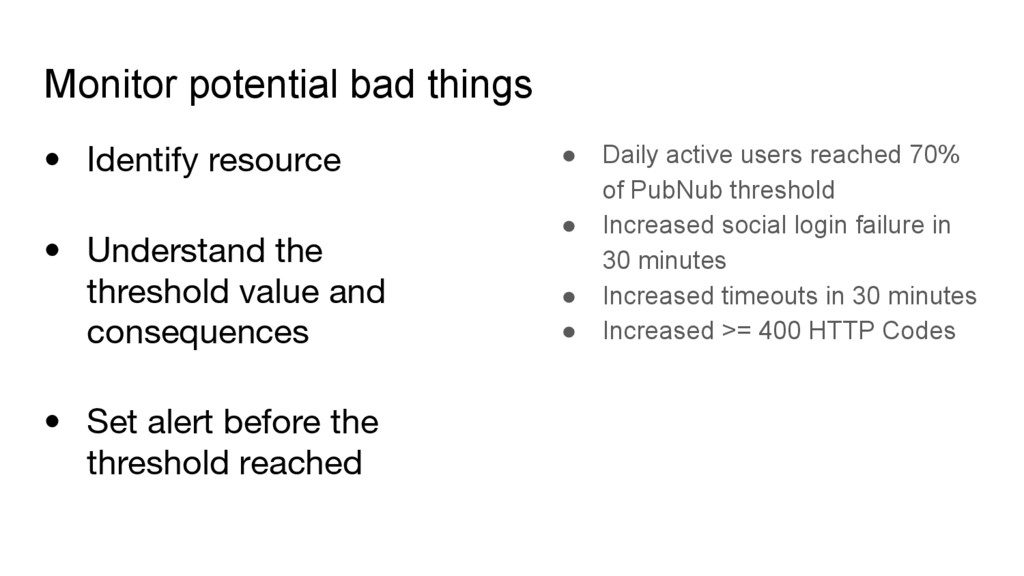
    threshold value and consequences • Set alert before the threshold reached • Daily active users reached 70% of PubNub threshold • Increased social login failure in 30 minutes • Increased timeouts in 30 minutes • Increased >= 400 HTTP Codes
  11. Monitor actual bad things • INEVITABLE • Identify resource •

    Understand the failure effects • Ensure alert triggered • Ensure all source of truths exists • Application server restarted • Fatal error or exceptions happened in apps * • Mobile apps crashed • Chats aren’t delivered • Twilio failed to send SMS
  12. Monitor Good Things ( before turns into disaster ) •

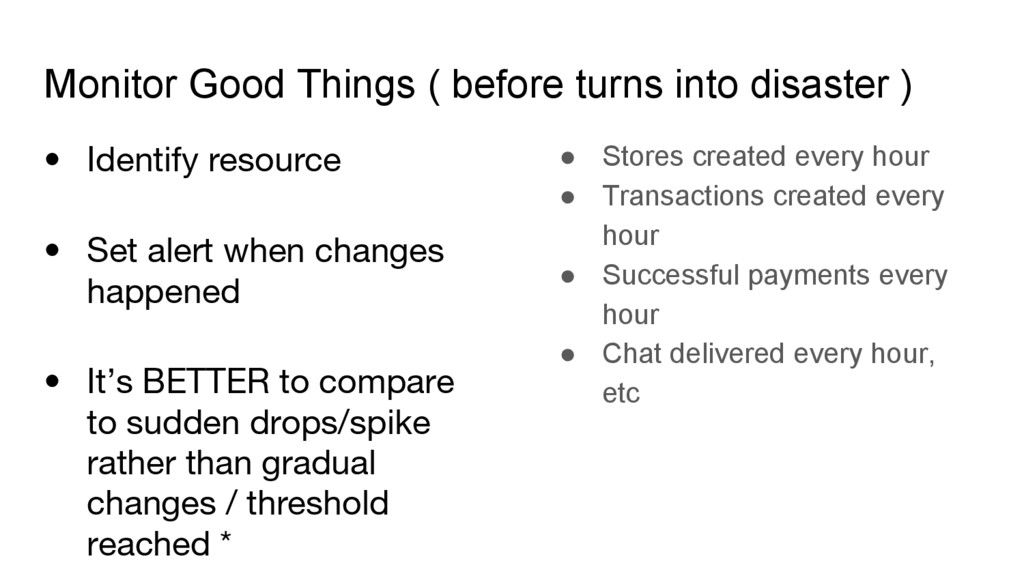
    Identify resource • Set alert when changes happened • It’s BETTER to compare to sudden drops/spike rather than gradual changes / threshold reached * • Stores created every hour • Transactions created every hour • Successful payments every hour • Chat delivered every hour, etc
  13. Tune and Improve • Add metrics as part of our

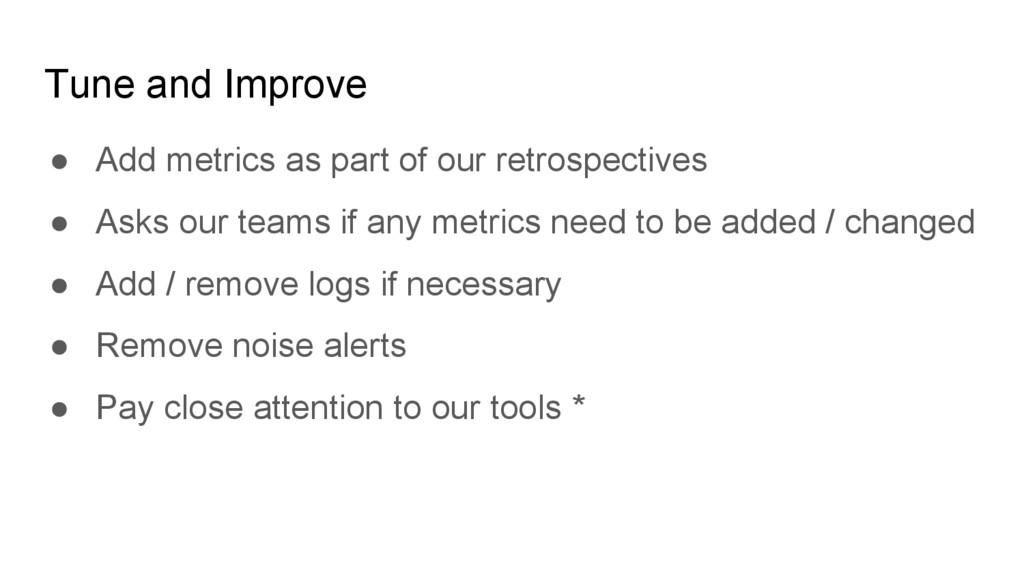
    retrospectives • Asks our teams if any metrics need to be added / changed • Add / remove logs if necessary • Remove noise alerts • Pay close attention to our tools *
  14. A metric will tell you that something is happening, while

    an analysis will tell you why something is happening. - Vince Law