Introduction to Deconvolution - Seminar at UCL ICH
An introduction to our work on deconvolution in at LIBD. Presented as a seminar to the Developmental Biology & Cancer group at the University College London Great Ormond Street Institute of Child Health on May 22, 2023.
in Baltimore, MD • Study the genetics of neuropsychiatric disorders 🧬 • 139 multidisciplinary scientists • Affiliated with the Johns Hopkins Medical School 2 Baltimore Maryland 🔸
2020 ◦ Working on Bulk RNA-seq, single cell RNA-seq, spatial transcriptomics • Masters in Bioinformatics from Temple University Philadelphia, PA ◦ Previously worked on evolutionary time trees • Other interest: ◦ running, rowing, baking 4 @lahuuki
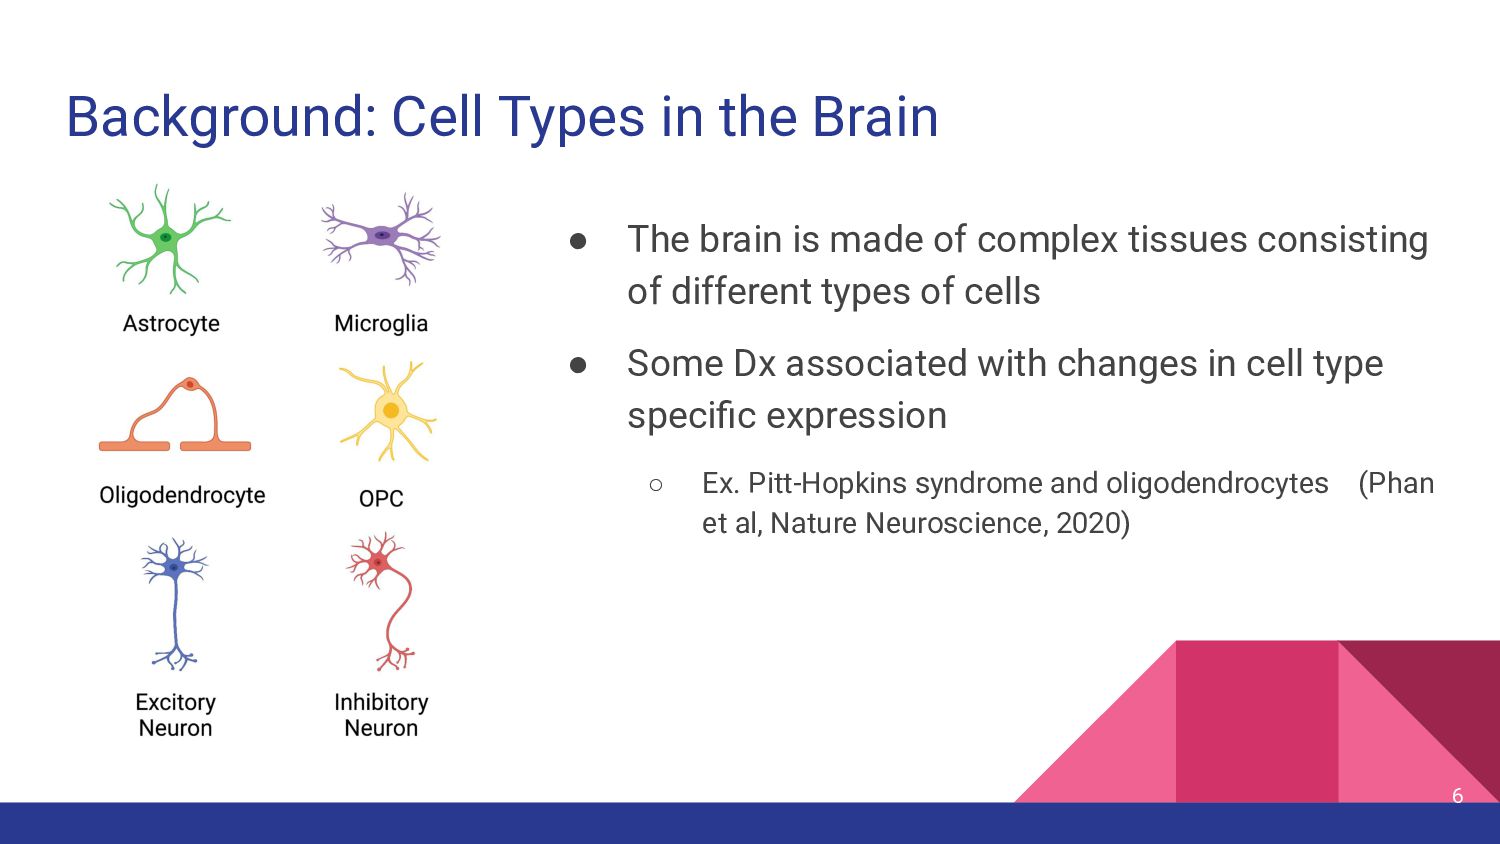
made of complex tissues consisting of different types of cells • Some Dx associated with changes in cell type specific expression ◦ Ex. Pitt-Hopkins syndrome and oligodendrocytes (Phan et al, Nature Neuroscience, 2020) 6
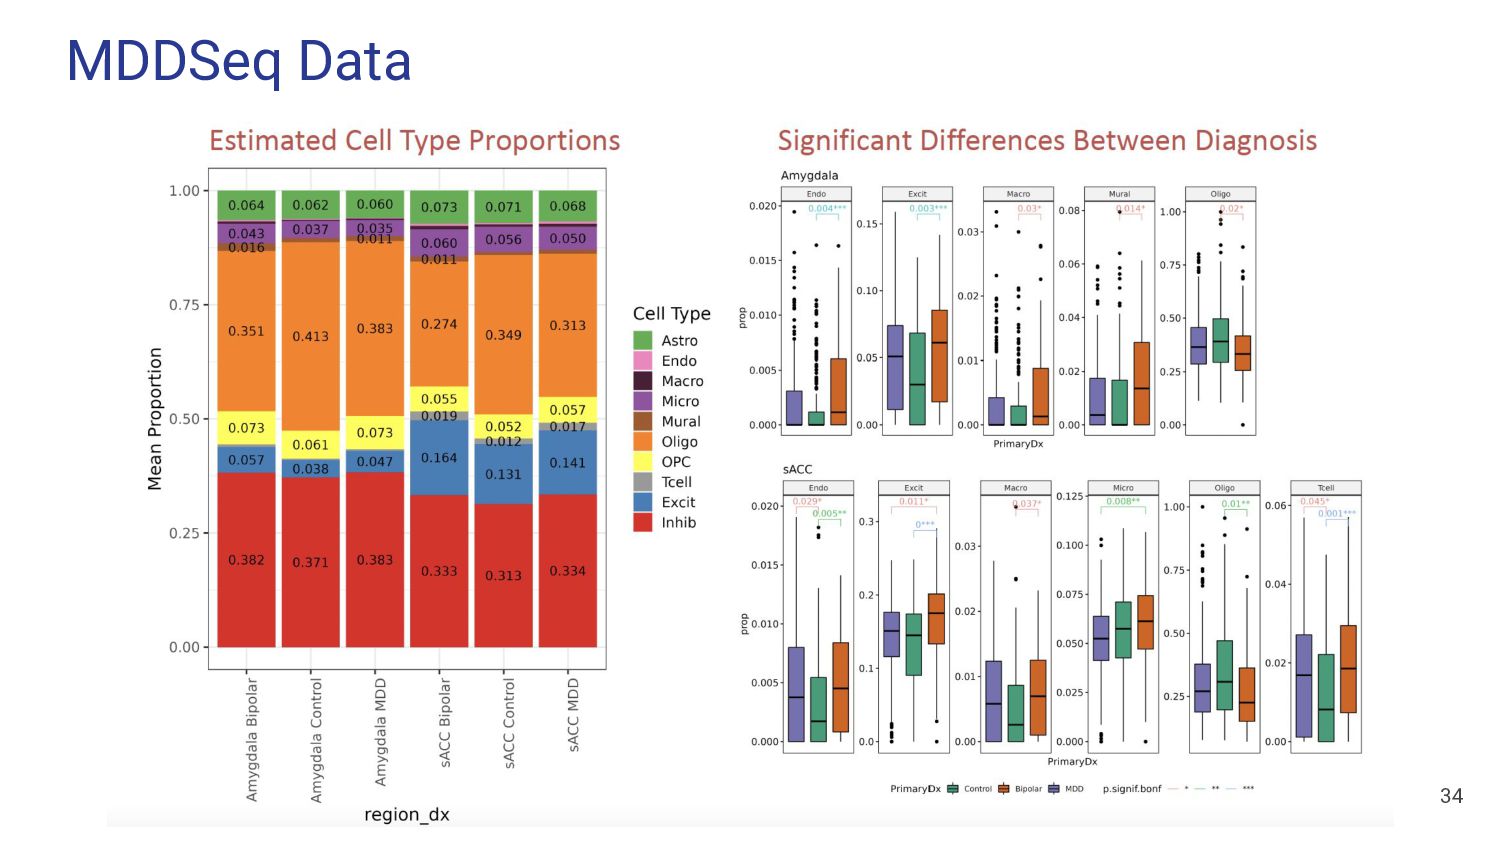
cell types express genes at different levels • Samples can differ in cell type composition due to biology or dissection ◦ Check for differences in case vs. control • Controlling for cell fractions between samples can make case vs. control analysis cleaner ◦ Quality control ◦ Confounding factor in differential expression analysis - prevents false-positives and false-negatives 9
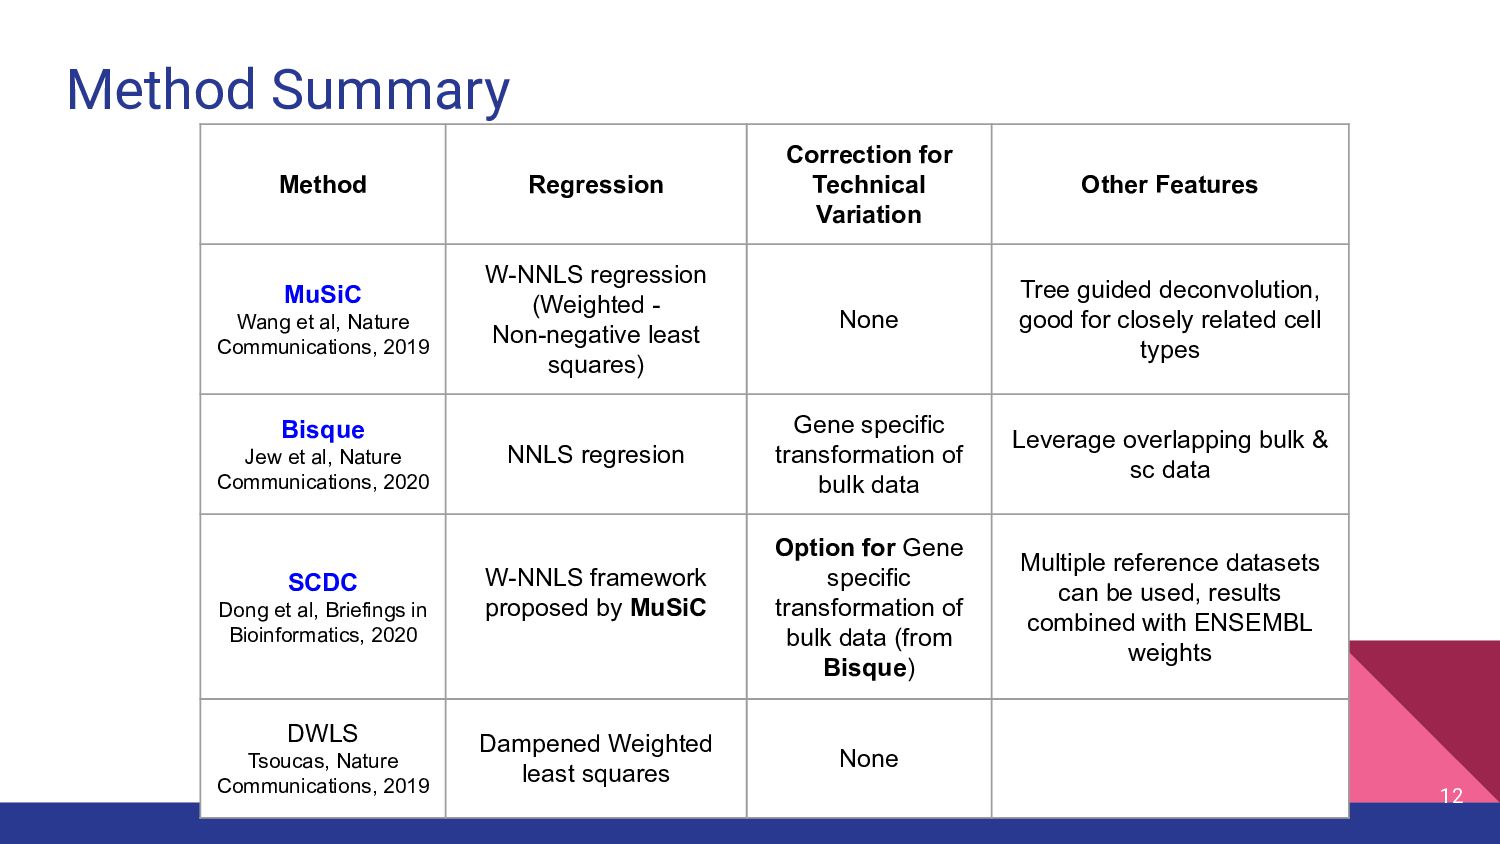
MuSiC Wang et al, Nature Communications, 2019 W-NNLS regression (Weighted - Non-negative least squares) None Tree guided deconvolution, good for closely related cell types Bisque Jew et al, Nature Communications, 2020 NNLS regresion Gene specific transformation of bulk data Leverage overlapping bulk & sc data SCDC Dong et al, Briefings in Bioinformatics, 2020 W-NNLS framework proposed by MuSiC Option for Gene specific transformation of bulk data (from Bisque) Multiple reference datasets can be used, results combined with ENSEMBL weights DWLS Tsoucas, Nature Communications, 2019 Dampened Weighted least squares None 12
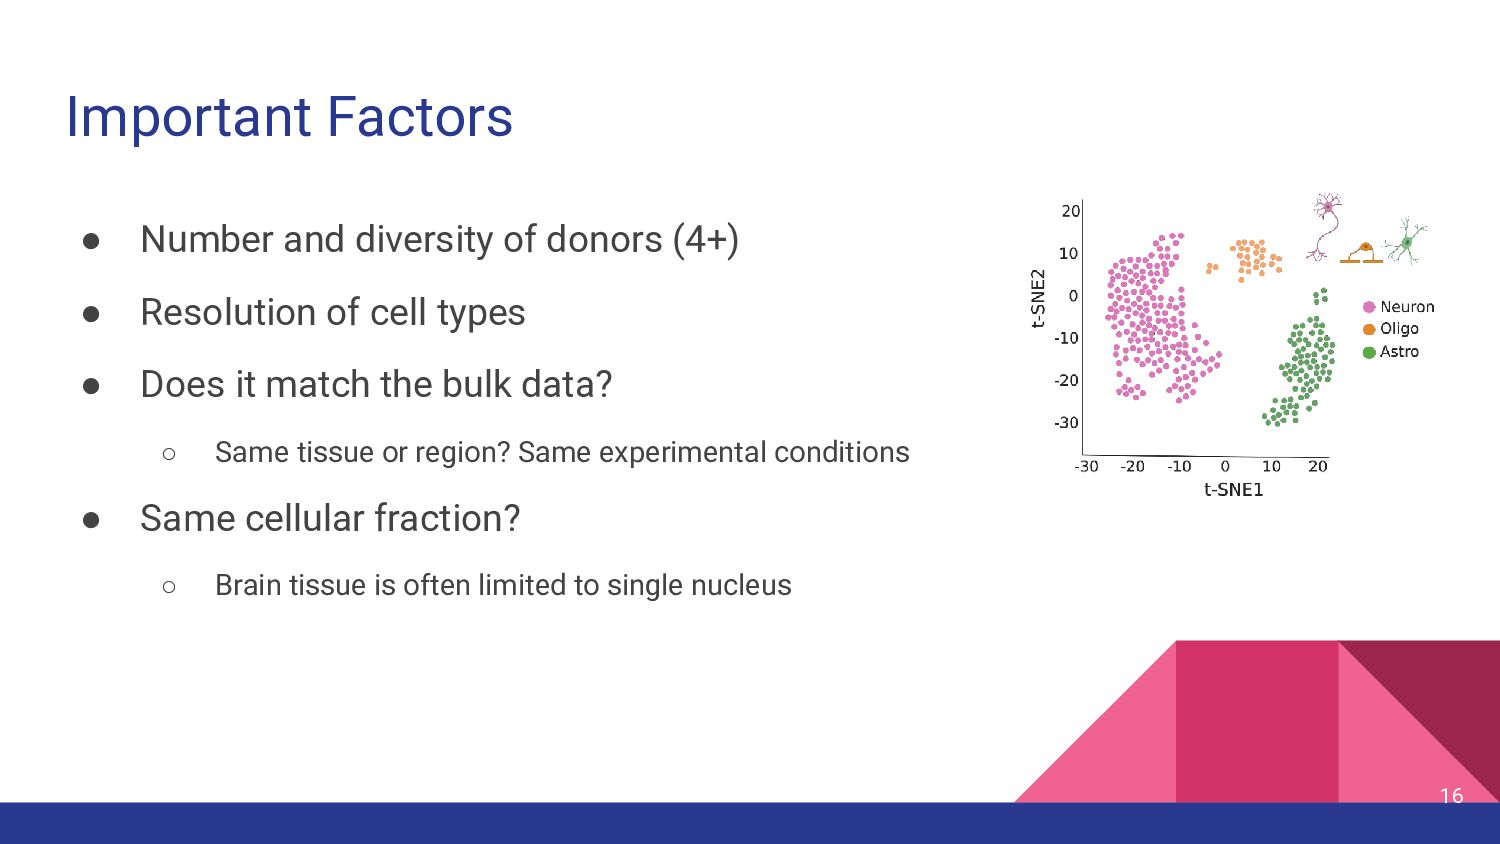
Resolution of cell types • Does it match the bulk data? ◦ Same tissue or region? Same experimental conditions • Same cellular fraction? ◦ Brain tissue is often limited to single nucleus 16
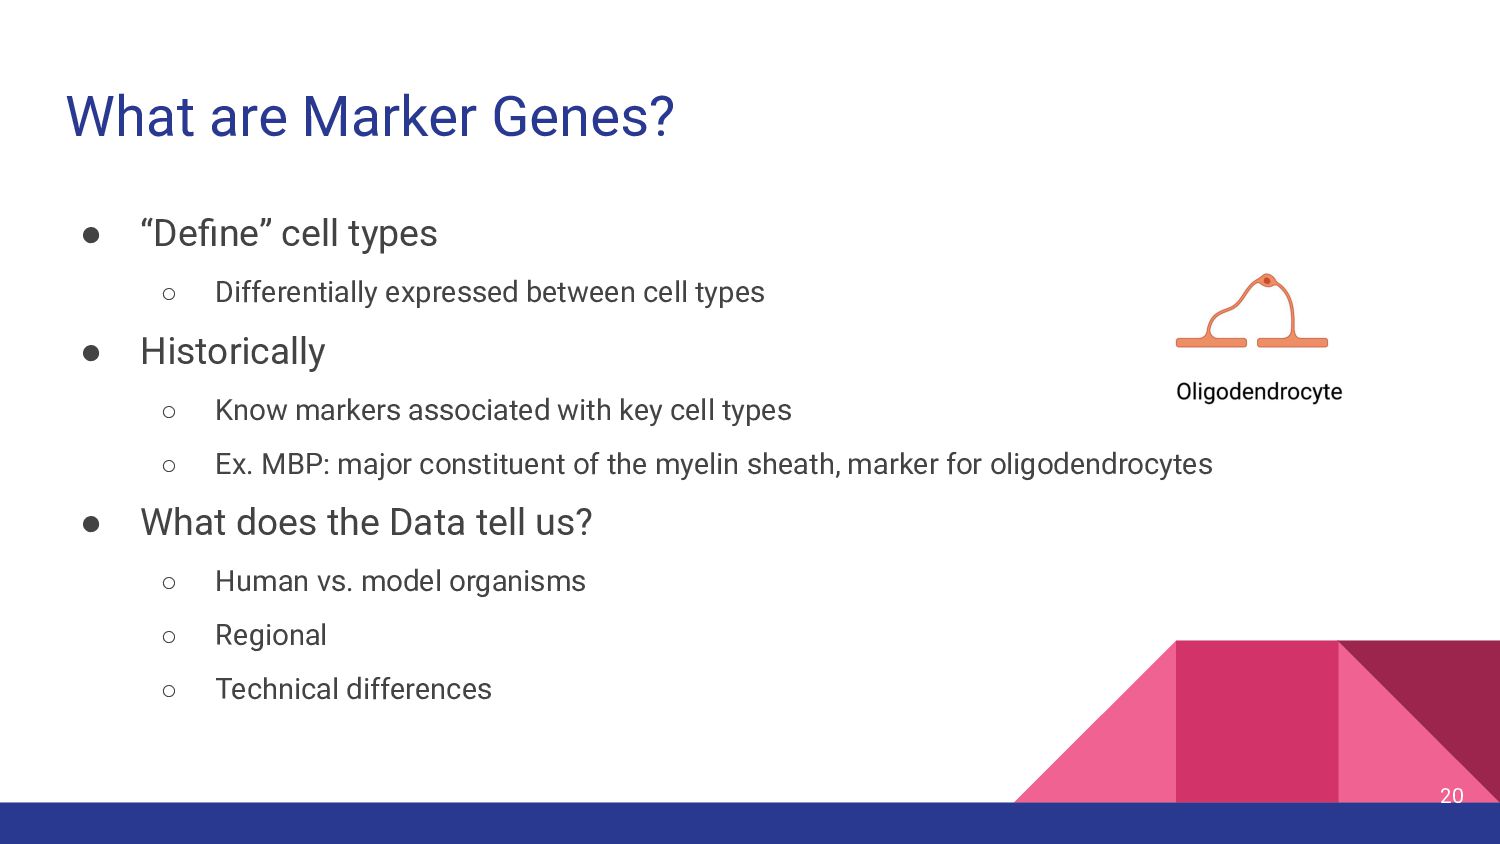
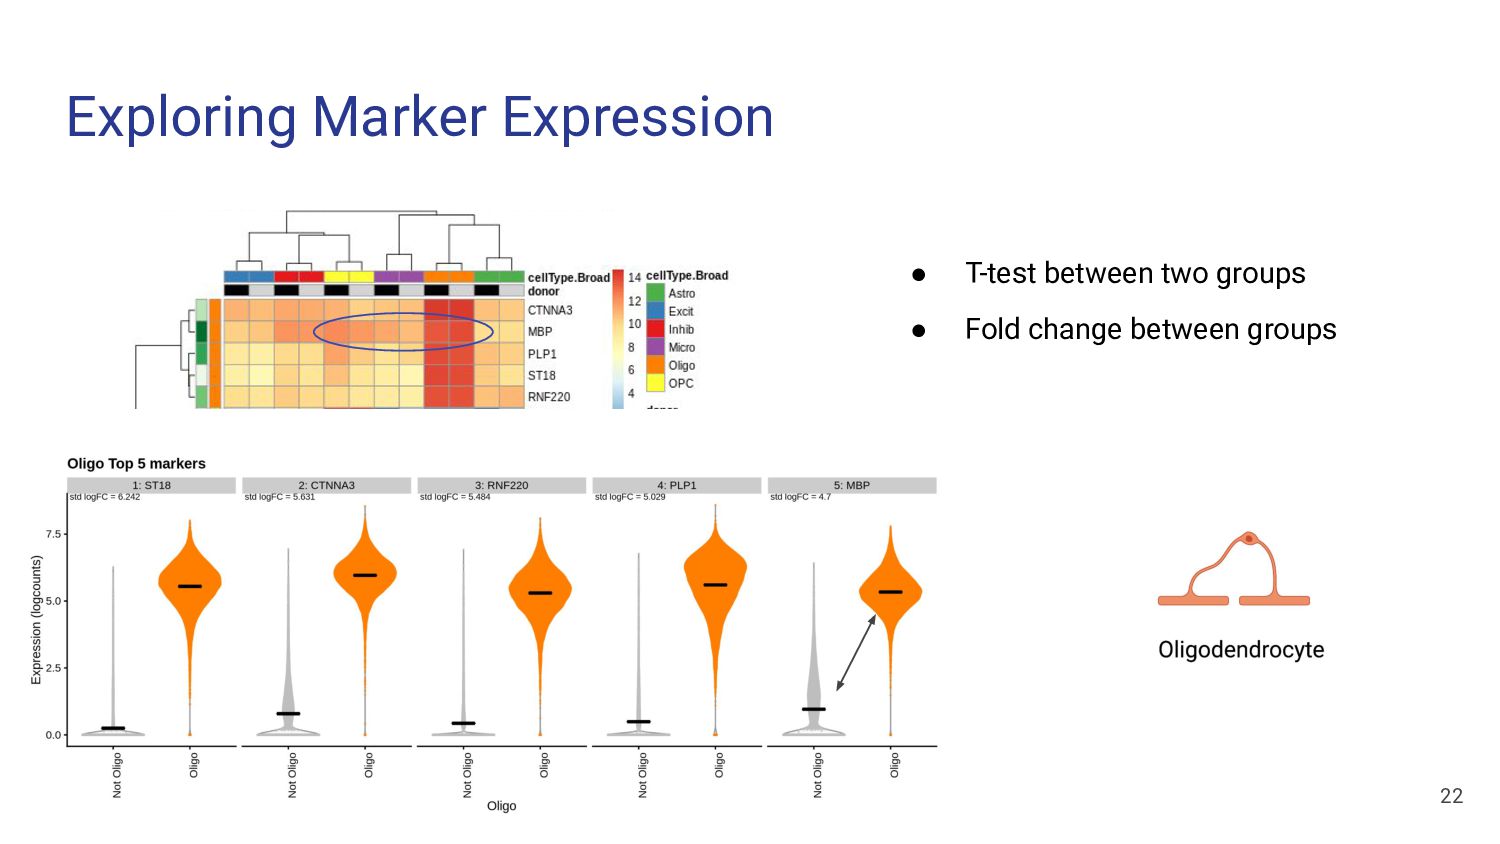
expressed between cell types • Historically ◦ Know markers associated with key cell types ◦ Ex. MBP: major constituent of the myelin sheath, marker for oligodendrocytes • What does the Data tell us? ◦ Human vs. model organisms ◦ Regional ◦ Technical differences 20
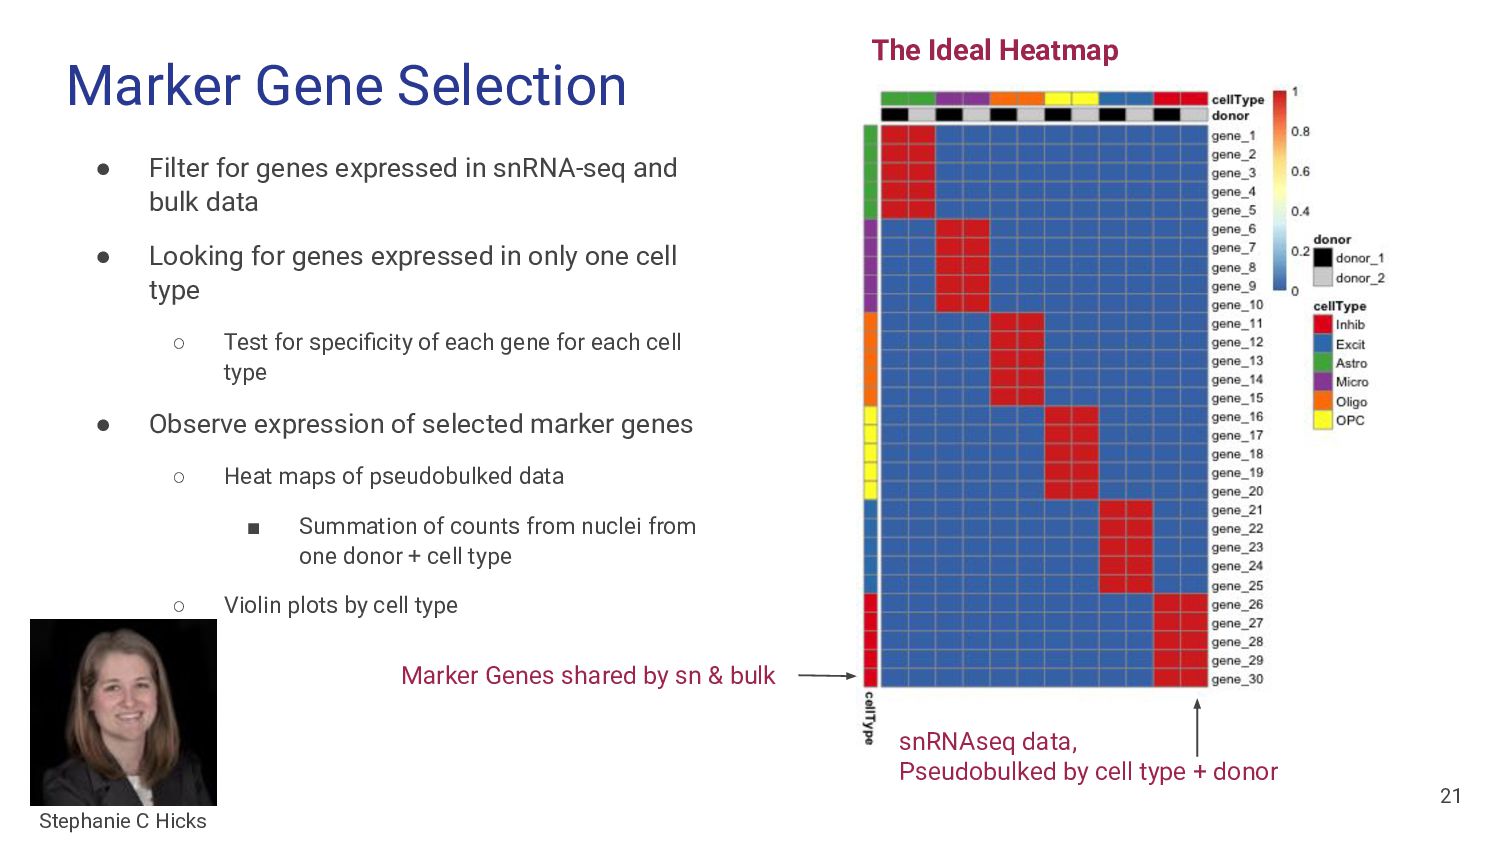
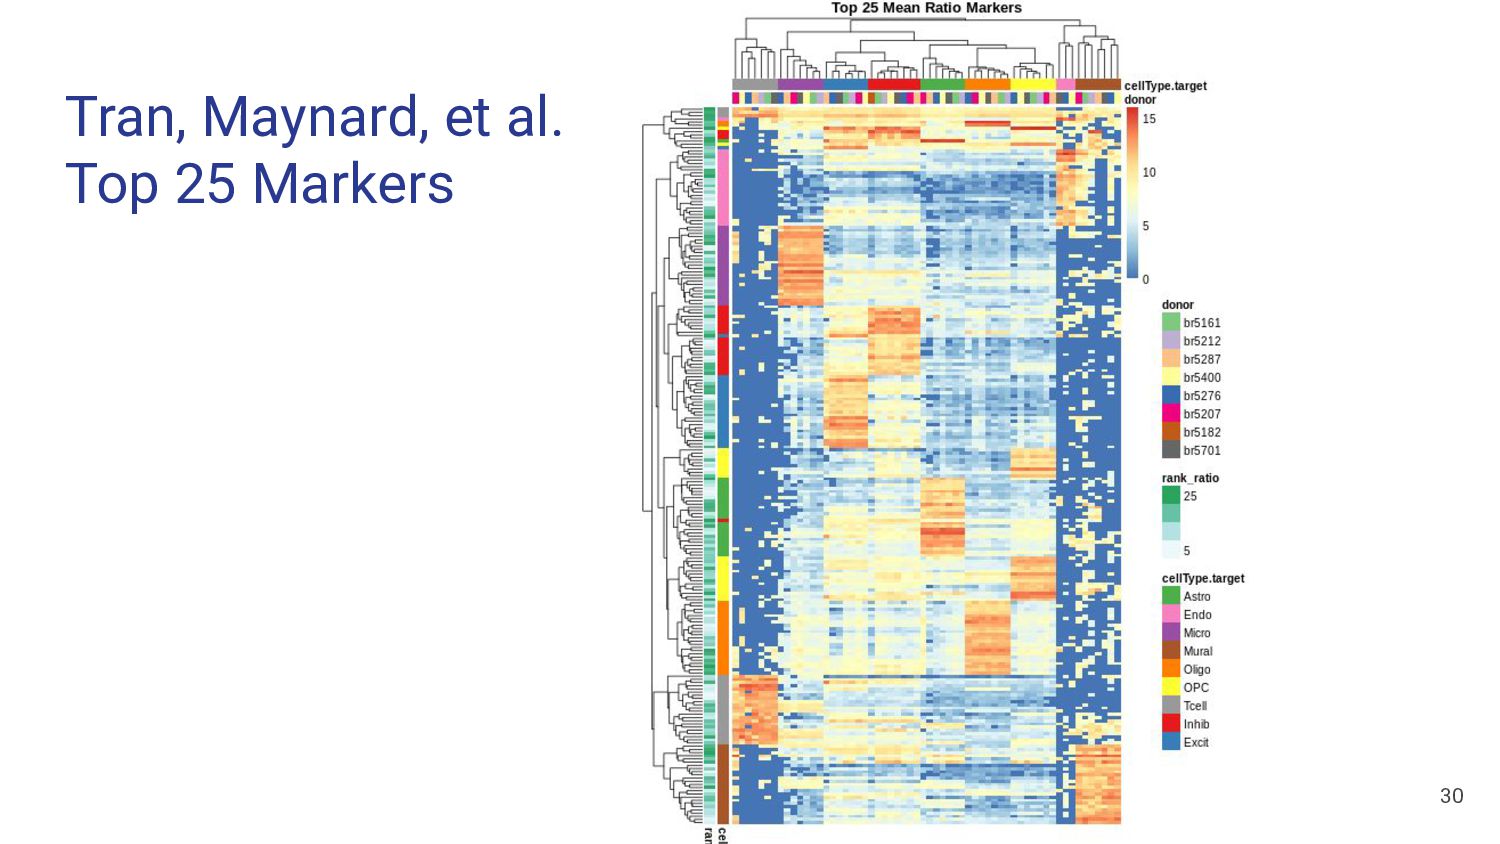
and bulk data • Looking for genes expressed in only one cell type ◦ Test for specificity of each gene for each cell type • Observe expression of selected marker genes ◦ Heat maps of pseudobulked data ▪ Summation of counts from nuclei from one donor + cell type ◦ Violin plots by cell type Marker Genes shared by sn & bulk The Ideal Heatmap snRNAseq data, Pseudobulked by cell type + donor 21 Stephanie C Hicks
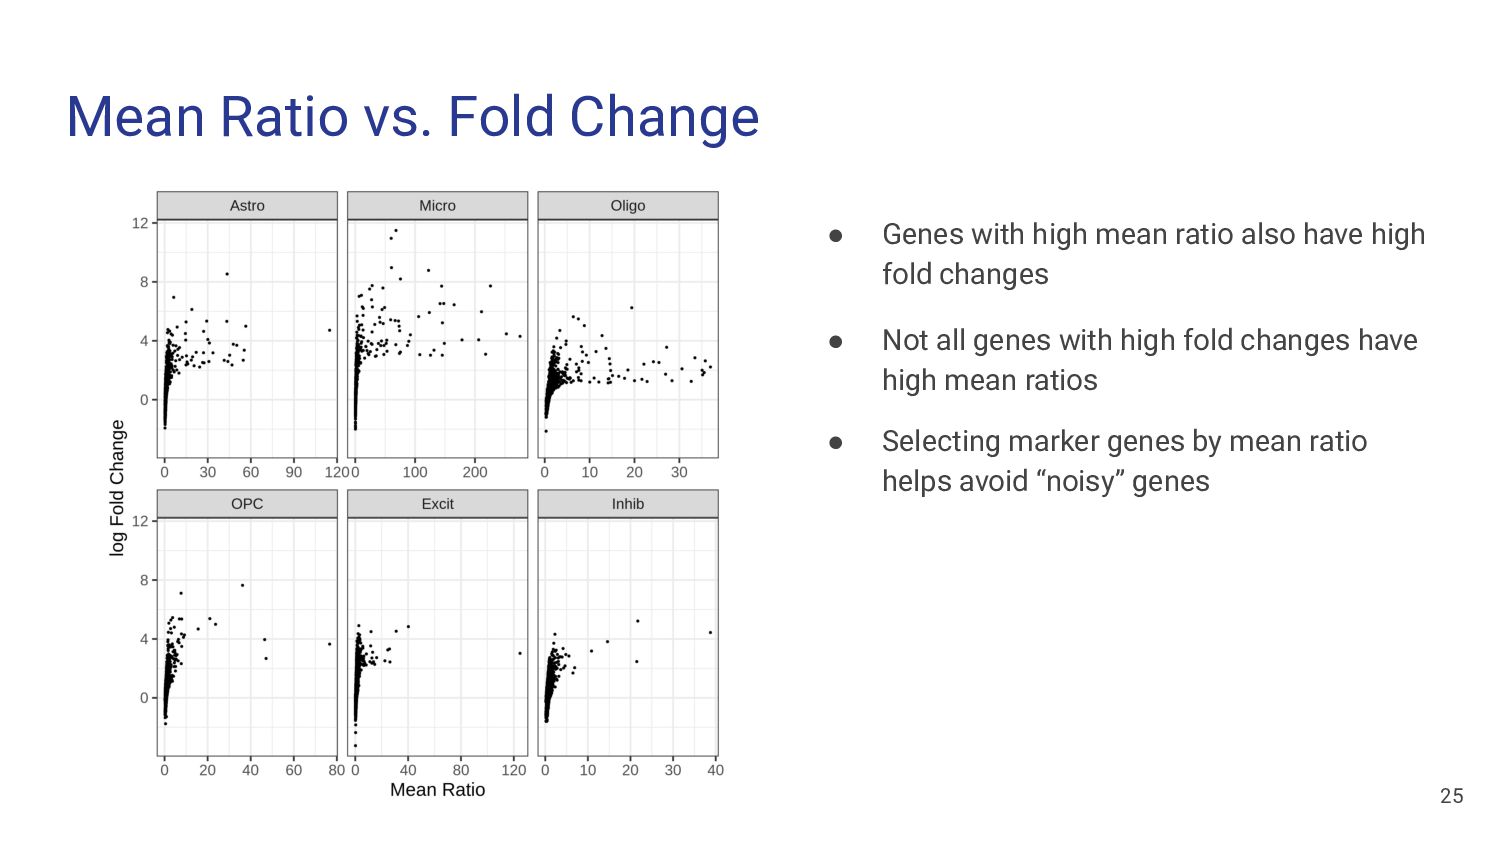
cell type Mean Expression highest non-target cell type = Mean Ratio Higher mean ratio: • the more specific that gene is to the target cell type • the better a marker gene it is 24
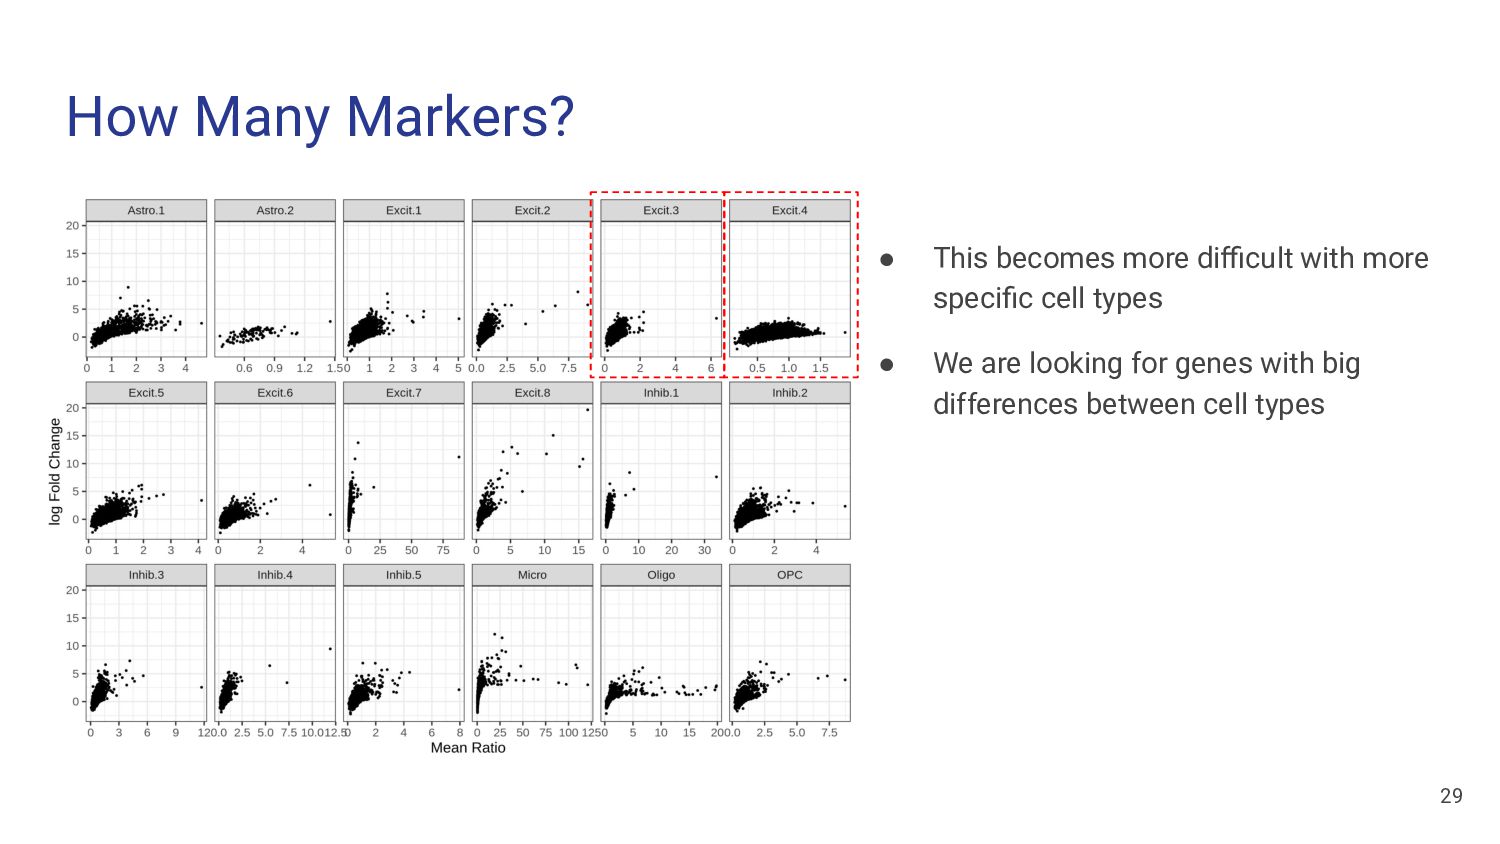
ratio also have high fold changes • Not all genes with high fold changes have high mean ratios • Selecting marker genes by mean ratio helps avoid “noisy” genes 25
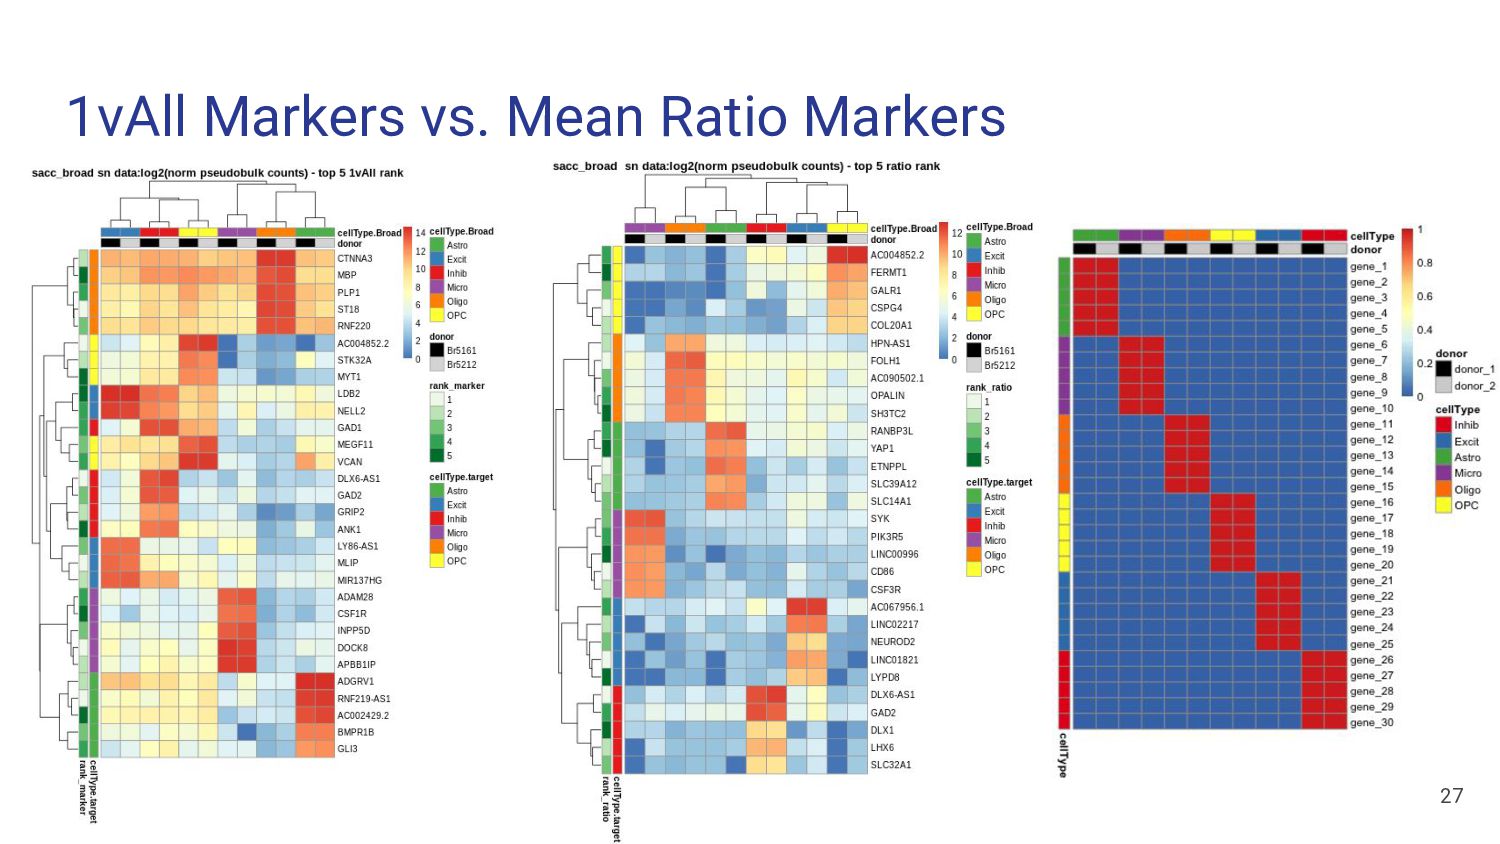
in the “worst” cell type ◦ Least amount of signal ◦ Balance overfitting vs. adding noise ◦ Looking at Inhib: we chose 25 markers • Same number for each cell type
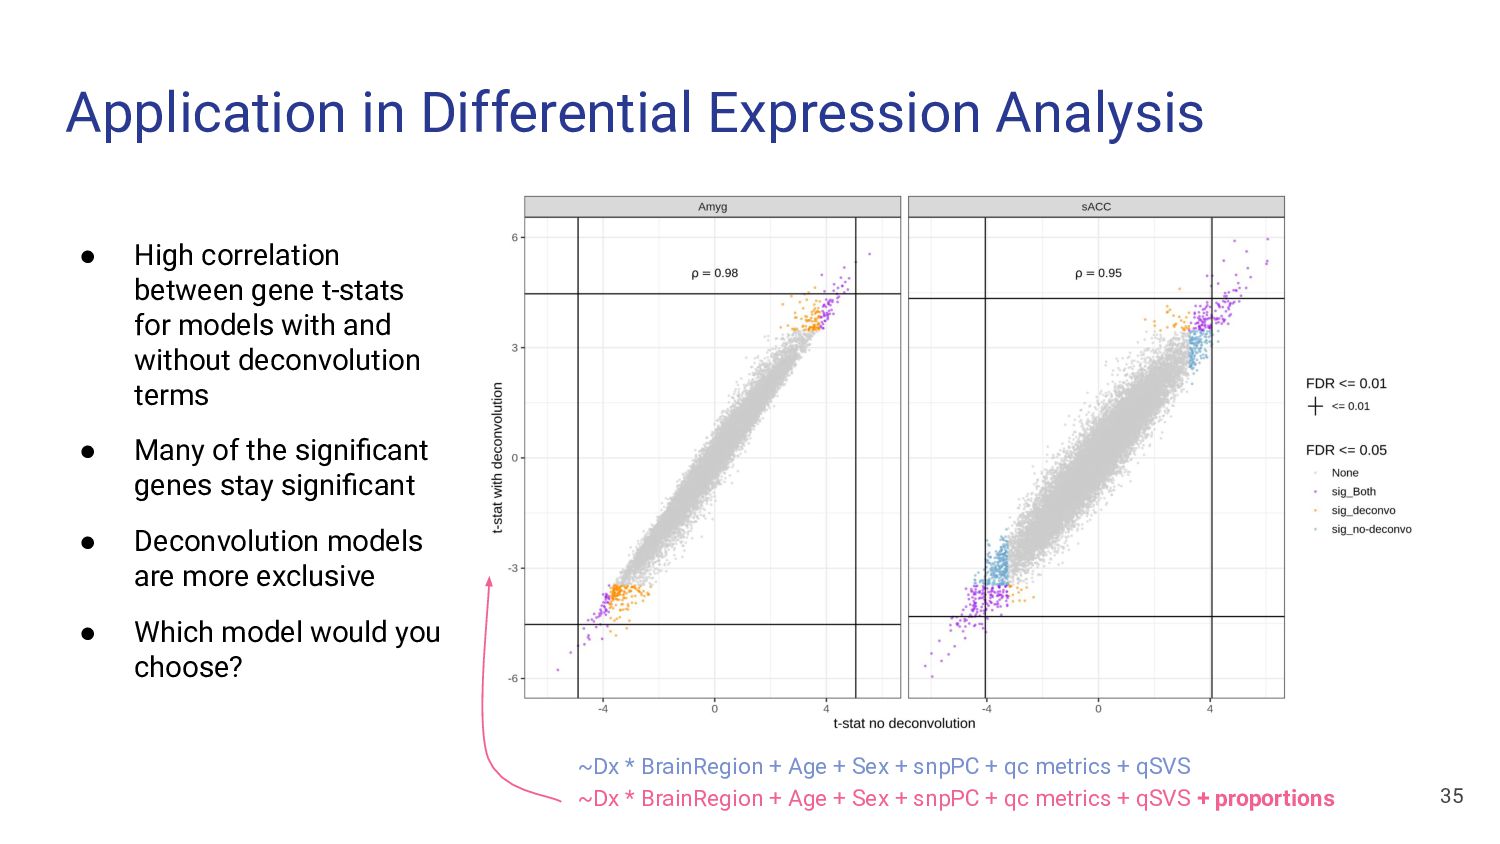
t-stats for models with and without deconvolution terms • Many of the significant genes stay significant • Deconvolution models are more exclusive • Which model would you choose? 35 ~Dx * BrainRegion + Age + Sex + snpPC + qc metrics + qSVS ~Dx * BrainRegion + Age + Sex + snpPC + qc metrics + qSVS + proportions
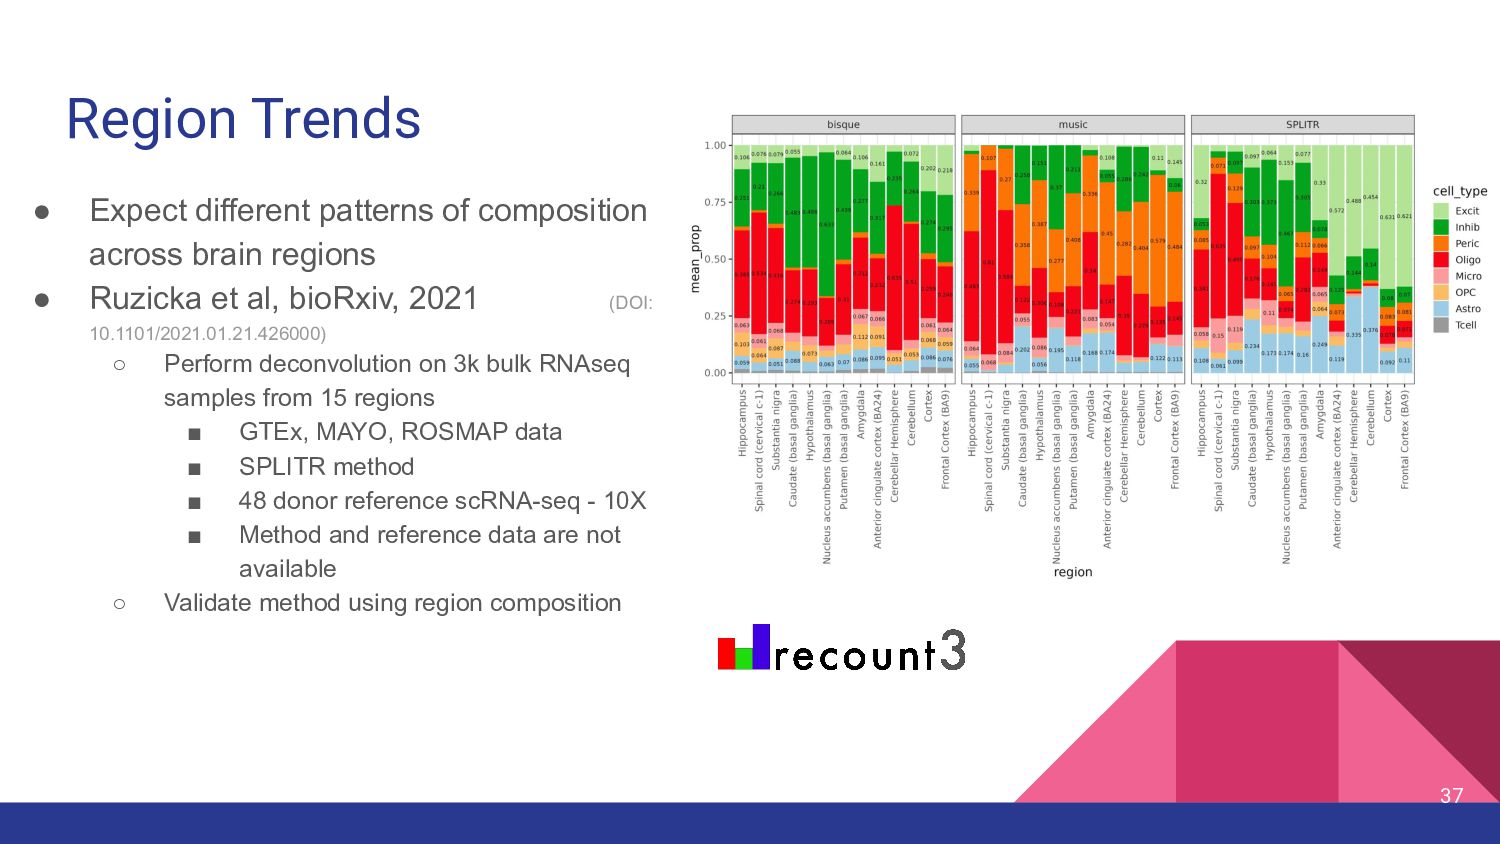
regions • Ruzicka et al, bioRxiv, 2021 (DOI: 10.1101/2021.01.21.426000) ◦ Perform deconvolution on 3k bulk RNAseq samples from 15 regions ▪ GTEx, MAYO, ROSMAP data ▪ SPLITR method ▪ 48 donor reference scRNA-seq - 10X ▪ Method and reference data are not available ◦ Validate method using region composition 37
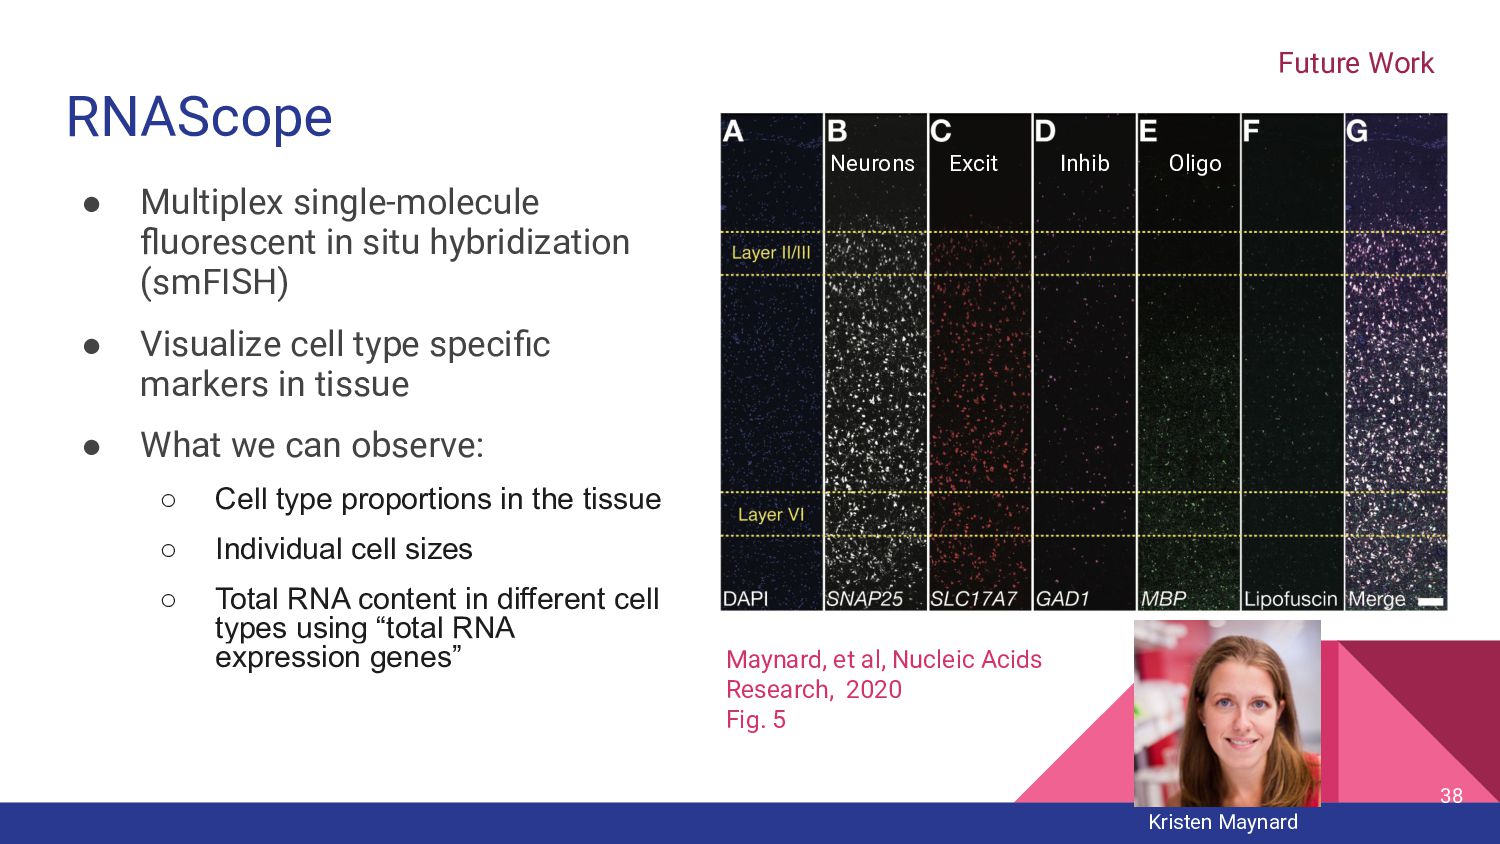
Visualize cell type specific markers in tissue • What we can observe: ◦ Cell type proportions in the tissue ◦ Individual cell sizes ◦ Total RNA content in different cell types using “total RNA expression genes” Maynard, et al, Nucleic Acids Research, 2020 Fig. 5 Future Work Kristen Maynard 38 Neurons Excit Inhib Oligo
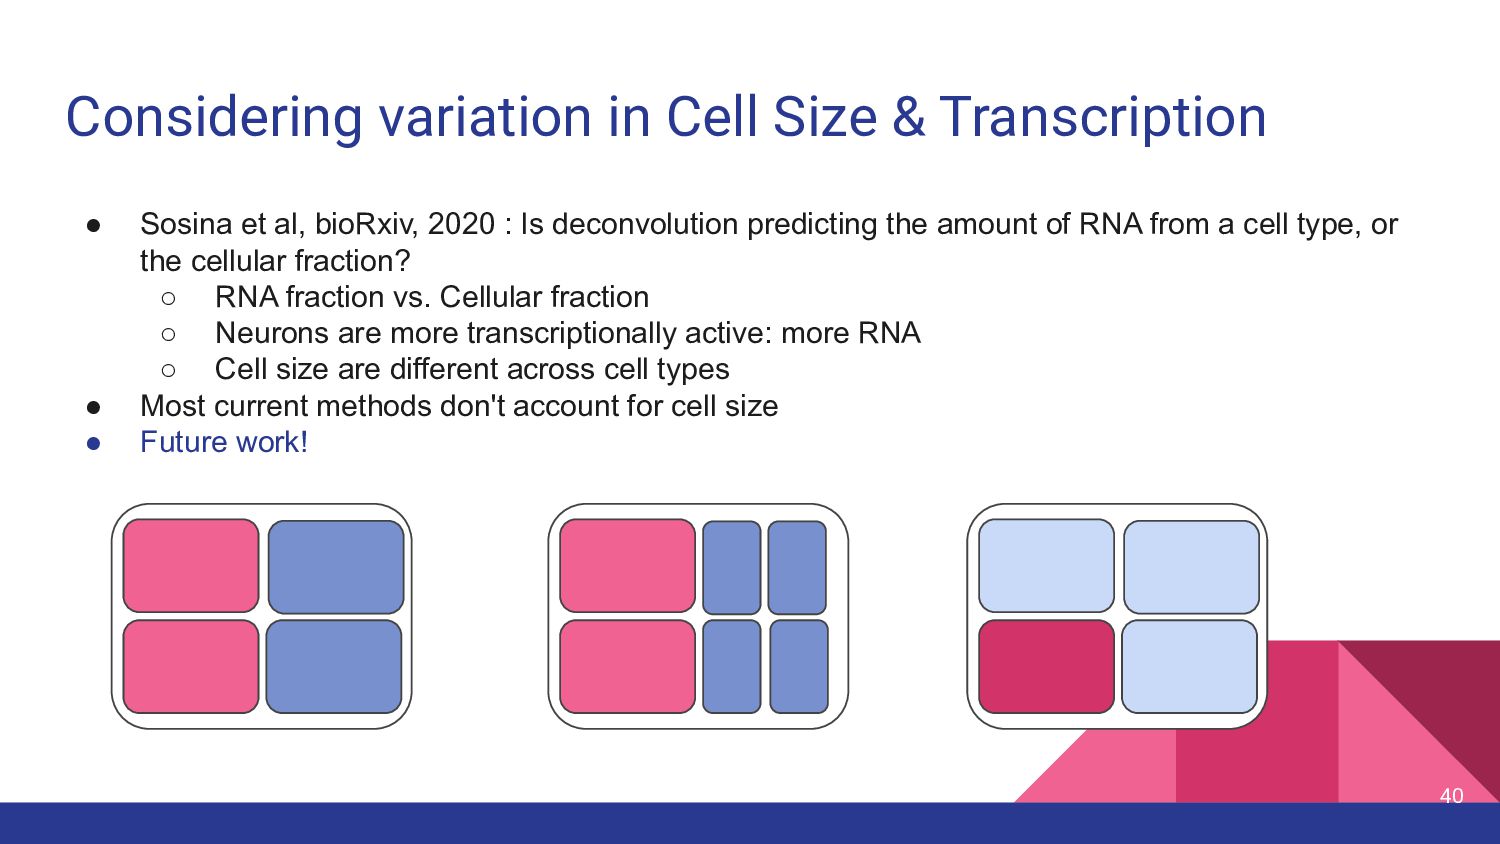
al, bioRxiv, 2020 : Is deconvolution predicting the amount of RNA from a cell type, or the cellular fraction? ◦ RNA fraction vs. Cellular fraction ◦ Neurons are more transcriptionally active: more RNA ◦ Cell size are different across cell types • Most current methods don't account for cell size • Future work! 40
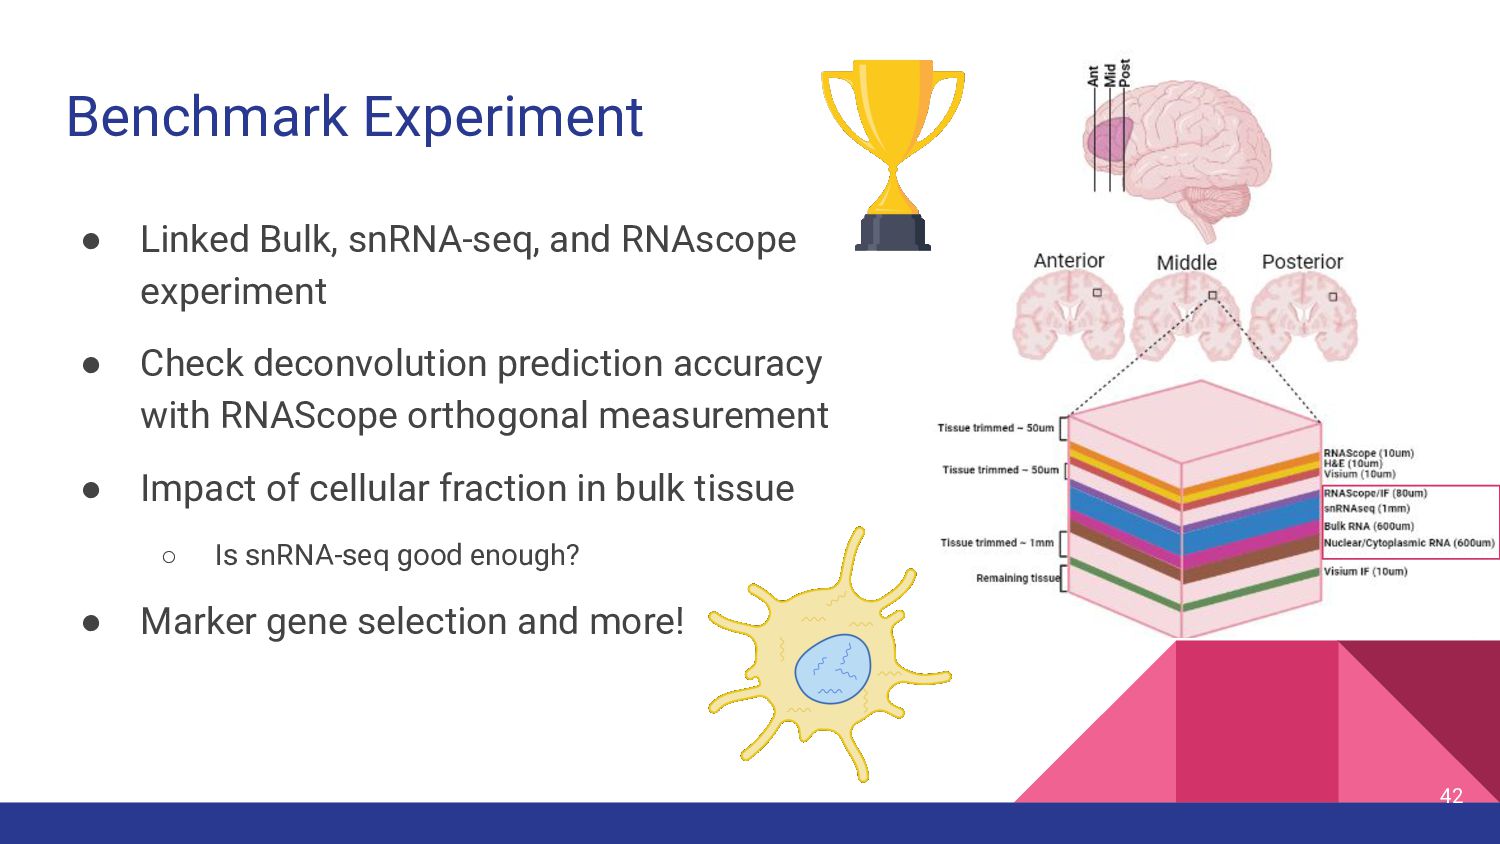
Check deconvolution prediction accuracy with RNAScope orthogonal measurement • Impact of cellular fraction in bulk tissue ◦ Is snRNA-seq good enough? • Marker gene selection and more! 42