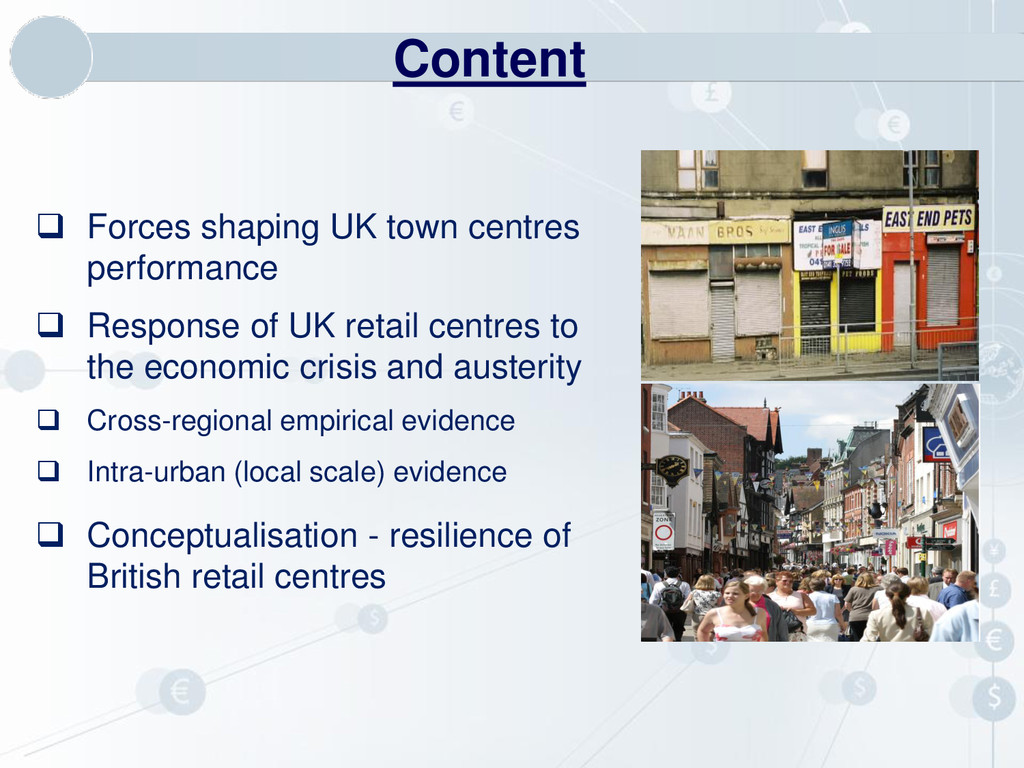
UK retail centres to the economic crisis and austerity Cross-regional empirical evidence Intra-urban (local scale) evidence Conceptualisation - resilience of British retail centres Content
first’ – regulatory tightening Prioritisation of UK town centres by PPG 6 Adoption of the ‘sequential test’ Promotion of the vitality & viability of town centres by PPS 6 ‘Social inclusion’ and ‘urban regeneration’ agendas Impact of retail planning policies
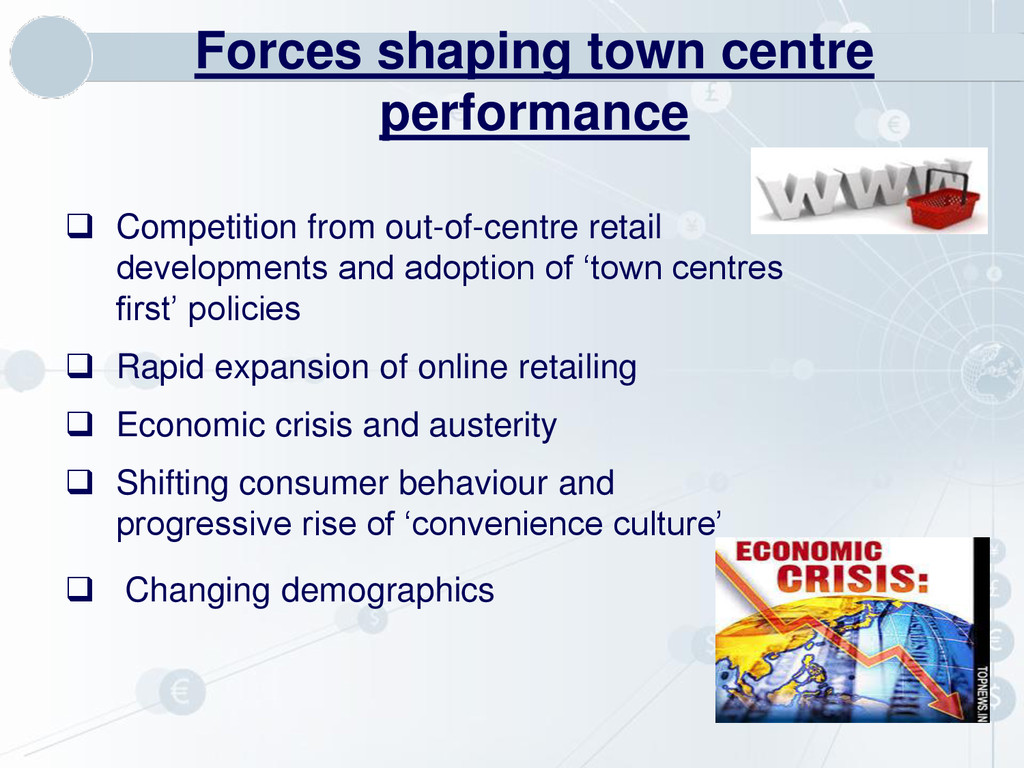
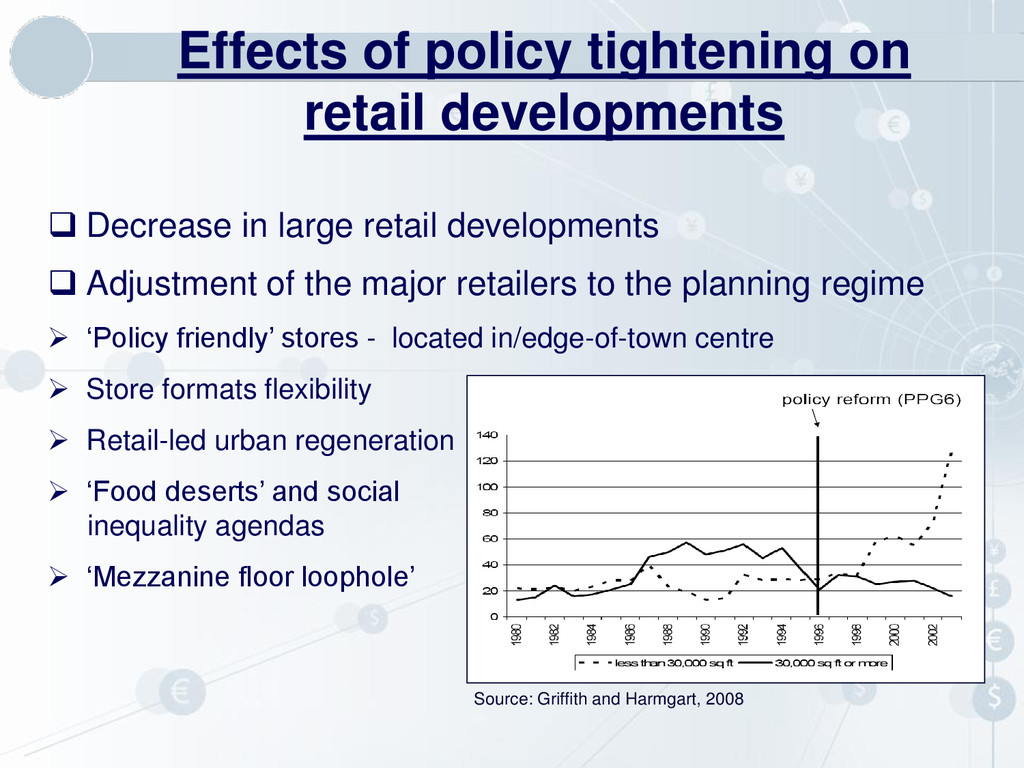
retail developments Decrease in large retail developments Adjustment of the major retailers to the planning regime ‘Policy friendly’ stores - located in/edge-of-town centre Store formats flexibility Retail-led urban regeneration ‘Food deserts’ and social inequality agendas ‘Mezzanine floor loophole’
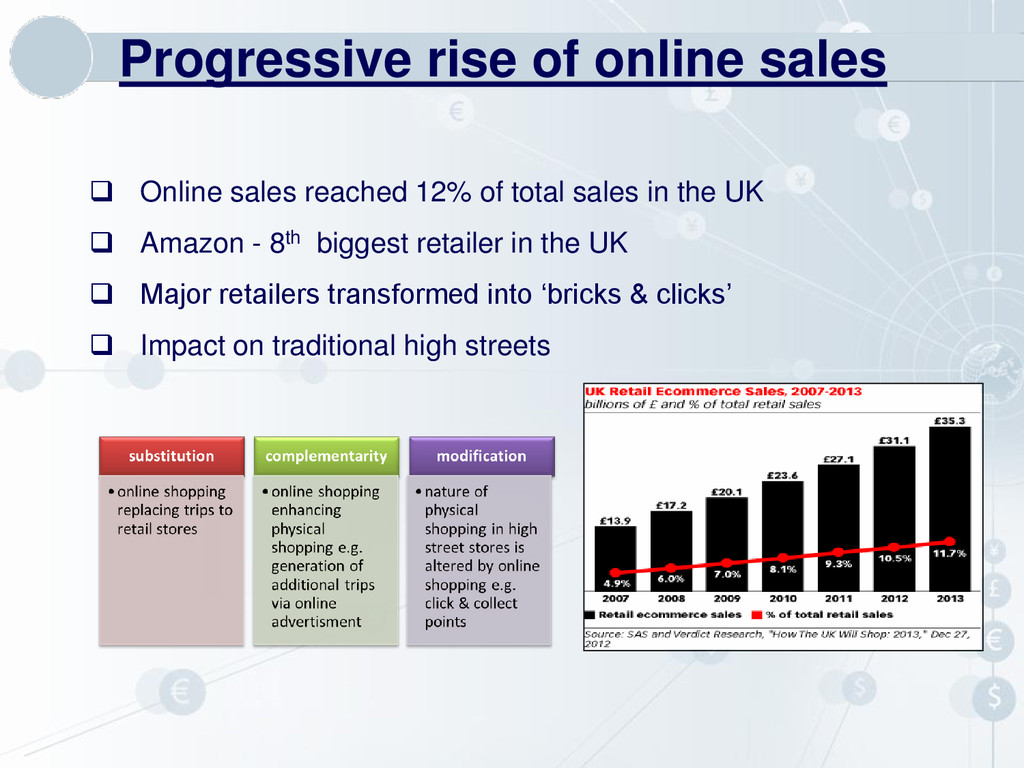
UK Amazon - 8th biggest retailer in the UK Major retailers transformed into ‘bricks & clicks’ Impact on traditional high streets Progressive rise of online sales
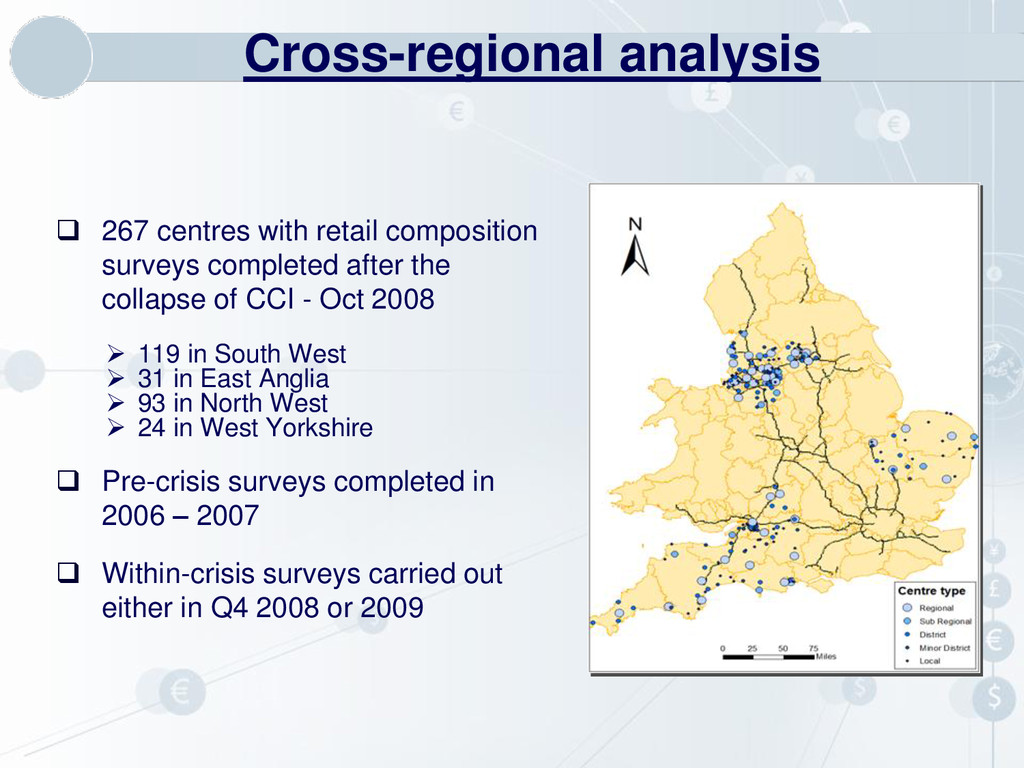
collapse of CCI - Oct 2008 119 in South West 31 in East Anglia 93 in North West 24 in West Yorkshire Pre-crisis surveys completed in 2006 – 2007 Within-crisis surveys carried out either in Q4 2008 or 2009 Cross-regional analysis
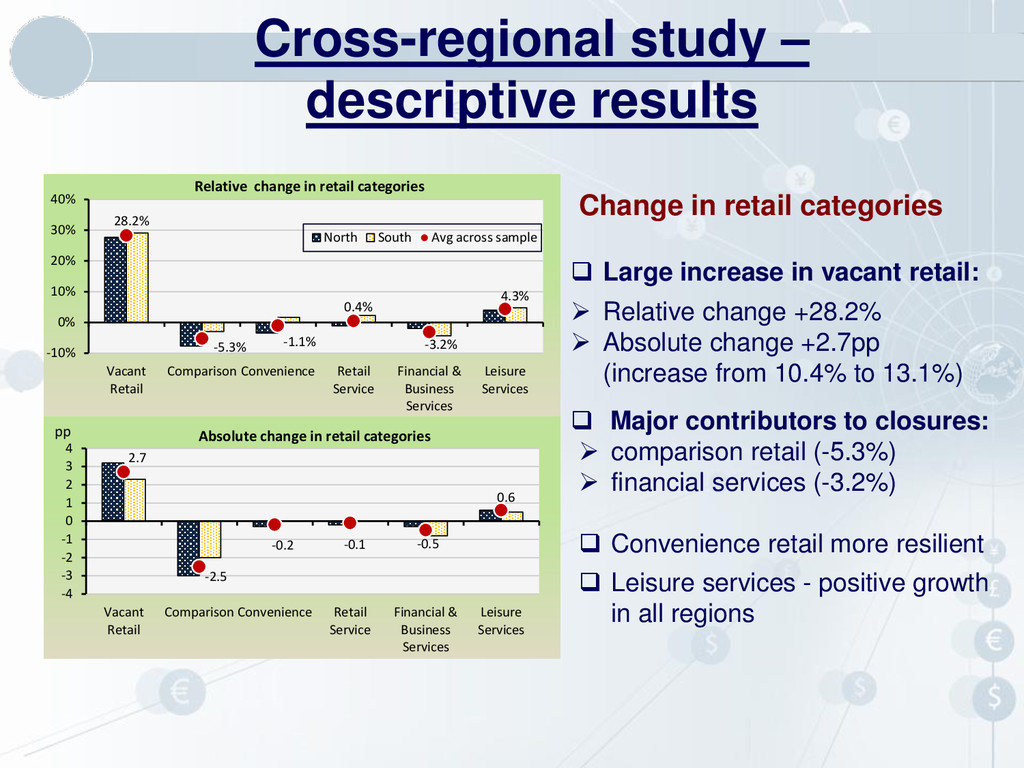
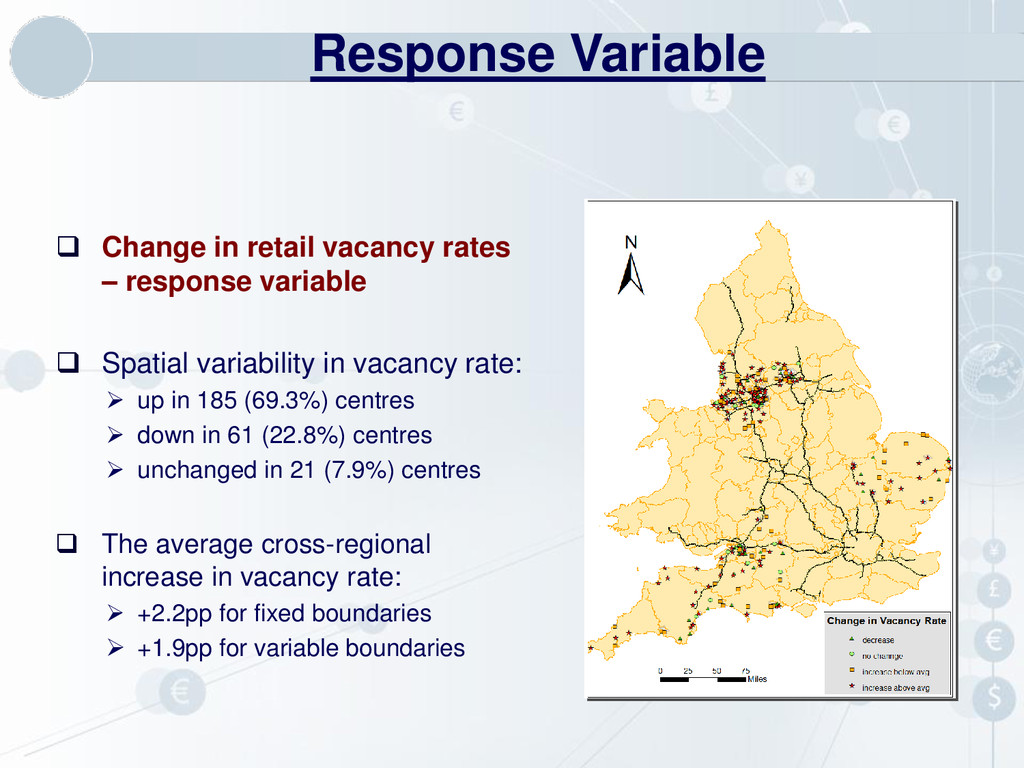
Spatial variability in vacancy rate: up in 185 (69.3%) centres down in 61 (22.8%) centres unchanged in 21 (7.9%) centres The average cross-regional increase in vacancy rate: +2.2pp for fixed boundaries +1.9pp for variable boundaries Response Variable
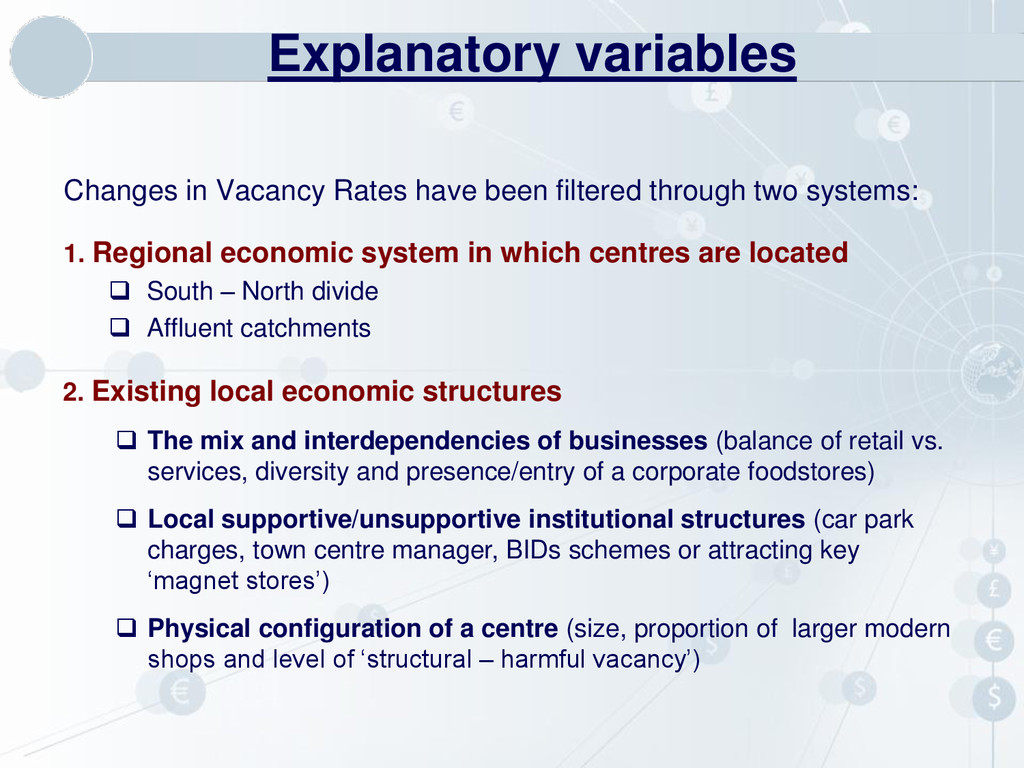
1. Regional economic system in which centres are located South – North divide Affluent catchments 2. Existing local economic structures The mix and interdependencies of businesses (balance of retail vs. services, diversity and presence/entry of a corporate foodstores) Local supportive/unsupportive institutional structures (car park charges, town centre manager, BIDs schemes or attracting key ‘magnet stores’) Physical configuration of a centre (size, proportion of larger modern shops and level of ‘structural – harmful vacancy’) Explanatory variables
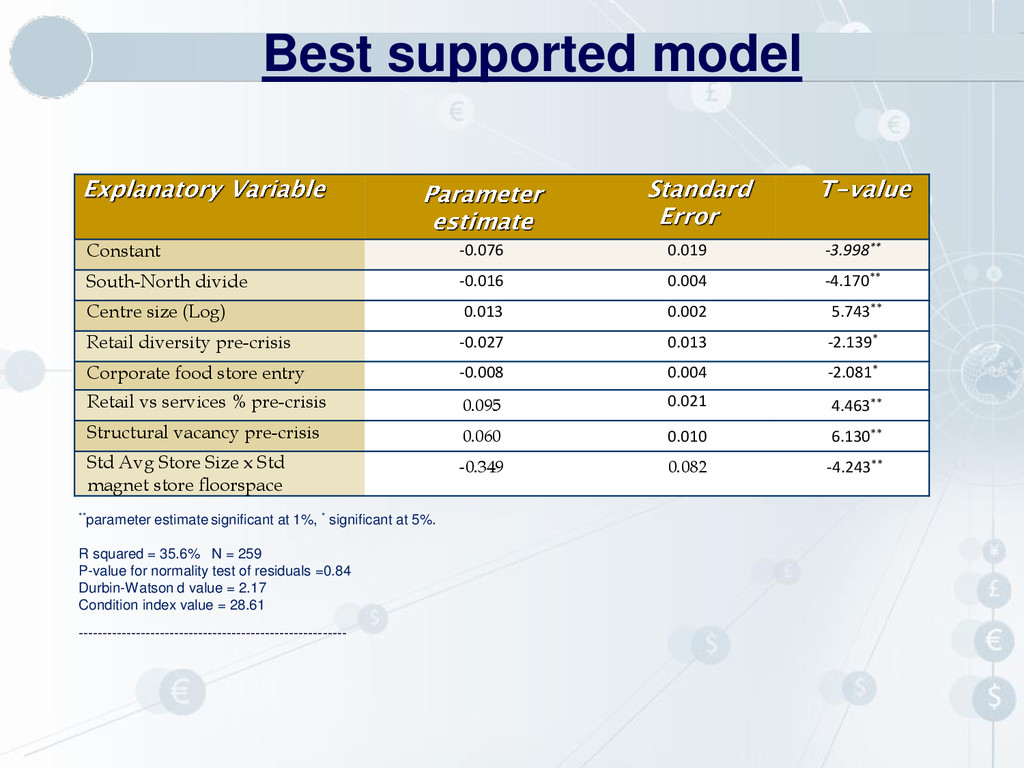
size (Log) 0.013 0.002 5.743** Retail diversity pre-crisis -0.027 0.013 -2.139* Corporate food store entry -0.008 0.004 -2.081* Retail vs services % pre-crisis 0.095 0.021 4.463** Structural vacancy pre-crisis 0.060 0.010 6.130** Std Avg Store Size x Std magnet store floorspace -0.349 0.082 -4.243** Best supported model **parameter estimate significant at 1%, * significant at 5%. R squared = 35.6% N = 259 P-value for normality test of residuals =0.84 Durbin-Watson d value = 2.17 Condition index value = 28.61 --------------------------------------------------------
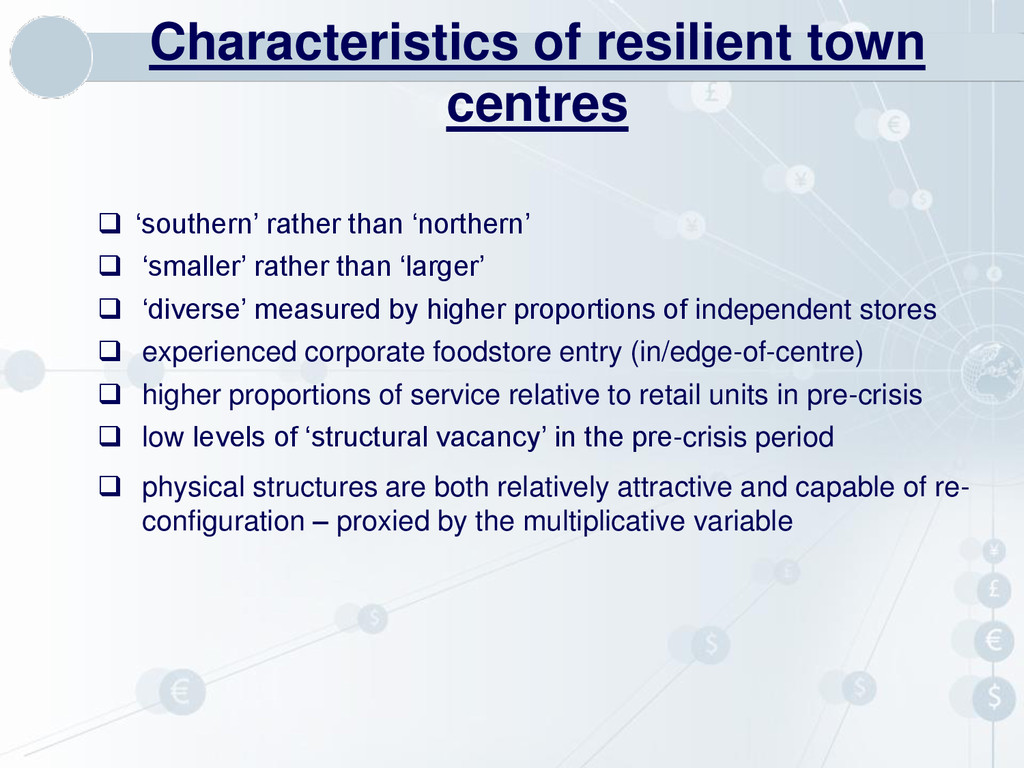
‘smaller’ rather than ‘larger’ ‘diverse’ measured by higher proportions of independent stores experienced corporate foodstore entry (in/edge-of-centre) higher proportions of service relative to retail units in pre-crisis low levels of ‘structural vacancy’ in the pre-crisis period physical structures are both relatively attractive and capable of re- configuration – proxied by the multiplicative variable
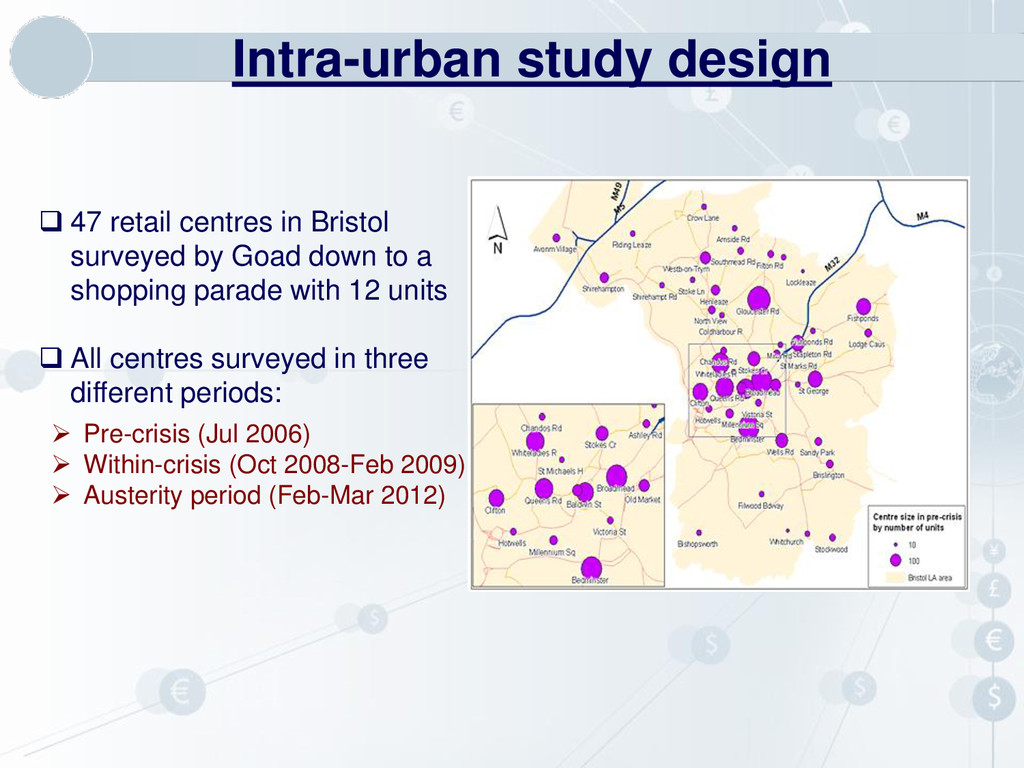
by Goad down to a shopping parade with 12 units All centres surveyed in three different periods: Pre-crisis (Jul 2006) Within-crisis (Oct 2008-Feb 2009) Austerity period (Feb-Mar 2012)
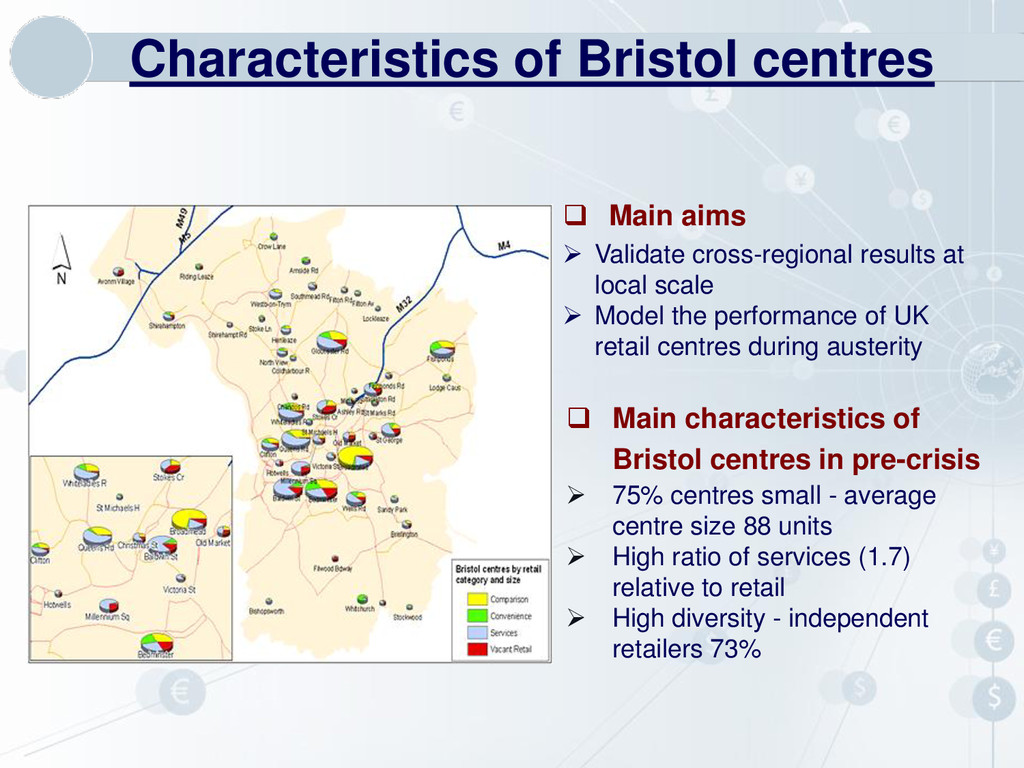
centres small - average centre size 88 units High ratio of services (1.7) relative to retail High diversity - independent retailers 73% Characteristics of Bristol centres Main aims Validate cross-regional results at local scale Model the performance of UK retail centres during austerity
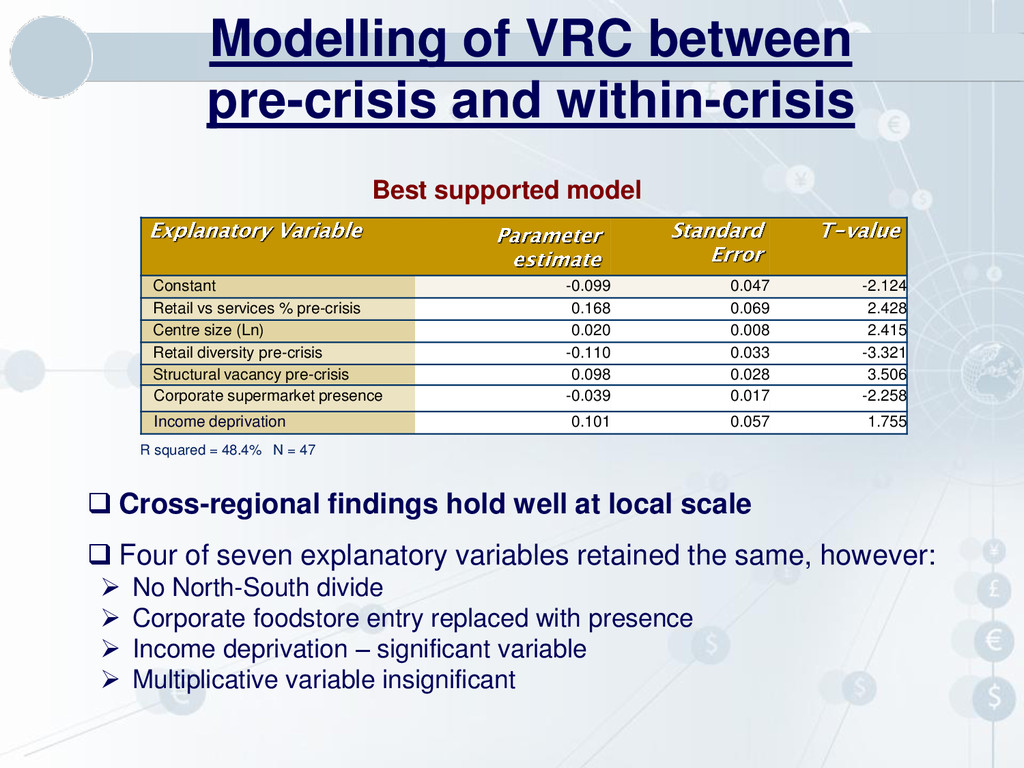
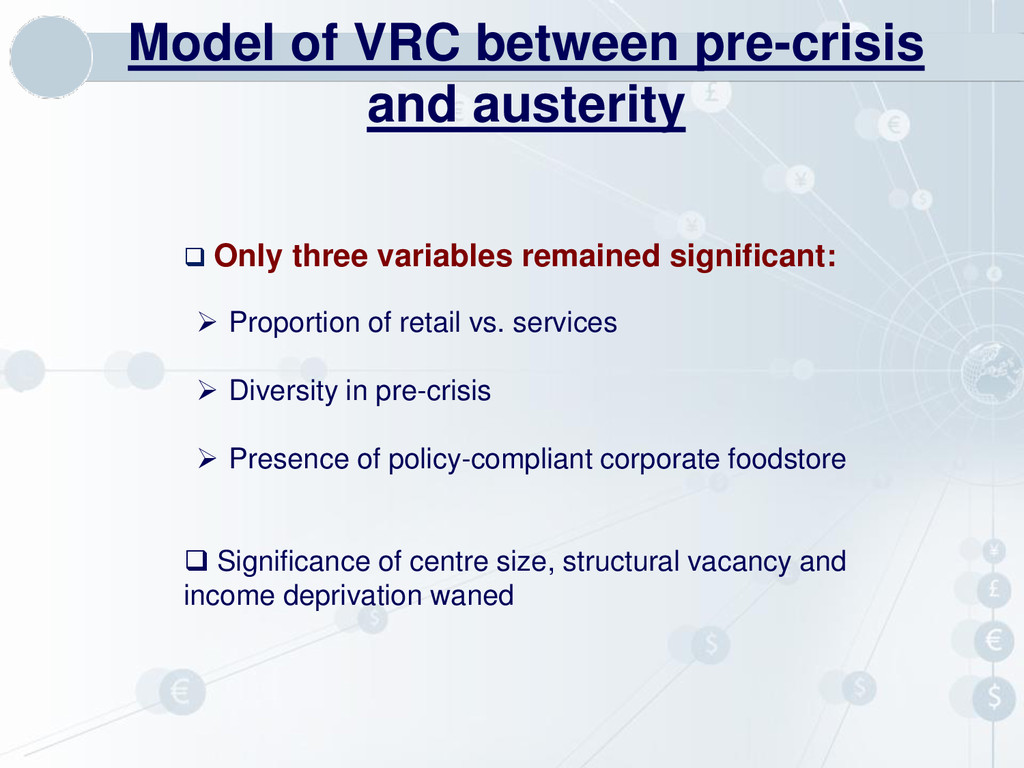
vs. services Diversity in pre-crisis Presence of policy-compliant corporate foodstore Significance of centre size, structural vacancy and income deprivation waned Model of VRC between pre-crisis and austerity
‘why some regional economies manage to renew themselves, whereas others remain locked in decline’? (Hassink, 2010) Resilience of economic systems recently attracted wide-spread attention of social sciences Resilience is defined as: ‘the ability to recover form and position elastically following a disturbance of some form’
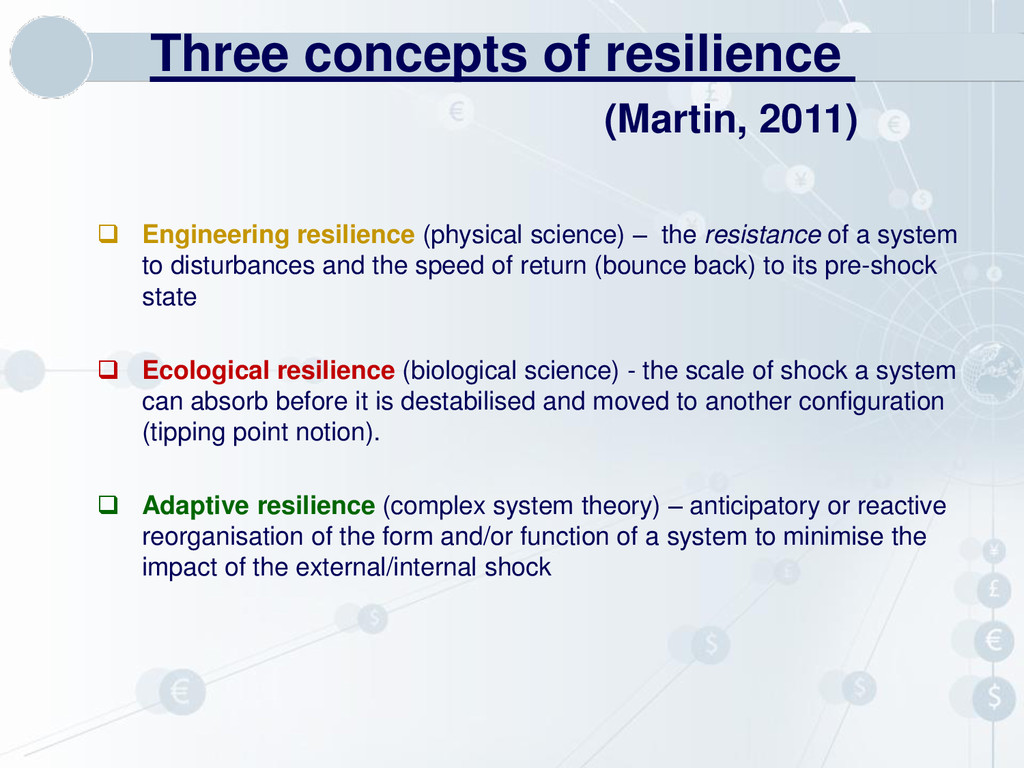
system to disturbances and the speed of return (bounce back) to its pre-shock state Ecological resilience (biological science) - the scale of shock a system can absorb before it is destabilised and moved to another configuration (tipping point notion). Adaptive resilience (complex system theory) – anticipatory or reactive reorganisation of the form and/or function of a system to minimise the impact of the external/internal shock Three concepts of resilience (Martin, 2011)
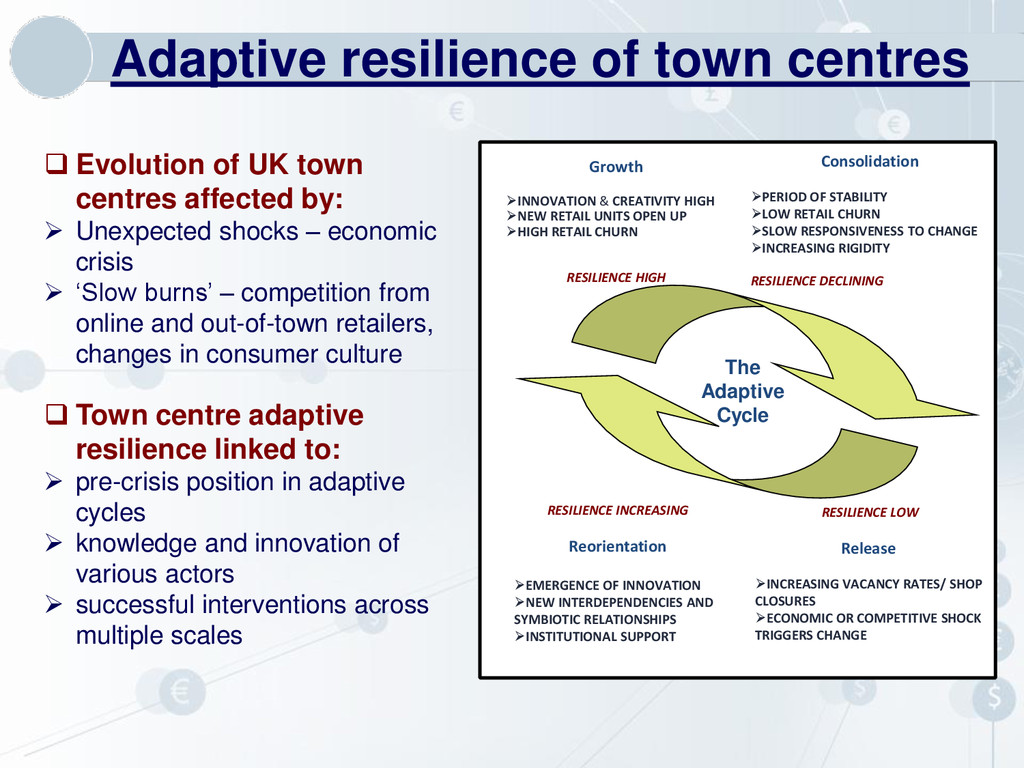
shocks – economic crisis ‘Slow burns’ – competition from online and out-of-town retailers, changes in consumer culture Adaptive resilience of town centres Town centre adaptive resilience linked to: pre-crisis position in adaptive cycles knowledge and innovation of various actors successful interventions across multiple scales The Adaptive Cycle Growth INNOVATION & CREATIVITY HIGH NEW RETAIL UNITS OPEN UP HIGH RETAIL CHURN RESILIENCE HIGH Consolidation PERIOD OF STABILITY LOW RETAIL CHURN SLOW RESPONSIVENESS TO CHANGE INCREASING RIGIDITY RESILIENCE DECLINING RESILIENCE LOW Release INCREASING VACANCY RATES/ SHOP CLOSURES ECONOMIC OR COMPETITIVE SHOCK TRIGGERS CHANGE RESILIENCE INCREASING Reorientation EMERGENCE OF INNOVATION NEW INTERDEPENDENCIES AND SYMBIOTIC RELATIONSHIPS INSTITUTIONAL SUPPORT
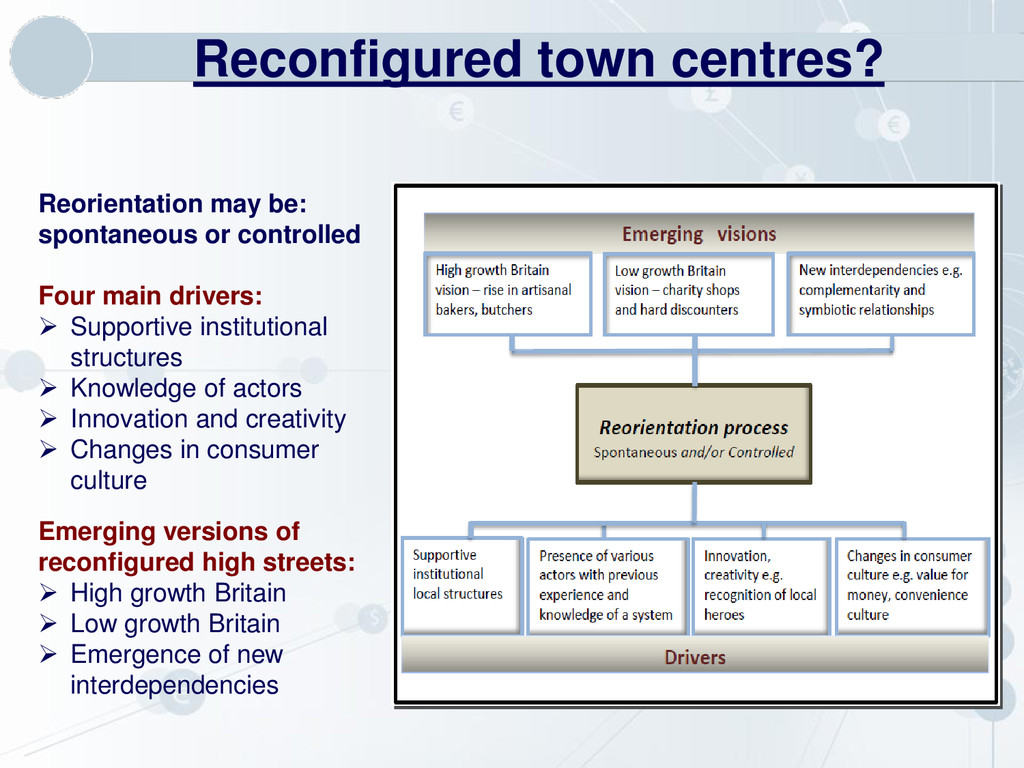
main drivers: Supportive institutional structures Knowledge of actors Innovation and creativity Changes in consumer culture Emerging versions of reconfigured high streets: High growth Britain Low growth Britain Emergence of new interdependencies
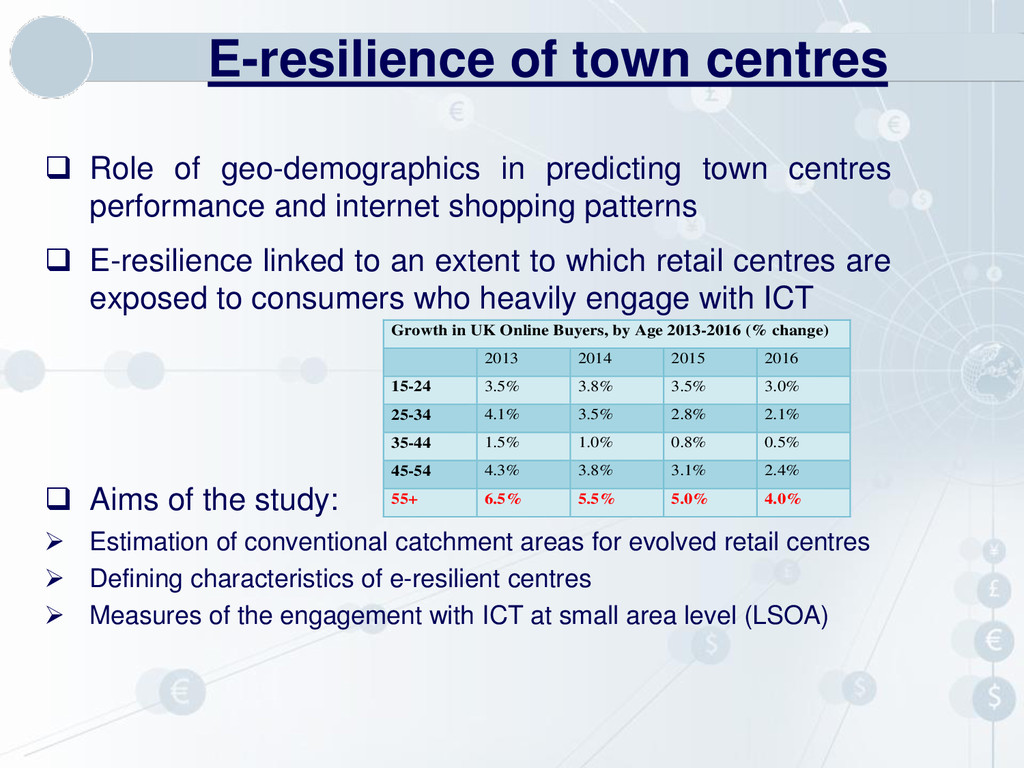
internet shopping patterns E-resilience linked to an extent to which retail centres are exposed to consumers who heavily engage with ICT Aims of the study: Estimation of conventional catchment areas for evolved retail centres Defining characteristics of e-resilient centres Measures of the engagement with ICT at small area level (LSOA) E-resilience of town centres Growth in UK Online Buyers, by Age 2013-2016 (% change) 2013 2014 2015 2016 15-24 3.5% 3.8% 3.5% 3.0% 25-34 4.1% 3.5% 2.8% 2.1% 35-44 1.5% 1.0% 0.8% 0.5% 45-54 4.3% 3.8% 3.1% 2.4% 55+ 6.5% 5.5% 5.0% 4.0%
during economic crisis and austerity provided First multiplicative modelling of drivers of that performance Evidence on both diversity and corporate food store entry benefiting the economic health of retail centres, despite being portrayed as polar opposites Conceptualisation of adaptive resilience of UK high streets Exploring the relationship between the geo-demographics and e-resilience of town centres Value added