Upgrade to Pro — share decks privately, control downloads, hide ads and more …

4 logging and metrics systems in 40 minutes

4 logging and metrics systems in 40 minutes

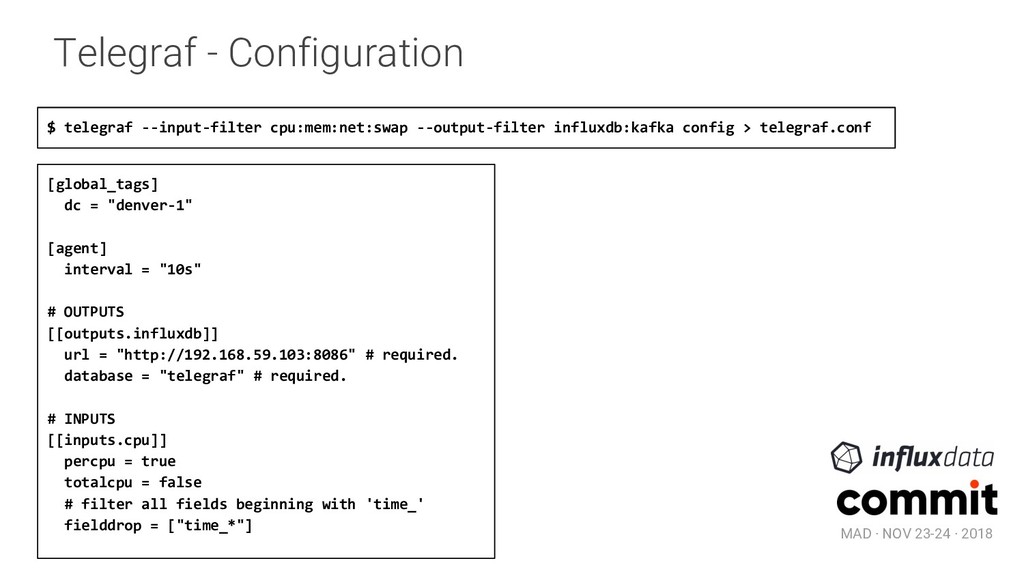
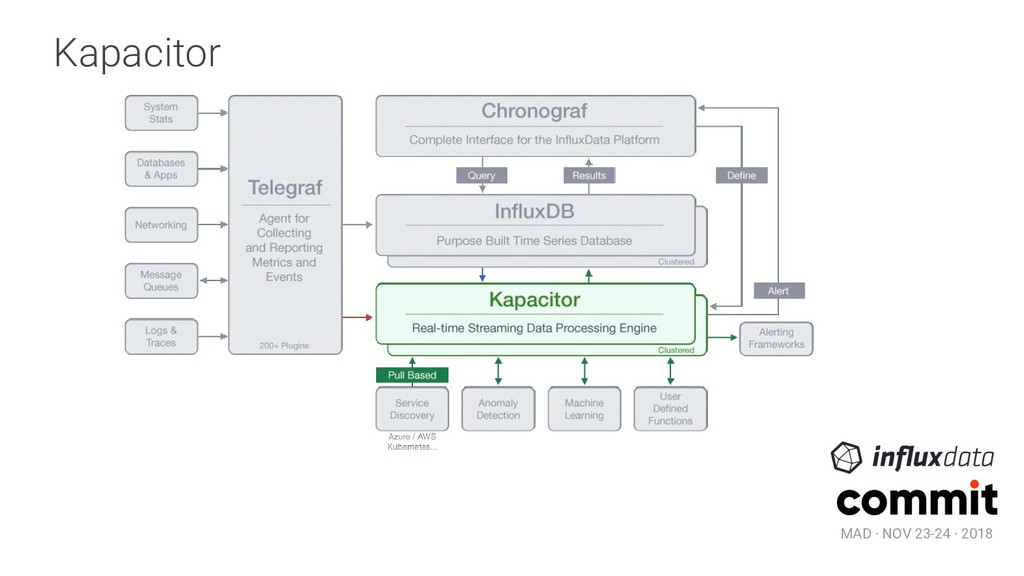
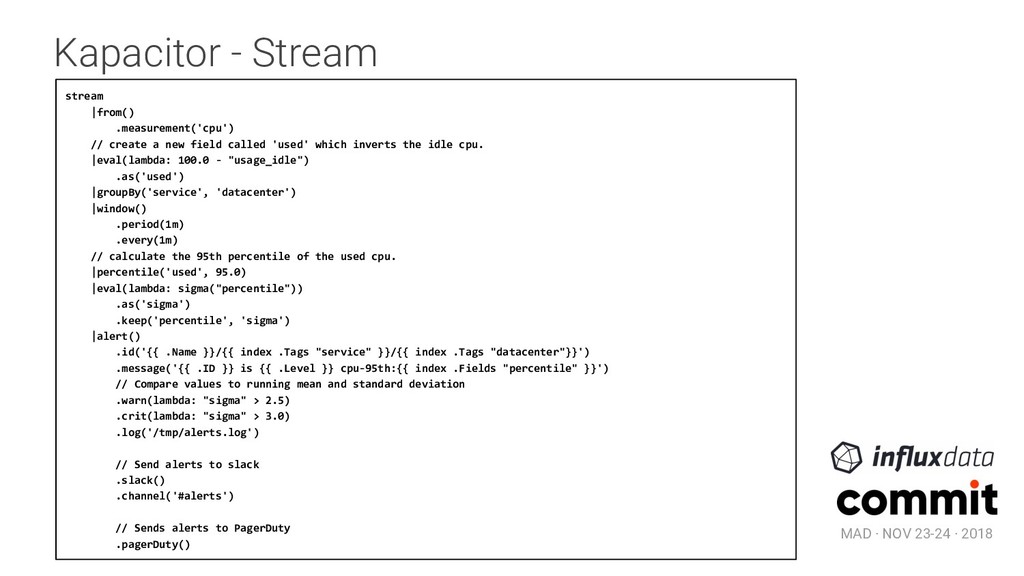
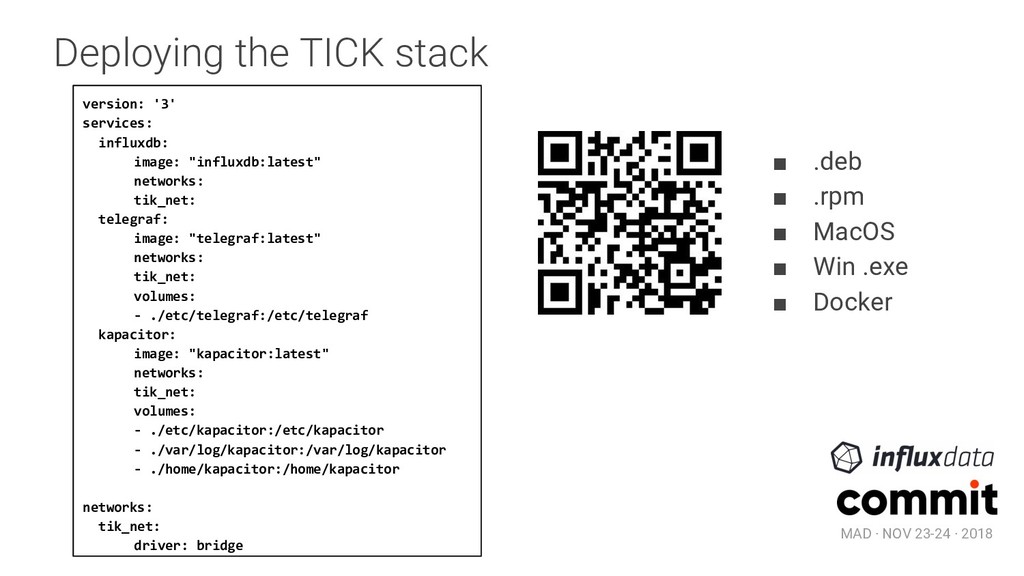
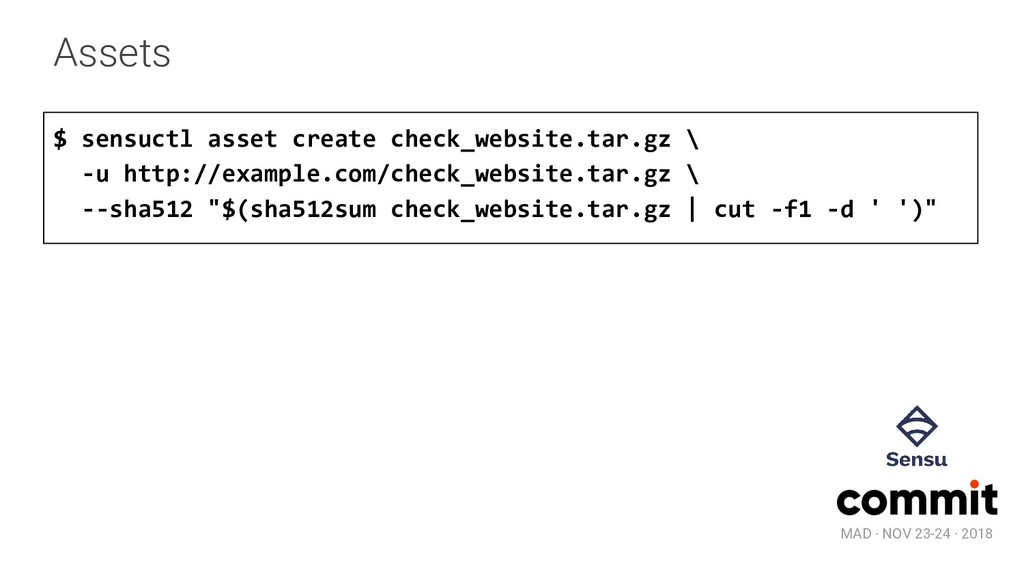
En 40 minutos introduciré 4 sistemas de logging y métricas para que pruebes una cucharada para cada uno de ellos y descubras cuál incorporar a tu próximo proyecto.

Aprovecha tu tiempo y saborea este resumen sobre sus características, cómo se despliegan y las ventajas e inconvenientes de cada uno de ellos. En principio el menú incluye Elasticsearch & friends, Sensu, InfluxDB & friends y Prometheus, aunque los platos pueden variar según productos de temporada. ¡Bon apetit!
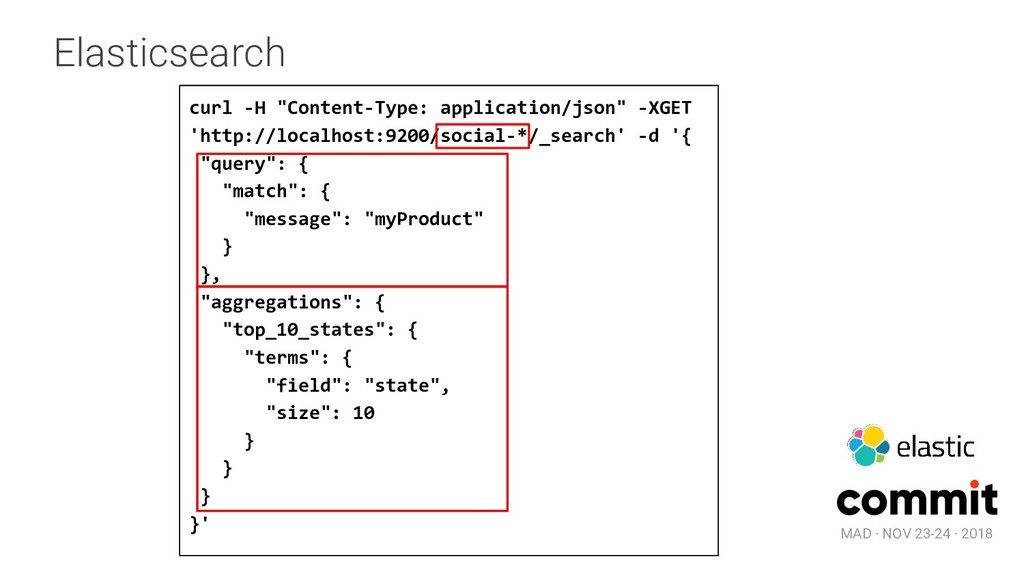
Alejandro Guirao Rodríguez

November 03, 2018
Tweet

Transcript

  1. MAD · NOV 23-24 · 2018 4 logging and metrics

    systems in 40 minutes MAD · NOV 23-24 · 2018 Alejandro Guirao @lekum github.com/lekum lekum.org https://speakerdeck.com/lekum/4-logging-and-me trics-systems-in-40-minutes
  2. MAD · NOV 23-24 · 2018 curl -H "Content-Type: application/json"

    -XGET 'http://localhost:9200/social-*/_search' -d '{ "query": { "match": { "message": "myProduct" } }, "aggregations": { "top_10_states": { "terms": { "field": "state", "size": 10 } } } }' Elasticsearch
  3. MAD · NOV 23-24 · 2018 Elasticsearch { "hits":{ "total"

    : 329, "hits" : [ { "_index" : "social-2018", "_type" : "_doc", "_id" : "0", "_score": 1.3862944, "_source" : { "user" : "kimchy", "state" : "ID", "date" : "2018-10-15T14:12:12", "message" : "try my product”, "likes": 0 [...]
  4. MAD · NOV 23-24 · 2018 Elasticsearch { [...] "aggregations"

    : { "top_10_states" : { "buckets" : [ { "key" : "ID", "doc_count" : 27 },[...] }, { "key" : "MO", "doc_count" : 20 } ] } } }
  5. MAD · NOV 23-24 · 2018 Logstash - Inputs azure_event_hubs

    beats cloudwatch couchdb_changes dead_letter_queue elasticsearch exec file ganglia gelf generator github google_pubsub graphite heartbeat http http_poller imap irc jdbc jms jmx kafka kinesis log4j lumberjack meetup pipe puppet_facter rabbitmq redis rss s3 salesforce snmptrap sqlite sqs stdin stomp syslog tcp twitter udp unix varnishlog websocket xmpp [...] redis { port => "6379" host => "redis.example.com" key => "logstash" data_type => "list" }
  6. MAD · NOV 23-24 · 2018 Logstash - Filters filter

    { grok { match => { "message" => "%{COMBINEDAPACHELOG}" } } date { match => [ "timestamp" , "dd/MMM/yyyy:HH:mm:ss Z" ] } }
  7. MAD · NOV 23-24 · 2018 Logstash - Outputs output

    { elasticsearch { hosts => ["localhost:9200"] } stdout { codec => rubydebug } } boundary circonus cloudwatch csv datadog datadog_metrics elasticsearch email exec file ganglia gelf google_bigquery google_pubsub graphite kafka librato loggly lumberjack metriccatcher mongodb nagios nagios_nsca opentsdb pagerduty pipe rabbitmq redis [...]
  8. MAD · NOV 23-24 · 2018 Beats filebeat.inputs: - type:

    log enabled: true paths: - /var/log/*.log output.elasticsearch: hosts: ["myEShost:9200"] username: "filebeat_internal" password: "YOUR_PASSWORD"
  9. MAD · NOV 23-24 · 2018 Deploying Elastic Stack version:

    '2.2' services: elasticsearch: image: docker.elastic.co/elasticsearch/elasticsearch:6.4.2 container_name: elasticsearch environment: - cluster.name=docker-cluster - bootstrap.memory_lock=true - "ES_JAVA_OPTS=-Xms512m -Xmx512m" volumes: - esdata1:/usr/share/elasticsearch/data ports: - 9200:9200 networks: - esnet elasticsearch2: image: docker.elastic.co/elasticsearch/elasticsearch:6.4.2 container_name: elasticsearch2 [...] ▪ zip/tar.gz ▪ deb ▪ rpm ▪ msi ▪ docker
  10. MAD · NOV 23-24 · 2018 InfluxDB - Time Series

    Database <measurement>[,<tag-key>=<tag-value>...] <field-key>=<field-value>[,<field2-key>=<field2-value>...] [unix-nano-timestamp] cpu,host=serverA,region=us_west value=0.64 payment,device=mobile,product=Notepad,method=credit billed=33,licenses=3i 1434067467100293230 stock,symbol=AAPL bid=127.46,ask=127.48 temperature,machine=unit42,type=assembly external=25,internal=37 1434067467000000000
  11. MAD · NOV 23-24 · 2018 <measurement>[,<tag-key>=<tag-value>...] <field-key>=<field-value>[,<field2-key>=<field2-value>...] [unix-nano-timestamp] cpu,host=serverA,region=us_west

    value=0.64 payment,device=mobile,product=Notepad,method=credit billed=33,licenses=3i 1434067467100293230 stock,symbol=AAPL bid=127.46,ask=127.48 temperature,machine=unit42,type=assembly external=25,internal=37 1434067467000000000 InfluxDB - Time Series Database
  12. MAD · NOV 23-24 · 2018 <measurement>[,<tag-key>=<tag-value>...] <field-key>=<field-value>[,<field2-key>=<field2-value>...] [unix-nano-timestamp] cpu,host=serverA,region=us_west

    value=0.64 payment,device=mobile,product=Notepad,method=credit billed=33,licenses=3i 1434067467100293230 stock,symbol=AAPL bid=127.46,ask=127.48 temperature,machine=unit42,type=assembly external=25,internal=37 1434067467000000000 InfluxDB - Time Series Database
  13. MAD · NOV 23-24 · 2018 <measurement>[,<tag-key>=<tag-value>...] <field-key>=<field-value>[,<field2-key>=<field2-value>...] [unix-nano-timestamp] cpu,host=serverA,region=us_west

    value=0.64 payment,device=mobile,product=Notepad,method=credit billed=33,licenses=3i 1434067467100293230 stock,symbol=AAPL bid=127.46,ask=127.48 temperature,machine=unit42,type=assembly external=25,internal=37 1434067467000000000 InfluxDB - Time Series Database
  14. MAD · NOV 23-24 · 2018 <measurement>[,<tag-key>=<tag-value>...] <field-key>=<field-value>[,<field2-key>=<field2-value>...] [unix-nano-timestamp] cpu,host=serverA,region=us_west

    value=0.64 payment,device=mobile,product=Notepad,method=credit billed=33,licenses=3i 1434067467100293230 stock,symbol=AAPL bid=127.46,ask=127.48 temperature,machine=unit42,type=assembly external=25,internal=37 1434067467000000000 InfluxDB - Time Series Database
  15. MAD · NOV 23-24 · 2018 $ influx -precision rfc3339

    > CREATE DATABASE mydb > SHOW DATABASES name: databases --------------- name _internal mydb > USE mydb Using database mydb InfluxDB - Time Series Database
  16. MAD · NOV 23-24 · 2018 > INSERT cpu,host=serverA,region=us_west value=0.64

    > > SELECT "host", "region", "value" FROM "cpu" name: cpu --------- time host region value 2015-10-21T19:28:07.580664347Z serverA us_west 0.64 > > INSERT temperature,machine=unit42,type=assembly external=25,internal=37 > > SELECT * FROM "temperature" name: temperature ----------------- time external internal machine type 2015-10-21T19:28:08.385013942Z 25 37 unit42 assembly InfluxDB - Time Series Database
  17. MAD · NOV 23-24 · 2018 COUNT() DISTINCT() INTEGRAL() MEAN()

    MEDIAN() MODE() SPREAD() STDDEV() SUM() InfluxDB - InfluxQL functions BOTTOM() FIRST() LAST() MAX() MIN() PERCENTILE() SAMPLE() TOP() ABS() ACOS() ASIN() ATAN() ATAN2() CEIL() COS() CUMULATIVE_SUM() DERIVATIVE() DIFFERENCE() ELAPSED() EXP() FLOOR() HISTOGRAM() LN() LOG() LOG2() LOG10() MOVING_AVERAGE() NON_NEGATIVE_DERIVATIVE() NON_NEGATIVE_DIFFERENCE() POW() ROUND() SIN() SQRT() TAN() CHANDE_MOMENTUM_OSCILLATOR() EXPONENTIAL_MOVING_AVERAGE() DOUBLE_EXPONENTIAL_MOVING_AVERAGE() KAUFMANS_EFFICIENCY_RATIO() KAUFMANS_ADAPTIVE_MOVING_AVERAGE() TRIPLE_EXPONENTIAL_MOVING_AVERAGE() TRIPLE_EXPONENTIAL_DERIVATIVE() RELATIVE_STRENGTH_INDEX()
  18. MAD · NOV 23-24 · 2018 InfluxDB - Features ▪

    Retention policy (DURATION and REPLICATION) ▪ Continuous Queries ▪ Not a full CRUD database but more like a CR-ud
  19. MAD · NOV 23-24 · 2018 Telegraf - Plugins ▪

    More than 100 input plugins ∘ statsd, phpfpm, twemproxy, zipkin, postfix, nginx, tengine, rethinkdb, http, passenger, icinga2, nvidia_smi, kibana, consul, mysql, aerospike, mcrouter, kubernetes, linux_sysctl_fs, kernel, file, udp_listener, cpu, sysstat… ▪ Outputs plugins ∘ amon, amqp, application_insights, azure_monitor, cloudwatch, cratedb, datadog, discard, elasticsearch, file, graphite, graylog, http, influxdb, influxdb_v2, instrumental, kafka, kinesis, librato, mqtt, nats, nsq, opentsdb, prometheus_client, riemann, riemann_legacy, socket_writer, stackdriver, wavefront
  20. MAD · NOV 23-24 · 2018 Telegraf - Plugins ▪

    Processor plugins ∘ converter, enum, override, parser, printer, regex, rename, strings, topk ▪ Aggregator plugins ∘ BasicStats, Histogram, MinMax, ValueCounter
  21. MAD · NOV 23-24 · 2018 Telegraf - Configuration $

    telegraf --input-filter cpu:mem:net:swap --output-filter influxdb:kafka config > telegraf.conf [global_tags] dc = "denver-1" [agent] interval = "10s" # OUTPUTS [[outputs.influxdb]] url = "http://192.168.59.103:8086" # required. database = "telegraf" # required. # INPUTS [[inputs.cpu]] percpu = true totalcpu = false # filter all fields beginning with 'time_' fielddrop = ["time_*"]
  22. MAD · NOV 23-24 · 2018 Kapacitor - Stream dbrp

    "telegraf"."autogen" stream // Select just the cpu measurement from our example database. |from() .measurement('cpu') |alert() .crit(lambda: int("usage_idle") < 70) // Whenever we get an alert write it to a file. .log('/tmp/alerts.log') $ kapacitor define cpu_alert -tick cpu_alert.tick $ kapacitor enable cpu_alert cpu_alert.tick
  23. MAD · NOV 23-24 · 2018 Kapacitor - Stream stream

    |from() .measurement('cpu') // create a new field called 'used' which inverts the idle cpu. |eval(lambda: 100.0 - "usage_idle") .as('used') |groupBy('service', 'datacenter') |window() .period(1m) .every(1m) // calculate the 95th percentile of the used cpu. |percentile('used', 95.0) |eval(lambda: sigma("percentile")) .as('sigma') .keep('percentile', 'sigma') |alert() .id('{{ .Name }}/{{ index .Tags "service" }}/{{ index .Tags "datacenter"}}') .message('{{ .ID }} is {{ .Level }} cpu-95th:{{ index .Fields "percentile" }}') // Compare values to running mean and standard deviation .warn(lambda: "sigma" > 2.5) .crit(lambda: "sigma" > 3.0) .log('/tmp/alerts.log') // Send alerts to slack .slack() .channel('#alerts') // Sends alerts to PagerDuty .pagerDuty()
  24. MAD · NOV 23-24 · 2018 Kapacitor - Batch dbrp

    "telegraf"."autogen" batch |query(''' SELECT mean(usage_idle) FROM "telegraf"."autogen"."cpu" ''') .period(5m) .every(5m) .groupBy(time(1m), 'cpu') |alert() .crit(lambda: "mean" < 70) .log('/tmp/batch_alerts.log')
  25. MAD · NOV 23-24 · 2018 Deploying the TICK stack

    ▪ .deb ▪ .rpm ▪ MacOS ▪ Win .exe ▪ Docker version: '3' services: influxdb: image: "influxdb:latest" networks: tik_net: telegraf: image: "telegraf:latest" networks: tik_net: volumes: - ./etc/telegraf:/etc/telegraf kapacitor: image: "kapacitor:latest" networks: tik_net: volumes: - ./etc/kapacitor:/etc/kapacitor - ./var/log/kapacitor:/var/log/kapacitor - ./home/kapacitor:/home/kapacitor networks: tik_net: driver: bridge
  26. MAD · NOV 23-24 · 2018 Sensu metric check {

    "checks": { "cpu_metrics": { "type": "metric", "command": "metrics-cpu.rb", "subscribers": [ "production" ], "interval": 10, "handler": "debug" } } }
  27. MAD · NOV 23-24 · 2018 Sensu standard check {

    "checks": { "session_count": { "command": "check-graphite-data.rb -s localhost:9001 -t 'movingAverage(lb1.assets_backend.session_current,10)' -w 100 -c 200", "standalone": true, "interval": 30 } } } $ sudo sensu-install -p graphite:0.0.6
  28. MAD · NOV 23-24 · 2018 Sensu handler { "handlers":

    { "mail": { "type": "pipe", "command": "mailx -s 'sensu event' [email protected]", "filters": [ "production", "operations" ] } } }
  29. MAD · NOV 23-24 · 2018 Sensu 2.0 (sensu-go) ▪

    Implemented in Go ∘ sensu-backend ∘ sensu-agent ▪ No need for third-party transport, storage or dashboard ▪ More powerful API ▪ CLI ∘ sensuctl ▪ Built-in StatsD metrics collector ▪ Configuration via YAML ▪ RBAC
  30. MAD · NOV 23-24 · 2018 Configuring checks and handlers

    sensuctl check create check-cpu \ --command 'check-cpu.sh -w 75 -c 90' \ --interval 60 \ --subscriptions linux sensuctl handler create influx-db \ --type pipe \ --command "sensu-influxdb-handler \ --addr 'http://123.4.5.6:8086' \ --db-name 'myDB' \ --username 'foo' \ --password 'bar'"
  31. MAD · NOV 23-24 · 2018 Hooks and filters sensuctl

    hook create nginx-restart \ --command 'sudo systemctl restart nginx' \ --timeout 10 sensuctl filter create hourly \ --action allow \ --statements "event.Check.Occurrences == 1 || event.Check.Occurrences % (3600 / event.Check.Interval) == 0"
  32. MAD · NOV 23-24 · 2018 Assets $ sensuctl asset

    create check_website.tar.gz \ -u http://example.com/check_website.tar.gz \ --sha512 "$(sha512sum check_website.tar.gz | cut -f1 -d ' ')"
  33. MAD · NOV 23-24 · 2018 Deploying Sensu 2.0 $

    docker run -d --name sensu-backend \ -p 2380:2380 -p 3000:3000 -p 8080:8080 -p 8081:8081 \ sensu/sensu:2.0.0-beta.3 sensu-backend start $ docker run -d --name sensu-agent --link sensu-backend \ sensu/sensu:2.0.0-beta.3 sensu-agent start \ --backend-url ws://sensu-backend:8081 \ --subscriptions workstation,docker
  34. MAD · NOV 23-24 · 2018 Prometheus features ▪ Multi-dimensional

    time series model ▪ Pull model (HTTP scraping) ∘ Optional push model (via a push gateway) ▪ Exporters ▪ Node discovery ∘ Static ∘ Service discovery integration
  35. MAD · NOV 23-24 · 2018 Data model metric_name [

    "{" label_name "=" `"` label_value `"` { "," label_name "=" `"` label_value `"` } [ "," ] "}" ] value [ timestamp ] ▪ Counter ▪ Gauge ▪ Histogram ▪ Summary
  36. MAD · NOV 23-24 · 2018 Data model # HELP

    http_requests_total The total number of HTTP requests. # TYPE http_requests_total counter http_requests_total{method="post",code="200"} 1027 1395066363000 http_requests_total{method="post",code="400"} 3 1395066363000 # A histogram, which has a pretty complex representation in the text format: # HELP http_request_duration_seconds A histogram of the request duration. # TYPE http_request_duration_seconds histogram http_request_duration_seconds_bucket{le="0.05"} 24054 http_request_duration_seconds_bucket{le="0.1"} 33444 http_request_duration_seconds_bucket{le="0.2"} 100392 http_request_duration_seconds_bucket{le="0.5"} 129389 http_request_duration_seconds_bucket{le="1"} 133988 http_request_duration_seconds_bucket{le="+Inf"} 144320 http_request_duration_seconds_sum 53423 http_request_duration_seconds_count 144320
  37. MAD · NOV 23-24 · 2018 Queries (PromQL) http_requests_total{environment=~"staging|development",method!="GET"} http_requests_total

    offset 5m http_requests_total{job="prometheus"}[5m] rate(http_requests_total{job="api-server"}[5m]) topk(5, http_requests_total)
  38. MAD · NOV 23-24 · 2018 Configuration global: scrape_interval: 15s

    evaluation_interval: 15s rule_files: - "alert.rules" scrape_configs: - job_name: prometheus static_configs: - targets: ['localhost:9090']
  39. MAD · NOV 23-24 · 2018 Alerting groups: - name:

    example rules: - alert: HighErrorRate expr: job:request_latency_seconds:mean5m{job="myjob"} > 0.5 for: 10m labels: severity: page annotations: summary: High request latency
  40. MAD · NOV 23-24 · 2018 Deploying Prometheus docker run

    -p 9090:9090 -v /tmp/prometheus.yml:/etc/prometheus/prometheus.yml \ prom/prometheus docker run -d --name=grafana --net="host" \ grafana/grafana docker run -d \ --net="host" \ --pid="host" \ -v "/:/host:ro,rslave" \ quay.io/prometheus/node-exporter \ --path.rootfs /host