Upgrade to Pro — share decks privately, control downloads, hide ads and more …

Paranormal Statistics: Computing what doesn't add up.

Paranormal Statistics: Computing what doesn't add up.

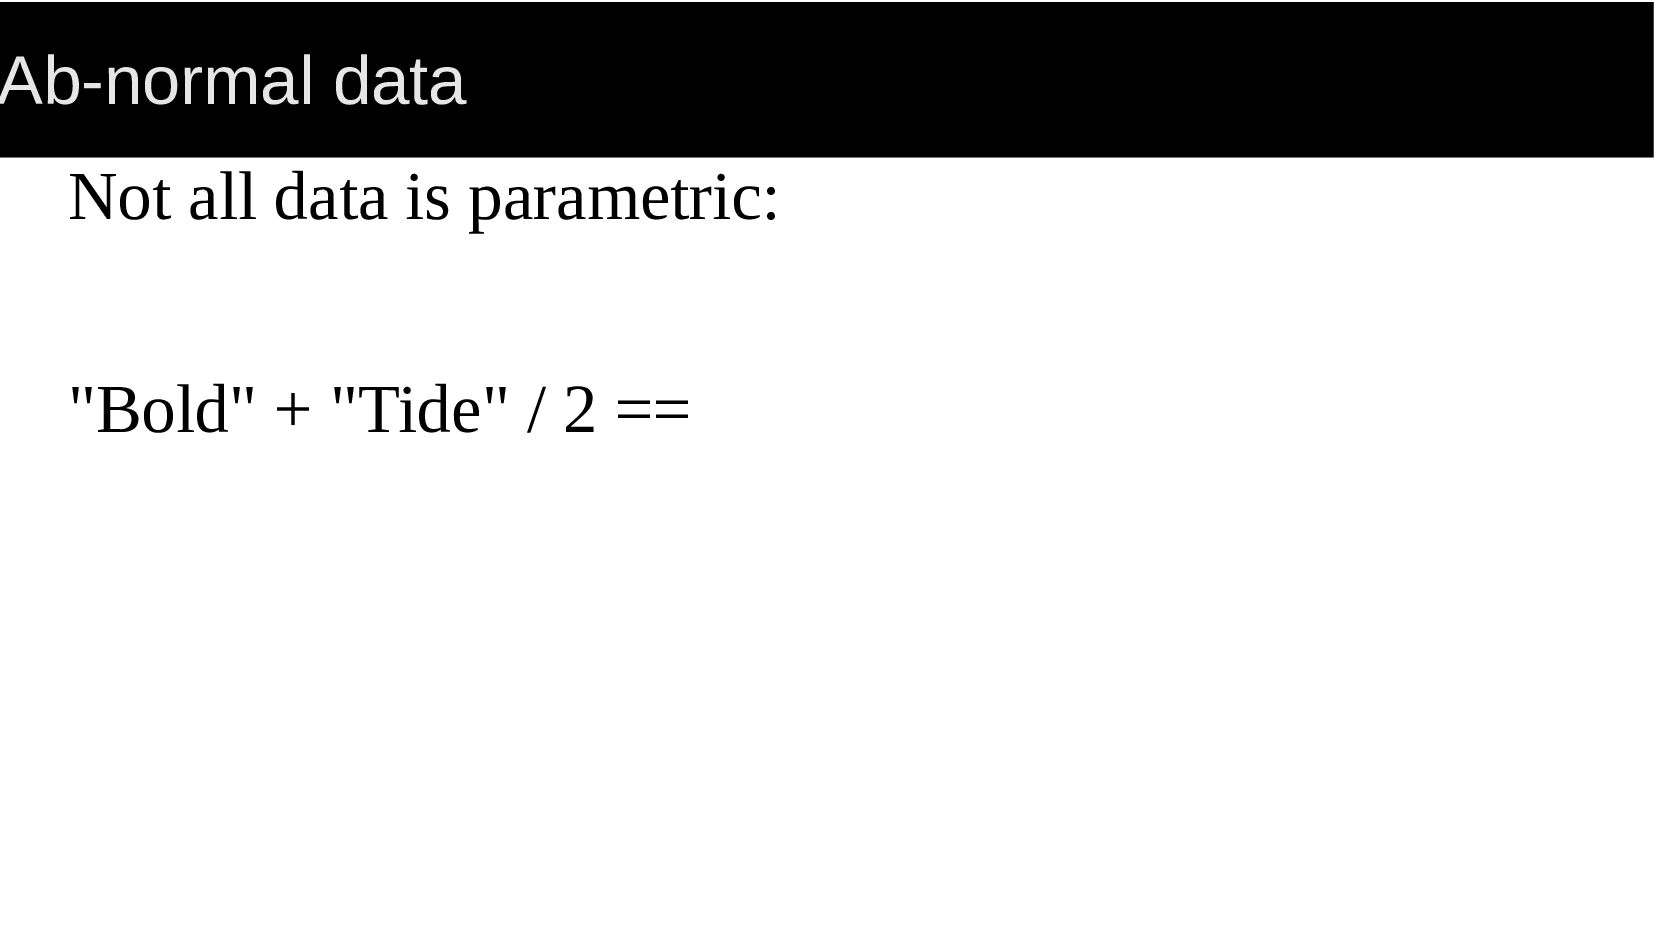
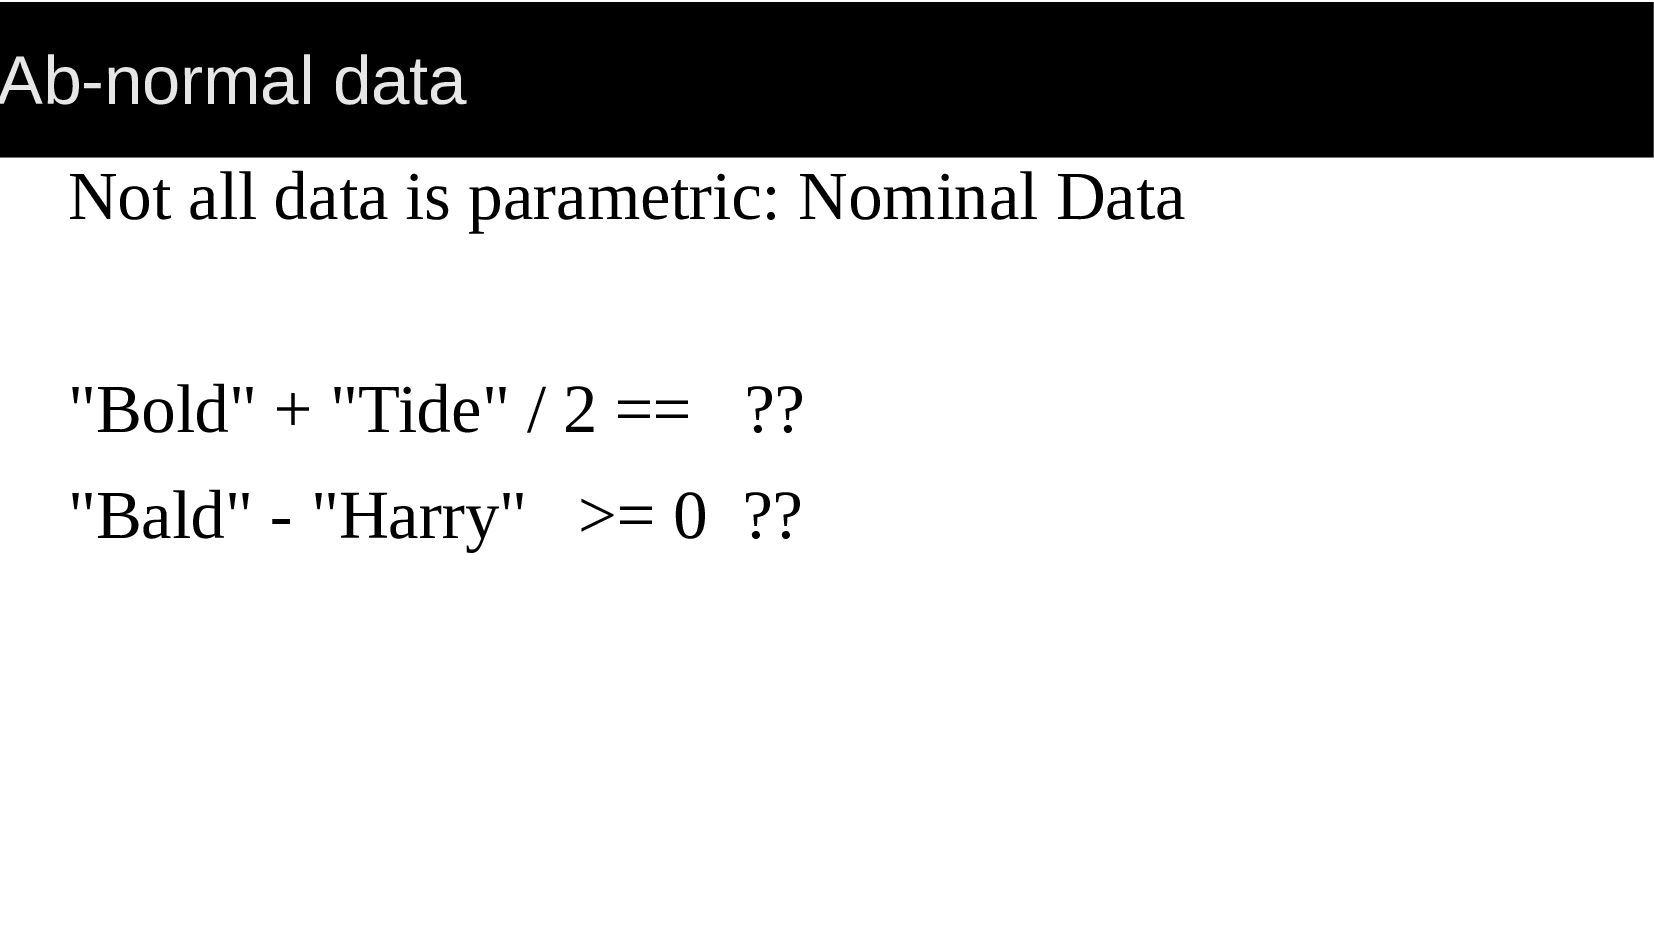
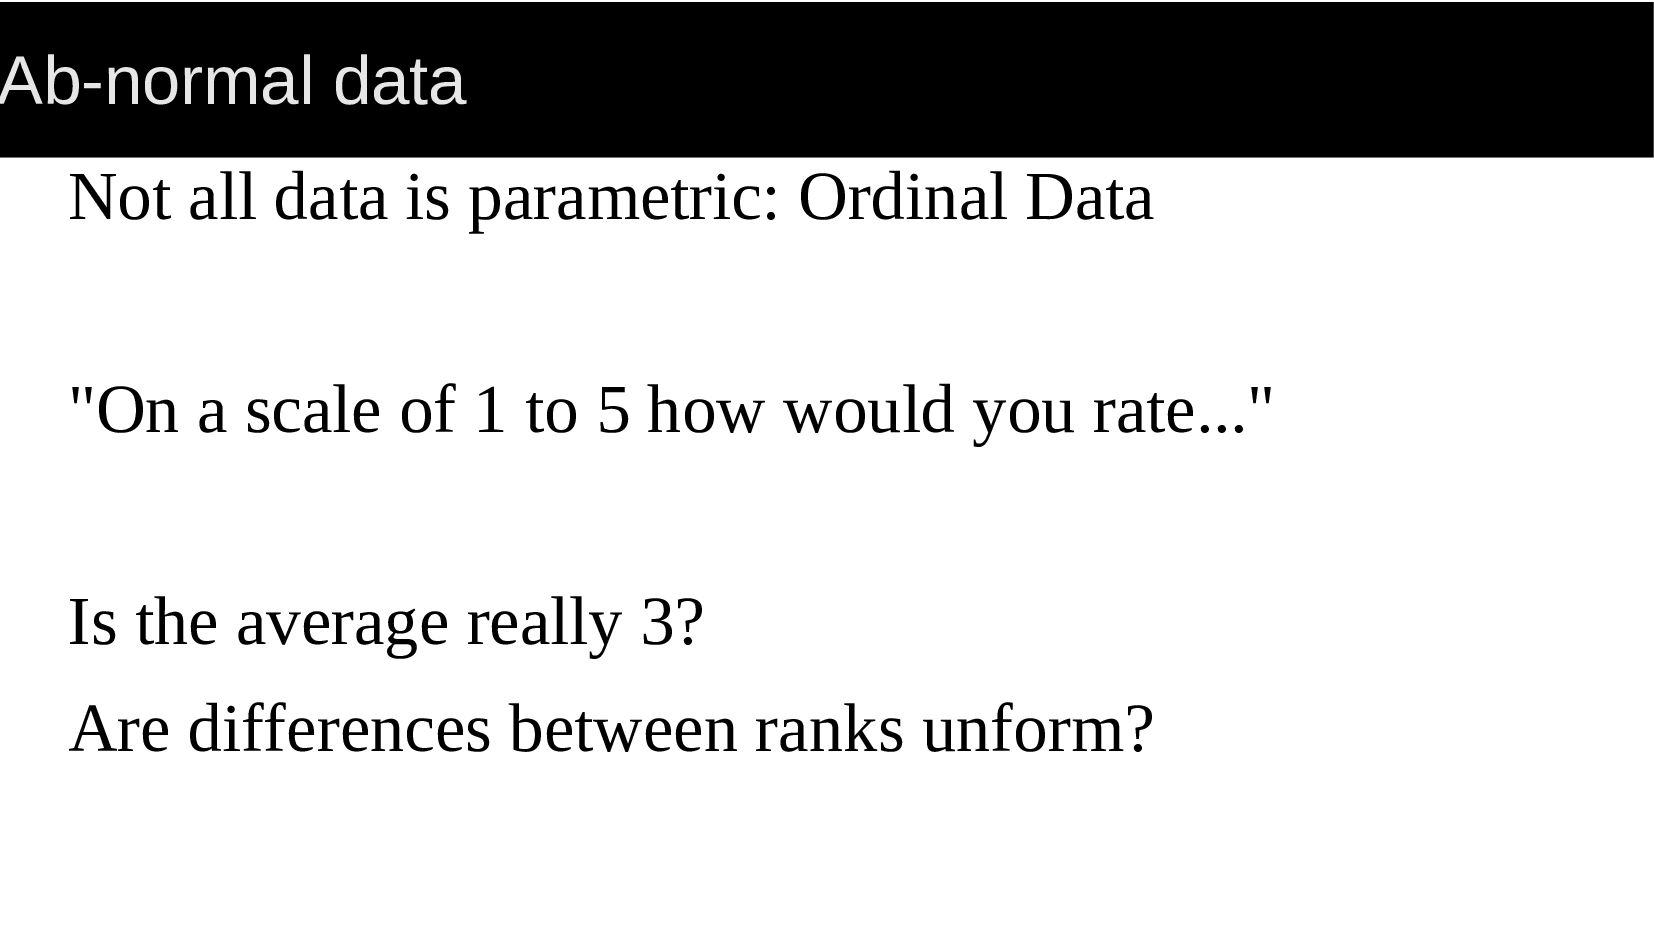
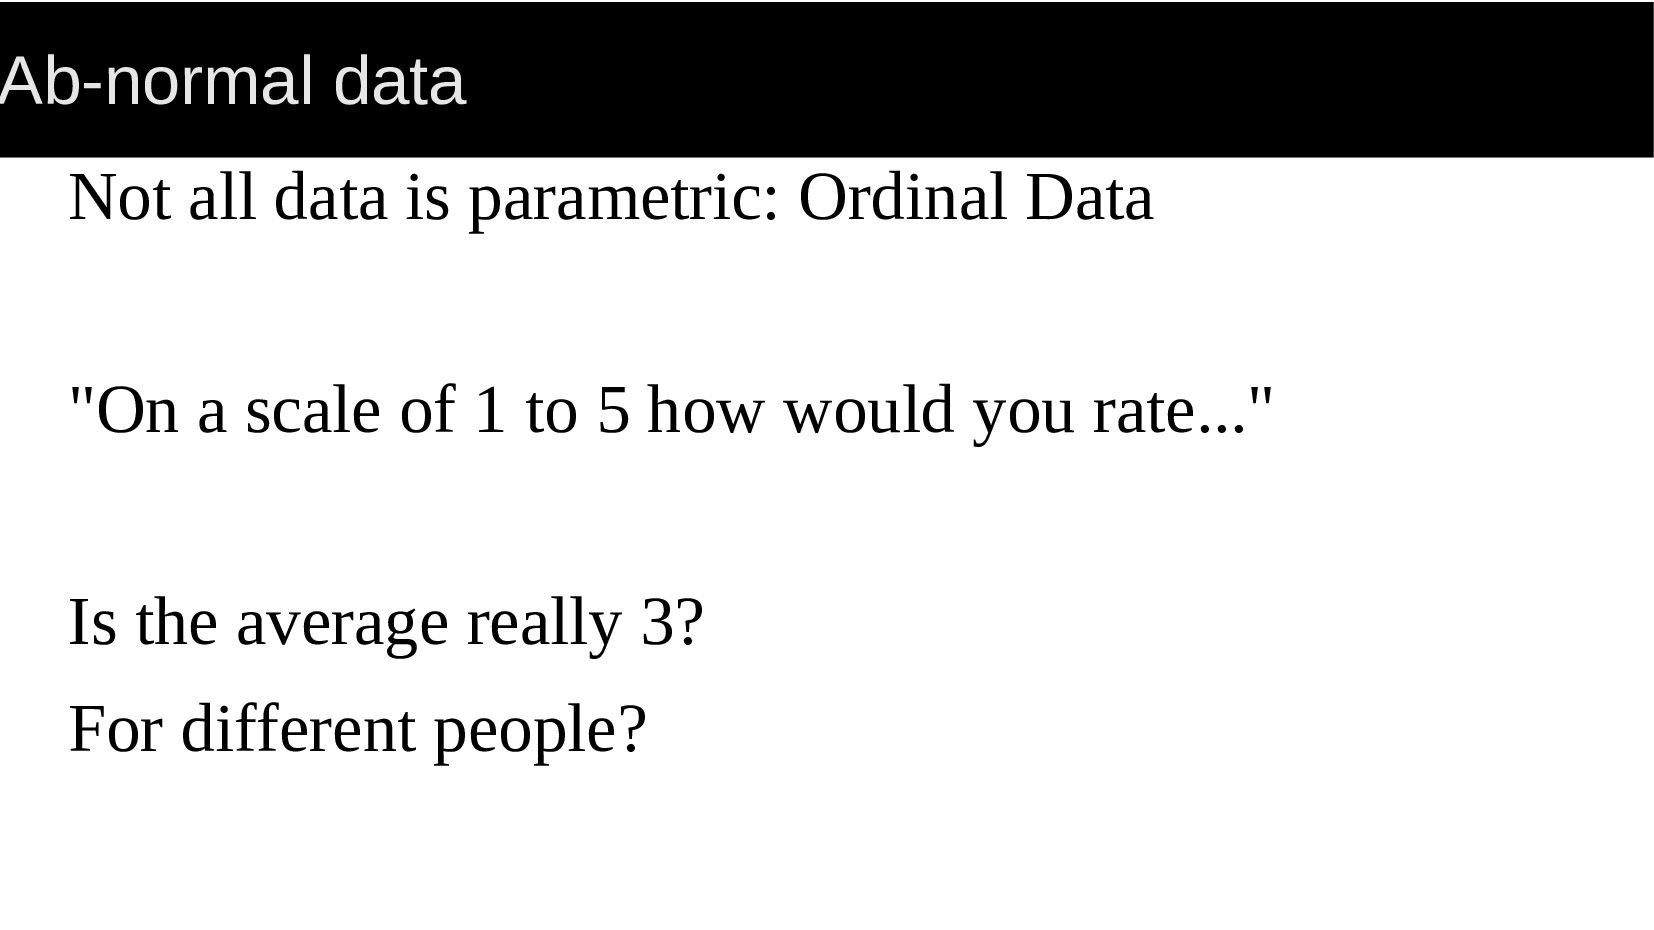
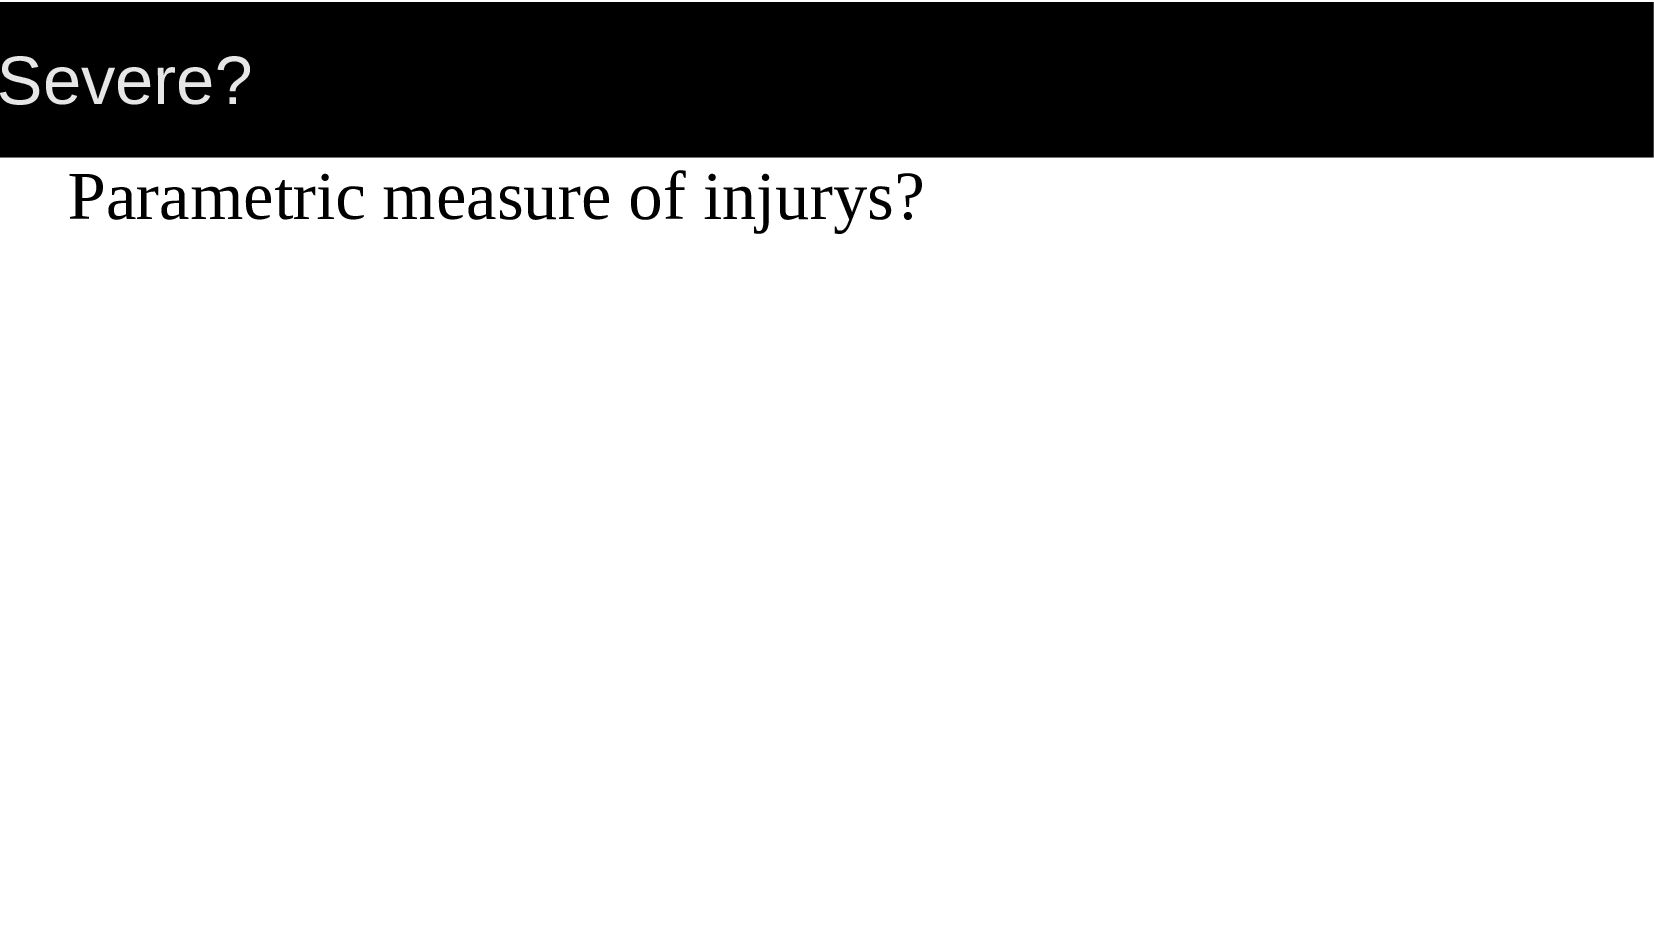
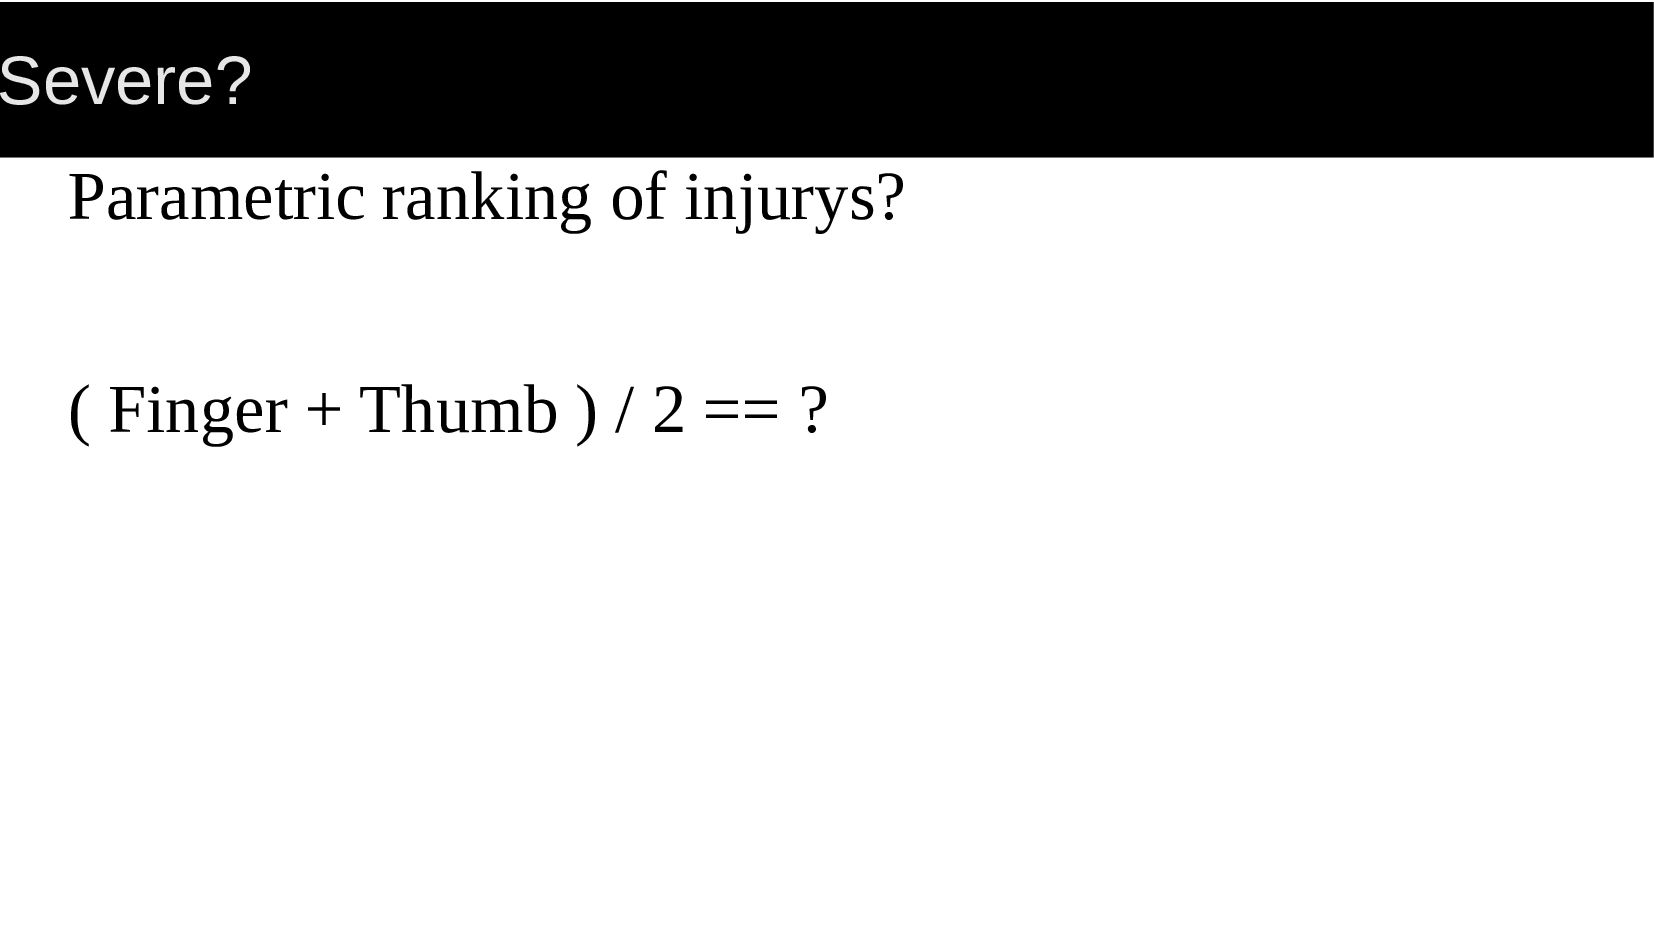
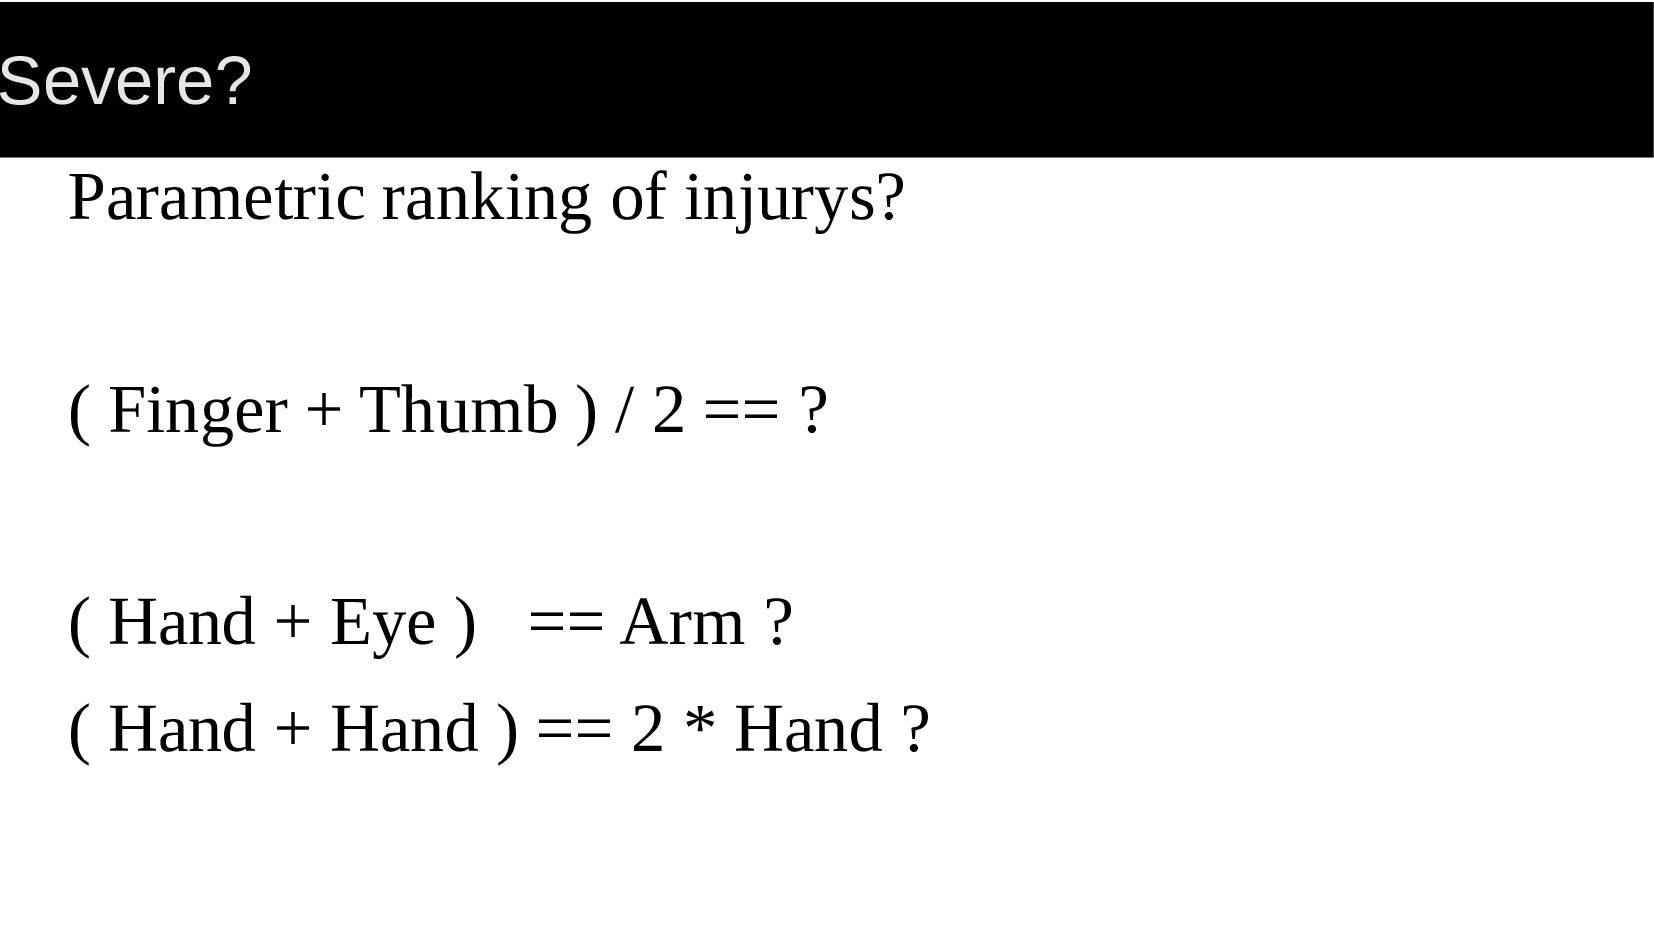
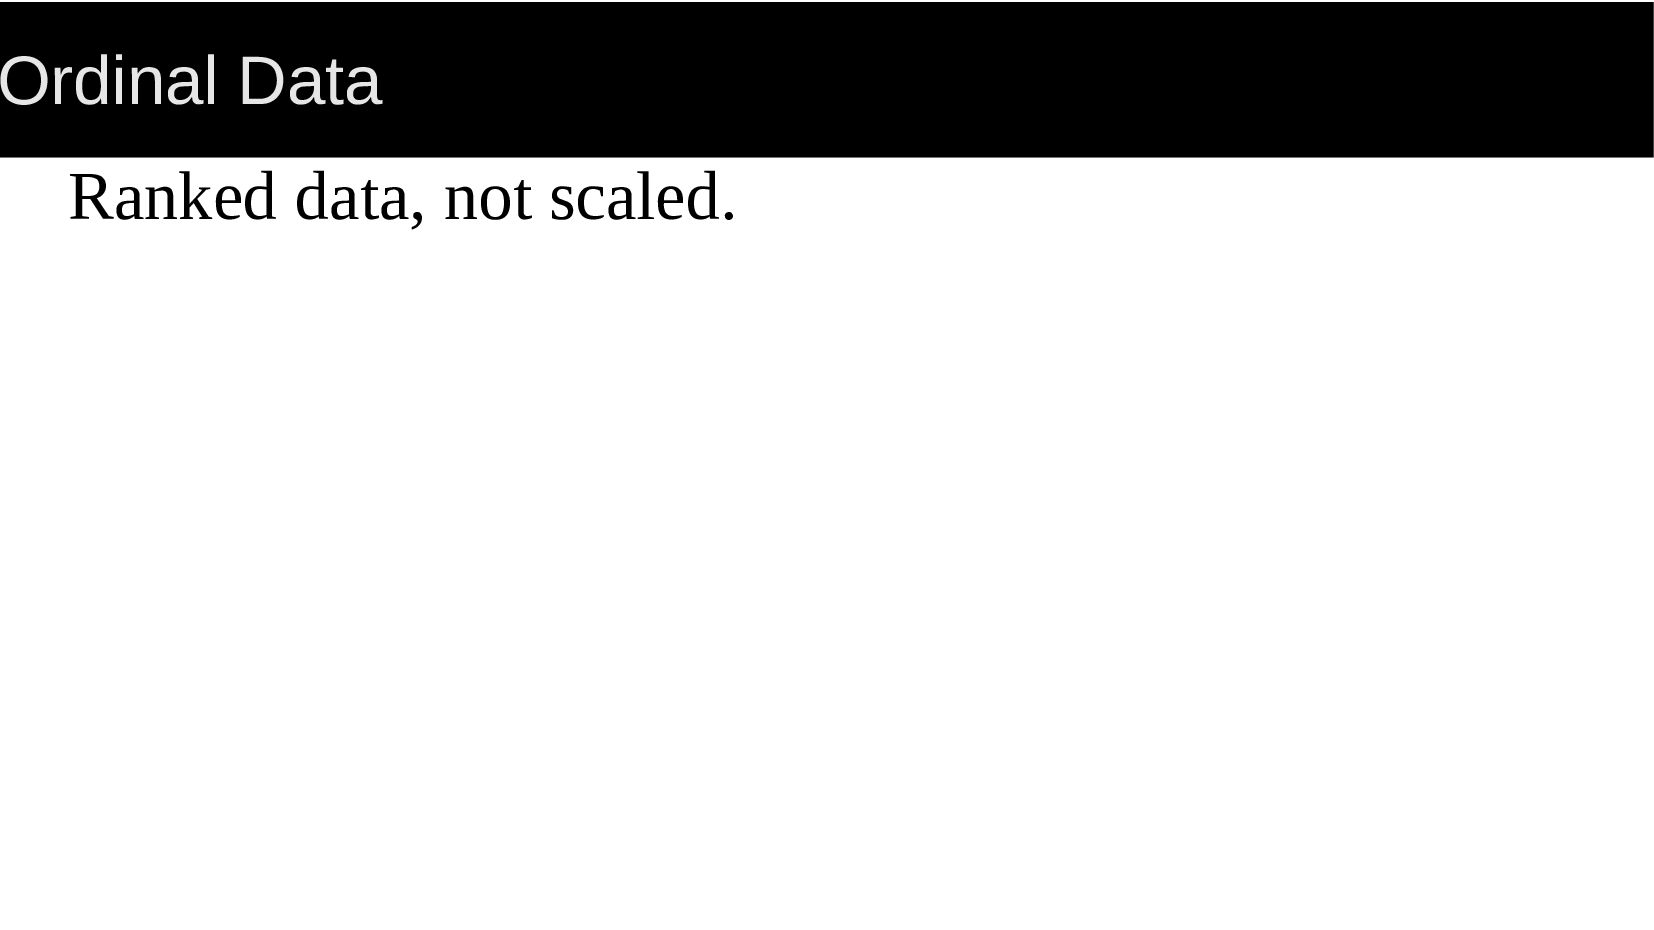
Non-parametric statistical analysis provides a rigorous approach to analyzing non-numeric, non-scalar data such as evaluations or 'buckets' of data. The approach is also designed to handle counts and intervals, thus avoiding several pitfalls of blindly applying a normal or t distribution to right-tailed data. This talk looks at the basics of non-parametric distributions and tests with examples of applicable data.

Steven Lembark

November 03, 2023
Tweet

More Decks by Steven Lembark

Other Decks in Technology

Transcript

  1. Normality We expect data is normal. It's what we are

    trained for. Chi-Squared, F depend on it. It's the guts of ANOVA. Theory guarantees it, sort of.
  2. Ab-normal data Not all data is parametric: Nominal Data "Bold"

    + "Tide" / 2 == ?? "Bald" - "Harry" >= 0 ??
  3. Ab-normal data Not all data is parametric: Ordinal Data "On

    a scale of 1 to 5 how would you rate..." Is the average really 3? Are differences between ranks unform?
  4. Ab-normal data Not all data is parametric: Ordinal Data "On

    a scale of 1 to 5 how would you rate..." Is the average really 3? For different people?
  5. Ab-normal data Not all data is unimodal, symmetric. Bi-modal data

    has higher sample variance. Positive data is skewed.
  6. Power of Positive Thinking Curves all positive. Right tailed. Binomial

    has highest power if sample data is binomial. Result: Smaller n for given Beta.
  7. Kinda normal Approximations work some of the time. Rule: npq

    > 5 for binomial approximation. Goal: Keep mean > 3σ so normal is all positive. Q: How good an approximation? A: It depends...
  8. Life on the edge Binomial: n=20, p=0.1 Normal: µ =

    2, σ = 1.3 Significant negative.
  9. General rule: npq > 5 Small or large p is

    skewed. Six-sigma range should be positive. At that point n > 5 / pq. For p = 0.0013, n = 3582. Sample size around 4000?
  10. When we assume we make... Assuming normal data leaves a

    less robust conclusion. Stronger, less robust: Sensitive to individual datasets. Not reproducable.
  11. Common in Quality Frequency of failures. QC with No-Go guages.

    Variations between batch runs. Customer feedback.
  12. Example: Safety study Q: Are departments equally "safe"? Q: Is

    a new configuration any "safer"? Compare sample populations.
  13. What is "safe"? Fewer reported injurys? What is P( injury

    ) per operation? 0.5? 0.1? A whole lot less?
  14. What is "safe"? Fewer reported injurys? What is P( injury

    ) per operation? 0.5? 0.1? A whole lot less? N(0.01, 0.01) is heavily negative.
  15. Severe? Parametric ranking of injurys? ( Finger + Thumb )

    / 2 == ? ( Hand + Eye ) == Arm ? ( Hand + Hand ) == 2 * Hand ?
  16. Ordinal Data Ranked data, not scaled. Hangnail < Finger Tip

    < Finger < Hand < Arm "Fuzzy Buckets" Have p( accident ) from history.
  17. K-S for safety Rank the injurys on relative scale. Compare

    counts by bucket. Cumulative distribution: accomodates empty cells. minor mis-catagorization.
  18. A good datum is hard to find, You always get

    the other kind. Apologies to Bessie Smith Sliding-scale questions: "How would you rate..." "How well did..." "How likely are you to..."
  19. A good datum is hard to find, You always get

    the other kind. Apologies to Bessie Smith Reproducability: Variable skill. Variable methods. Variable data handling.
  20. A good datum is hard to find, You always get

    the other kind. Apologies to Bessie Smith Big Data: Multiple sources. Multiple populations. Multiple data standards.
  21. Repeatable Analysis Variety of NP tests for "messy" data. Handle

    protocol, sampling variations. Robust conclusions with real data.
  22. Summary Non-parametric data: counts, nominal, ordinal data. Non-parametric analysis avoids

    NID assumptions. Robust analysis of real data. Even the para-normal.