Upgrade to Pro — share decks privately, control downloads, hide ads and more …

IXXI 2015 - Grenoble

IXXI 2015 - Grenoble

Journée IXXI : Signal, image, statistique pour la biologie

Olivier Lézoray

December 08, 2015
Tweet

More Decks by Olivier Lézoray

Other Decks in Research

Transcript

  1. Graph Signal Processing and Applications Olivier L´ ezoray Normandie Universit´

    e, Universit´ e de Caen Normandie, GREYC UMR CNRS 6072 [email protected] https://lezoray.users.greyc.fr
  2. Acknowledgements Collaborators Abderrahim Elmoataz, Professor, Universit´ e de Caen Normandie

    S´ ebastien Bougleux, Associate Professor, Universit´ e de Caen Normandie Pierre Buyssens, Post-Doc, Rennes University Xavier Desquesnes, Associate Professor, Orl´ eans University Moncef Hidane, Associate Professor, INSA Centre Val de Loire Fran¸ cois Lozes, Doctor, Universit´ e de Caen Normandie Vinh-Thong Ta, Associate Professor, Bordeaux National Polytechnic Institute, Matthieu Touttain, Ph.D. Student, Universit´ e de Caen Normandie Funding French National Research Agency (FOGRIMMI ANR-06-MDCA-008, MELASCAN ANR-10-TECS-0018, GRAPHSIP ANR-14-CE27-0001) French Ministry of Higher Education and Research Regional Council of Lower Normandy O. L´ ezoray (University of Caen Normandy) Graph Signal Processing and Applications 2 / 69
  3. 1 Introduction 2 Graphs and difference operators 3 Construction of

    graphs - non locality 4 p-Laplacian nonlocal regularization on graphs Applications in medical imaging 5 Mathematical Morphology and Eikonal equation on graphs O. L´ ezoray (University of Caen Normandy) Graph Signal Processing and Applications 3 / 69
  4. 1 Introduction 2 Graphs and difference operators 3 Construction of

    graphs - non locality 4 p-Laplacian nonlocal regularization on graphs 5 Mathematical Morphology and Eikonal equation on graphs O. L´ ezoray (University of Caen Normandy) Graph Signal Processing and Applications 4 / 69
  5. The data deluge - Graphs everywhere With the data deluge,

    graphs are everywhere: we are witnessing the rise of graphs in Big Data. Graphs occur as a the most natural of representing arbitrary data by modeling the neighborhood properties between these data. O. L´ ezoray (University of Caen Normandy) Graph Signal Processing and Applications 5 / 69
  6. The data deluge - Graphs everywhere With the data deluge,

    graphs are everywhere: we are witnessing the rise of graphs in Big Data. Graphs occur as a the most natural of representing arbitrary data by modeling the neighborhood properties between these data. Images (grid graphs), Image partitions (superpixels graphs) O. L´ ezoray (University of Caen Normandy) Graph Signal Processing and Applications 5 / 69
  7. The data deluge - Graphs everywhere With the data deluge,

    graphs are everywhere: we are witnessing the rise of graphs in Big Data. Graphs occur as a the most natural of representing arbitrary data by modeling the neighborhood properties between these data. Meshes, 3D colored point clouds O. L´ ezoray (University of Caen Normandy) Graph Signal Processing and Applications 5 / 69
  8. The data deluge - Graphs everywhere With the data deluge,

    graphs are everywhere: we are witnessing the rise of graphs in Big Data. Graphs occur as a the most natural of representing arbitrary data by modeling the neighborhood properties between these data. Social Networks: Facebook, LinkedIn O. L´ ezoray (University of Caen Normandy) Graph Signal Processing and Applications 5 / 69
  9. The data deluge - Graphs everywhere With the data deluge,

    graphs are everywhere: we are witnessing the rise of graphs in Big Data. Graphs occur as a the most natural of representing arbitrary data by modeling the neighborhood properties between these data. Internet, Biological Networks O. L´ ezoray (University of Caen Normandy) Graph Signal Processing and Applications 5 / 69
  10. Processing signals on specific Graphs Usual ways to perform operations

    on graphs Graph theory, spectral analysis (for data processing: similarity graphs) Continuous variational methods (for image/signal processing: grid graphs) Actual trends Emergence of a new research field called Graph Signal Processing Graphs: assumed fixed Signals: set of values associated to vertices Aim: development of algorithms that enable to process data that reside on the vertices or edges of a graph: graph signals Problem: how to process general (non Euclidean) graphs with image/signal processing techniques ? There are a lot of recent works that aim at extending image and signal processing tools for the processing of graph signals O. L´ ezoray (University of Caen Normandy) Graph Signal Processing and Applications 6 / 69
  11. Graph Signal processing David I. Shuman, Sunil K. Narang, Pascal

    Frossard, Antonio Ortega, Pierre Vandergheynst, The Emerging Field of Signal Processing on Graphs: Extending High-Dimensional Data Analysis to Networks and Other Irregular Domains. IEEE Signal Process. Mag. 30(3): 83-98 (2013) Challenge Define classical signal processing notions Use them for signal processing tasks: denoising, interpolation, compression, ... Processing graph signals - some examples Signal processing side: graph wavelets Diffusion wavelets (Coifman & Maggioni) Spectral graph wavelets (Hammond, Vandergheynst & Gribonval) Lifting Transforms on graphs (Narang & Ortega, Jansen & al.) Image processing side: graph PDEs Mumford-Shah on graphs (Grady & Alvino) Ginzburg-Landau graph functionals (Van Gennip & Bertozzi) Partial difference Equations (our works) O. L´ ezoray (University of Caen Normandy) Graph Signal Processing and Applications 7 / 69
  12. Partial difference Equations on graphs Our line of research Our

    goal is to provide methods that adapt on graphs well-known PDE variational formulations under a functional analysis point of view. To do this we use Partial difference Equations (PdE) that mimic PDEs in domains having a graph structure. Motivations Problems involving PDEs can be reduced to ones of a very much simpler structure by replacing the differentials by difference equations on graphs. R. Courant, K. Friedrichs, H. Lewy, On the partial difference equations of mathematical physics, Math. Ann. 100 (1928) 32-74. Instead of discretizing, we want equivalents on graphs of differential operators The analogue of PDEs on graphs is obtained by simply replacing the continuous operators by their discrete equivalent PdEs mimic PDEs in domains having a graph structure. O. L´ ezoray (University of Caen Normandy) Graph Signal Processing and Applications 8 / 69
  13. 1 Introduction 2 Graphs and difference operators 3 Construction of

    graphs - non locality 4 p-Laplacian nonlocal regularization on graphs 5 Mathematical Morphology and Eikonal equation on graphs O. L´ ezoray (University of Caen Normandy) Graph Signal Processing and Applications 9 / 69
  14. Weighted graphs Basics A weighted graph G = (V, E,

    w) consists in a finite set V = {v1, . . . , vN } of N vertices O. L´ ezoray (University of Caen Normandy) Graph Signal Processing and Applications 10 / 69
  15. Weighted graphs Basics A weighted graph G = (V, E,

    w) consists in a finite set V = {v1, . . . , vN } of N vertices and a finite set E = {e1, . . . , eN } ⊂ V × V of N weighted edges. O. L´ ezoray (University of Caen Normandy) Graph Signal Processing and Applications 10 / 69
  16. Weighted graphs Basics A weighted graph G = (V, E,

    w) consists in a finite set V = {v1, . . . , vN } of N vertices and a finite set E = {e1, . . . , eN } ⊂ V × V of N weighted edges. eij = (vi , vj ) is the edge of E that connects vertices vi and vj of V. Its weight, denoted by wij = w(vi , vj ), represents the similarity between its vertices. Similarities are usually computed by using a positive symmetric function w : V × V → R+ satisfying w(vi , vj ) = 0 if (vi , vj ) / ∈ E. w w w w w w w w w w w O. L´ ezoray (University of Caen Normandy) Graph Signal Processing and Applications 10 / 69
  17. Weighted graphs Basics A weighted graph G = (V, E,

    w) consists in a finite set V = {v1, . . . , vN } of N vertices and a finite set E = {e1, . . . , eN } ⊂ V × V of N weighted edges. eij = (vi , vj ) is the edge of E that connects vertices vi and vj of V. Its weight, denoted by wij = w(vi , vj ), represents the similarity between its vertices. Similarities are usually computed by using a positive symmetric function w : V × V → R+ satisfying w(vi , vj ) = 0 if (vi , vj ) / ∈ E. The notation vi ∼ vj is used to denote two adjacent vertices. O. L´ ezoray (University of Caen Normandy) Graph Signal Processing and Applications 10 / 69
  18. Space of functions on Graphs H(V) and H(E) are the

    Hilbert spaces of graph signals: real-valued functions defined on the vertices or the edges of a graph G. A function f : V → R of H(V) assigns a real value xi = f (vi ) to vi ∈ V. By analogy with functional analysis on continuous spaces, the integral of a function f ∈ H(V), over the set of vertices V, is defined as V f = V f Both spaces H(V) and H(E) are endowed with the usual inner products: f , h H(V) = vi ∈V f (vi )h(vi ), where f , h : V → R F, H H(E) = vi ∈V vj ∼vi F(vi , vj )H(vi , vj ) where F, H : E → R O. L´ ezoray (University of Caen Normandy) Graph Signal Processing and Applications 11 / 69
  19. Difference operators on weighted graphs · Discrete analogue on graphs

    of classical continuous differential geometry. The directional derivative (or edge derivative) of f , at a vertex vi ∈ V, along an edge eij = (vi , vj ), is defined as ∂f ∂eij vi = ∂vj f (vi ) = (dw f )(vi , vj ) The difference operator of f , dw : H(V) → H(E), is defined on an edge eij = (vi , vj ) ∈ E by: (dw f )(eij ) = (dw f )(vi , vj ) = w(vi , vj )1/2(f (vj ) − f (vi )) . (1) The adjoint of the difference operator, d∗ w : H(E) → H(V), is a linear operator defined by dw f , H H(E) = f , d∗ w H H(V) and expressed by (d∗ w H)(vi ) = −divw (H)(vi ) = vj ∼vi w(vi , vj )1/2(H(vj , vi ) − H(vi , vj )) . (2) M. Hein, J.-Y. Audibert, U. Von Luxburg, From Graphs to Manifolds - Weak and Strong Pointwise Consistency of Graph Laplacians. COLT 2005: 470-485 D. Zhou, J. Huang, B. Schlkopf, Learning from labeled and unlabeled data on a directed graph. ICML 2005: 1036-1043 O. L´ ezoray (University of Caen Normandy) Graph Signal Processing and Applications 12 / 69
  20. Weighted gradient operator The weighted gradient operator of a function

    f ∈ H(V), at a vertex vi ∈ V, is the vector operator defined by (∇w f)(vi ) = [∂vj f (vi ) : vj ∼ vi ]T = [∂v1 f (vi ), . . . , ∂vk f (vi )]T , ∀(vi , vj ) ∈ E. (3) The Lp norm of this vector represents the local variation of the function f at a vertex of the graph (It is a semi-norm for p ≥ 1): (∇w f)(vi ) p = vj ∼vi wp/2 ij f (vj )−f (vi ) p 1/p . (4) Remark: Since vertices can have different numbers of neighbors, |vj ∼ vi | varies. Its is better to define the gradient as (∇w f)(vi ) = [(dw f )(vi , vj ) : ∀vj ∈ V]T . (5) O. L´ ezoray (University of Caen Normandy) Graph Signal Processing and Applications 13 / 69
  21. Isotropic p-Laplacian The weighted p-Laplace isotropic operator of a function

    f ∈ H(V), noted ∆i w,p : H(V) → H(V), is defined by: (∆i w,p f )(vi ) = 1 2 d∗ w ( (∇w f)(vi ) p−2 2 (dw f )(vi , vj )) . (6) The isotropic p-Laplace operator of f ∈ H(V), at a vertex vi ∈ V, can be computed by: (∆i w,p f )(vi ) = 1 2 vj ∼vi (γi w,p f )(vi , vj )(f (vi ) − f (vj )) , (7) with (γi w,p f )(vi , vj ) = wij (∇w f)(vj ) p−2 2 + (∇w f)(vi ) p−2 2 . (8) The p-Laplace isotropic operator is nonlinear, except for p = 2 (corresponds to the combinatorial Laplacian). For p = 1, it corresponds to the weighted curvature of the function f on the graph. A. Elmoataz, O. Lezoray, S. Bougleux, Nonlocal Discrete Regularization on Weighted Graphs: a framework for Image and Manifold Processing, IEEE transactions on Image Processing, Vol. 17(7), pp. 1047-1060, 2008. O. L´ ezoray (University of Caen Normandy) Graph Signal Processing and Applications 14 / 69
  22. Anisotropic p-Laplacian The weighted p-Laplace anisotropic operator of a function

    f ∈ H(V), noted ∆a w,p : H(V) → H(V), is defined by: (∆a w,p f )(vi ) = 1 2 d∗ w (|(dw f )(vi , vj )|p−2(dw f )(vi , vj )) . (9) The anisotropic p-Laplace operator of f ∈ H(V), at a vertex vi ∈ V, can be computed by: (∆a w,p f )(vi ) = vj ∼vi (γa w,p f )(vi , vj )(f (vi ) − f (vj )) . (10) with (γa w,p f )(vi , vj ) = wp/2 ij |f (vi ) − f (vj )|p−2 . (11) O. Lezoray, V.T. Ta, A. Elmoataz, Partial differences as tools for filtering data on graphs, Pattern Recognition Letters, Vol. 31(14), pp. 2201-2213, 2010. O. L´ ezoray (University of Caen Normandy) Graph Signal Processing and Applications 15 / 69
  23. 1 Introduction 2 Graphs and difference operators 3 Construction of

    graphs - non locality 4 p-Laplacian nonlocal regularization on graphs 5 Mathematical Morphology and Eikonal equation on graphs O. L´ ezoray (University of Caen Normandy) Graph Signal Processing and Applications 16 / 69
  24. Constructing graphs Any discrete domain can be modeled by a

    weighted graph where each data point is represented by a vertex vi ∈ V. Unorganized data An unorganized set of points V ⊂ Rn can be seen as a graph signal f 0 : V → Rm. Set of edges defined by similarity relationships between feature vectors. Typical graphs: k-nearest neighbors graphs and -neighborhood graphs. Organized data (Euclidean domains) Typical cases of organized data are signals, gray-scale or color images (in 2D or 3D). Edges defined by spatial relationships. Graph signal is f 0 : V ⊂ Zn → Rm. Typical graphs: pixel or region graphs. O. L´ ezoray, L. Grady, Graph theory concepts and definitions used in image processing and analysis, In Image Processing and Analysing With Graphs: Theory and Practice, Editors: O. L´ ezoray and L. Grady, Publisher: CRC Press / Taylor and Francis, Series: Digital Imaging and Computer Vision, pp. 1-24, 2012. O. L´ ezoray (University of Caen Normandy) Graph Signal Processing and Applications 17 / 69
  25. Weighting graphs For an initial function f 0 : V

    → Rm, similarity relationship between data can be incorporated within edges weights according to a measure of similarity g : E → [0, 1] with w(eij ) = g(eij ), ∀eij ∈ E. Each vertex vi is associated with a feature vector Ff0 τ : V → Rm×q where q corresponds to this vector size: Ff0 τ (vi ) = f 0(vj ) : vj ∈ Nτ (vi ) ∪ {vi } T (12) with Nτ (vi ) = vj ∈ V \ {vi } : µ(vi , vj ) ≤ τ . For an edge eij and a distance measure ρ : Rm×q×Rm×q → R associated to Ff0 τ , we can have: g1 (eij ) =1 (unweighted case) , g2 (eij ) = exp −ρ Ff0 τ (vi ), Ff0 τ (vj ) 2/σ2 with σ > 0 , g3 (eij ) =1/ 1 + ρ Ff0 τ (vi ), Ff0 τ (vj ) (13) O. L´ ezoray (University of Caen Normandy) Graph Signal Processing and Applications 18 / 69
  26. Graph topology Digital Image 8-neighborhood : 3 × 3 24-neighborhood

    : 5 × 5 Local: a value is associ- ated to vertices
  27. Graph topology Digital Image 8-neighborhood : 3 × 3 24-neighborhood

    : 5 × 5 Local: a value is associ- ated to vertices Nonlocal: a patch (vector of values in a given neigh- borhood) is associated to vertices. O. L´ ezoray (University of Caen Normandy) Graph Signal Processing and Applications 19 / 69
  28. With Graphs With Graphs Nonlocal behavior is directly expressed by

    the graph topology. Patches are used to measure similarity between vertices. Consequences Nonlocal processing of images becomes local processing on similarity graphs. Our difference operators on graphs naturally enable local and nonlocal configurations (with the weight function and the graph topology) O. L´ ezoray (University of Caen Normandy) Graph Signal Processing and Applications 20 / 69
  29. 1 Introduction 2 Graphs and difference operators 3 Construction of

    graphs - non locality 4 p-Laplacian nonlocal regularization on graphs Applications in medical imaging 5 Mathematical Morphology and Eikonal equation on graphs O. L´ ezoray (University of Caen Normandy) Graph Signal Processing and Applications 21 / 69
  30. p-Laplacian nonlocal regularization on graphs Let f 0 : V

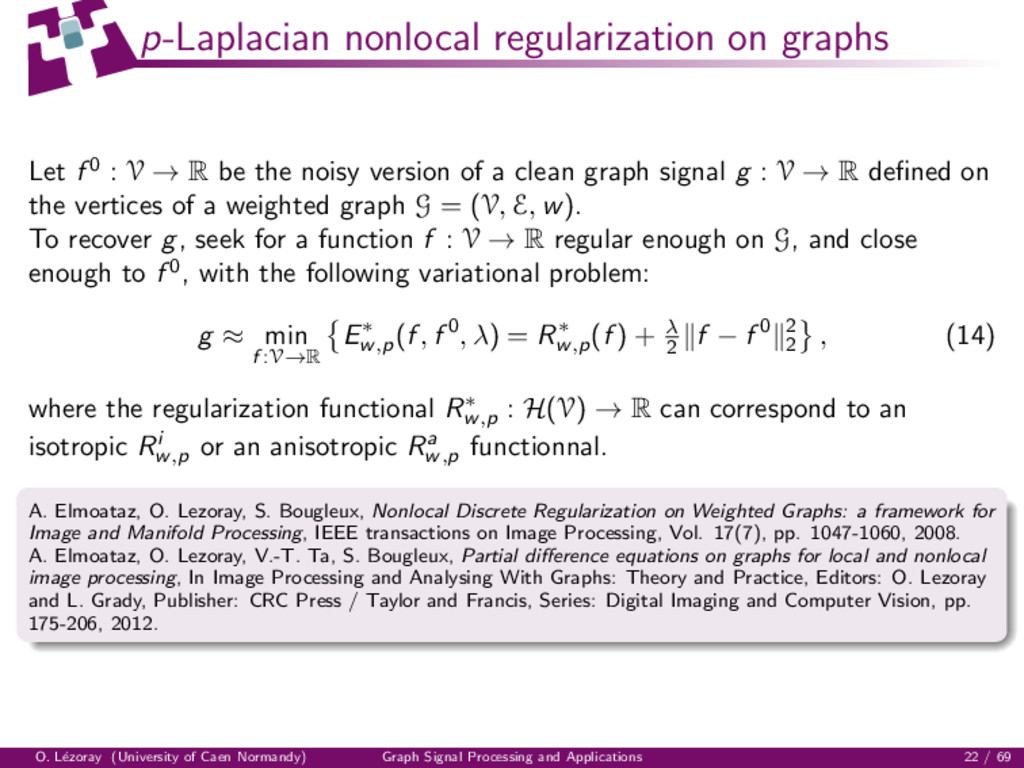
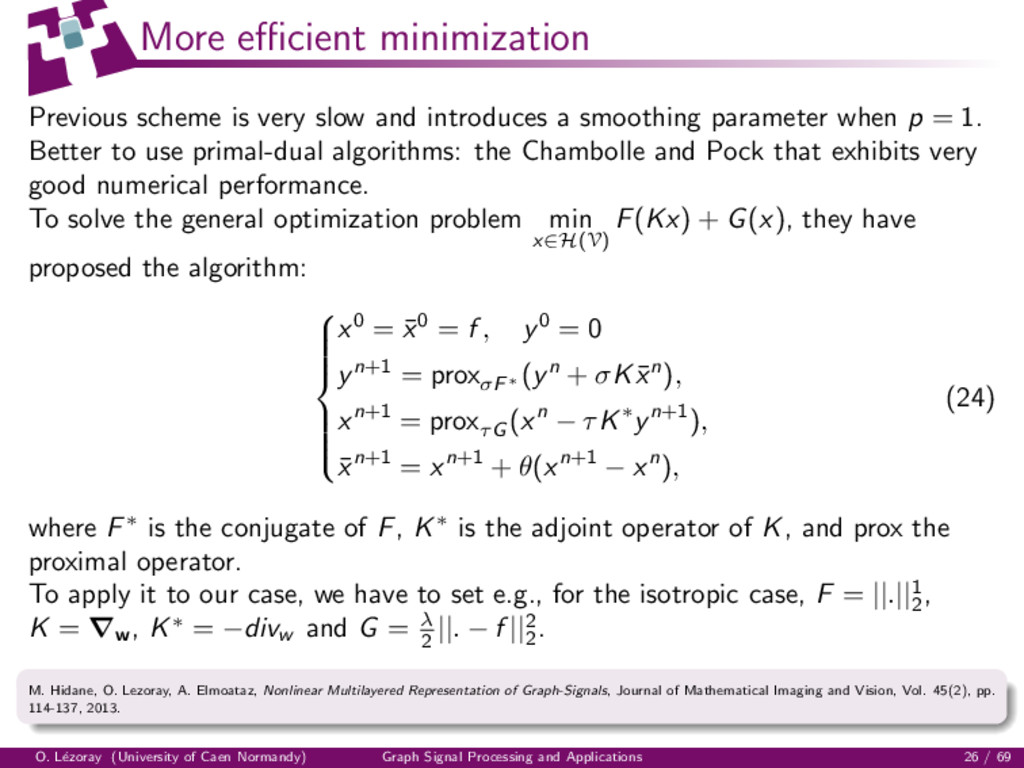
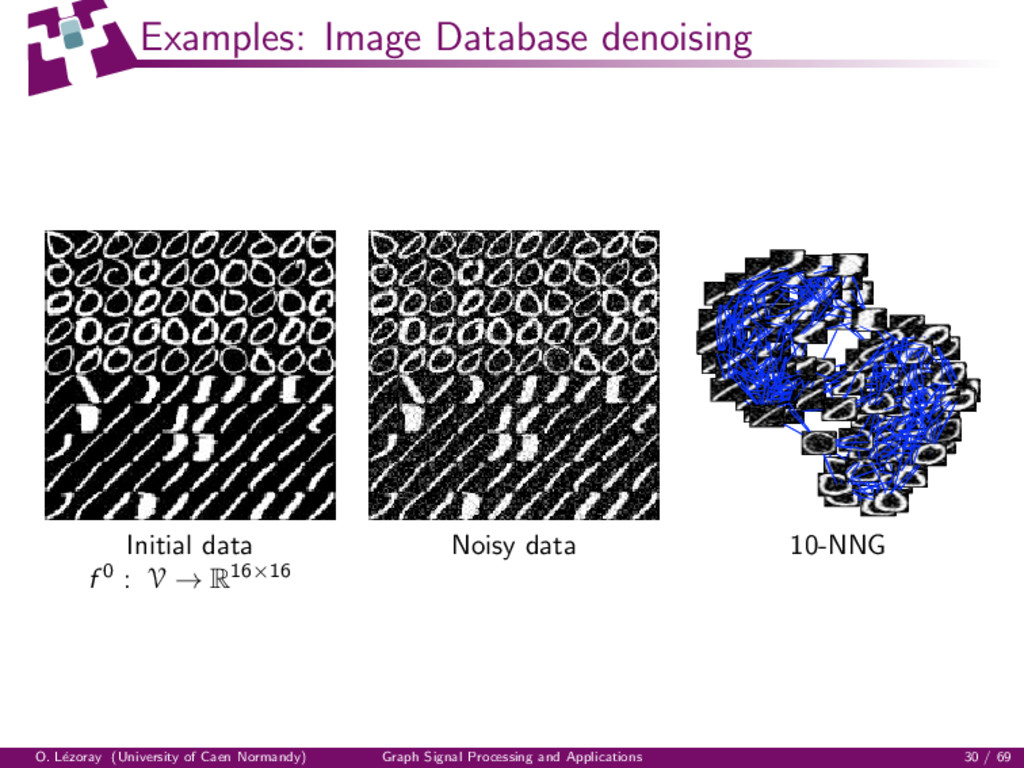
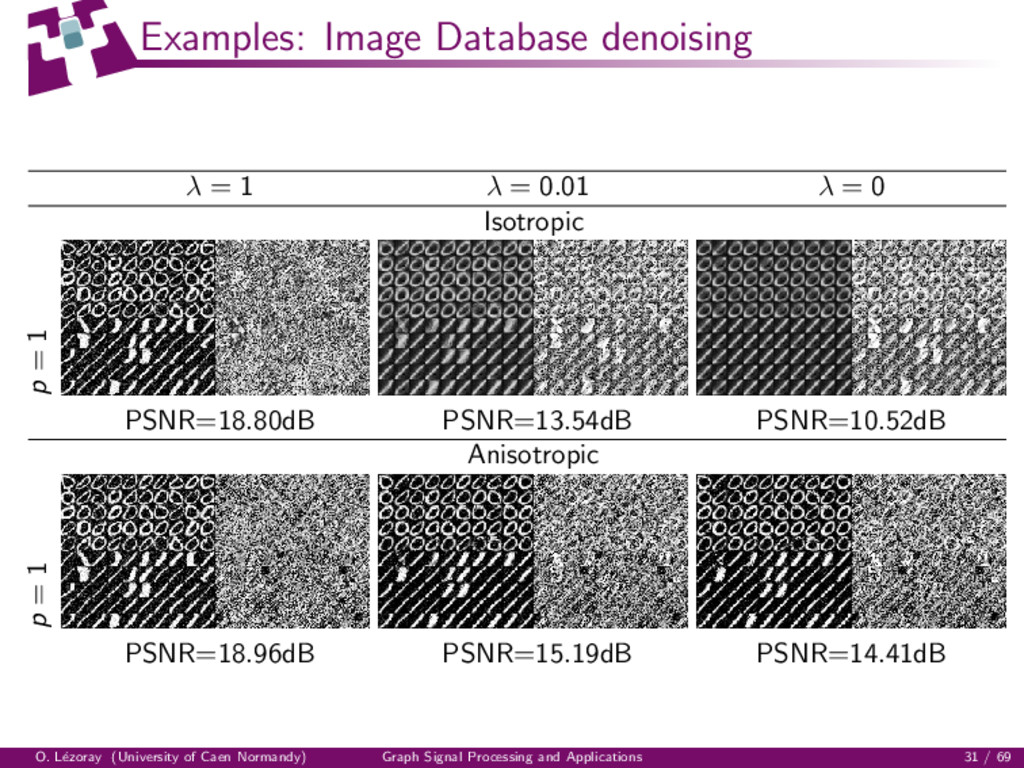
    → R be the noisy version of a clean graph signal g : V → R defined on the vertices of a weighted graph G = (V, E, w). To recover g, seek for a function f : V → R regular enough on G, and close enough to f 0, with the following variational problem: g ≈ min f :V→R E∗ w,p (f , f 0, λ) = R∗ w,p (f ) + λ 2 f − f 0 2 2 , (14) where the regularization functional R∗ w,p : H(V) → R can correspond to an isotropic Ri w,p or an anisotropic Ra w,p functionnal. A. Elmoataz, O. Lezoray, S. Bougleux, Nonlocal Discrete Regularization on Weighted Graphs: a framework for Image and Manifold Processing, IEEE transactions on Image Processing, Vol. 17(7), pp. 1047-1060, 2008. A. Elmoataz, O. Lezoray, V.-T. Ta, S. Bougleux, Partial difference equations on graphs for local and nonlocal image processing, In Image Processing and Analysing With Graphs: Theory and Practice, Editors: O. Lezoray and L. Grady, Publisher: CRC Press / Taylor and Francis, Series: Digital Imaging and Computer Vision, pp. 175-206, 2012. O. L´ ezoray (University of Caen Normandy) Graph Signal Processing and Applications 22 / 69
  31. Isotropic and anisotropic regularization terms The isotropic regularization functionnal Ri

    w,p is defined by the L2 norm of the gradient and is the discrete p-Dirichlet form of the function f ∈ H(V): Ri w,p (f ) = 1 p vi ∈V (∇w f)(vi ) p 2 = 1 p f , ∆i w,p f H(V) = 1 p vi ∈V   vj ∼vi wij (f (vj ) − f (vi ))2   p 2 . (15) The anisotropic regularization functionnal Ra w,p is defined by the Lp norm of the gradient: Ra w,p (f ) = 1 p vi ∈V (∇w f)(vi ) p p = 1 p f , ∆a w,p f H(V) = 1 p vi ∈V vj ∼vi wp/2 ij |f (vj ) − f (vi )|p . (16) When p ≥ 1, the energy E∗ w,p is a convex functional of functions of H(V). O. L´ ezoray (University of Caen Normandy) Graph Signal Processing and Applications 23 / 69
  32. Isotropic/Anisotropic diffusion processes To get the solution of the minimizer,

    we consider the following system of equations: ∂E∗ w,p (f , f 0, λ) ∂f (vi ) = 0, ∀vi ∈ V (17) which is rewritten as: ∂R∗ w,p (f ) ∂f (vi ) + λ(f (vi ) − f 0(vi )) = 0, ∀vi ∈ V. (18) Moreover, we can prove that ∂Ri w,p (f ) ∂f (vi ) = 2(∆i w,p f )(vi ) and ∂Ra w,p (f ) ∂f (vi ) = (∆a w,p f )(vi ) . (19) The system of equations is then rewritten as  λ + vj ∼vi (γ∗ w,p f )(vi , vj )   f (vi ) − vj ∼vi (γ∗ w,p f )(vi , vj )f (vj ) = λf 0(vi ). (20) O. L´ ezoray (University of Caen Normandy) Graph Signal Processing and Applications 24 / 69
  33. Isotropic/Anisotropic diffusion processes We can use the linearized Gauss-Jacobi iterative

    method to solve the previous systems. Let n be an iteration step, and let f (n) be the solution at the step n. Then, the method is given by the following algorithm:        f (0) = f 0 f (n+1)(vi ) = λf 0(vi ) + vj ∼vi (γ∗ w,p f (n))(vi , vj )f (n)(vj ) λ + vj ∼vi (γ∗ w,p f (n))(vi , vj ) , ∀vi ∈ V. (21) with (γi w,p f )(vi , vj ) = wij (∇w f)(vj ) p−2 2 + (∇w f)(vi ) p−2 2 , (22) and (γa w,p f )(vi , vj ) = wp/2 ij |f (vi ) − f (vj )|p−2 . (23) It describes a family of discrete diffusion processes, which is parameterized by the structure of the graph (topology and weight function), the parameter p, and the parameter λ. λ w Graph p = 1 p = 2 p ∈]0, 1[ 0 exp() semi-local Ours Bilateral Our 0 exp() nonlocal Ours NLMeans Our = 0 constant local TV Digital L2 Digital Ours = 0 any nonlocal Ours Ours Ours O. L´ ezoray (University of Caen Normandy) Graph Signal Processing and Applications 25 / 69
  34. More efficient minimization Previous scheme is very slow and introduces

    a smoothing parameter when p = 1. Better to use primal-dual algorithms: the Chambolle and Pock that exhibits very good numerical performance. To solve the general optimization problem min x∈H(V) F(Kx) + G(x), they have proposed the algorithm:            x0 = ¯ x0 = f , y0 = 0 yn+1 = proxσF∗ (yn + σK ¯ xn), xn+1 = proxτG (xn − τK∗yn+1), ¯ xn+1 = xn+1 + θ(xn+1 − xn), (24) where F∗ is the conjugate of F, K∗ is the adjoint operator of K, and prox the proximal operator. To apply it to our case, we have to set e.g., for the isotropic case, F = ||.||1 2 , K = ∇w , K∗ = −divw and G = λ 2 ||. − f ||2 2 . M. Hidane, O. Lezoray, A. Elmoataz, Nonlinear Multilayered Representation of Graph-Signals, Journal of Mathematical Imaging and Vision, Vol. 45(2), pp. 114-137, 2013. O. L´ ezoray (University of Caen Normandy) Graph Signal Processing and Applications 26 / 69
  35. Examples: Image denoising Original image Noisy image (Gaussian noise with

    σ = 15) f 0 : V → R3 PSNR=29.38dB O. L´ ezoray (University of Caen Normandy) Graph Signal Processing and Applications 27 / 69
  36. Examples: Image denoising Isotropic G1 , Ff0 0 = f

    0 Isotropic G7 , Ff0 3 Anisotropic G7 , Ff0 3 p = 2 PSNR=28.52db PSNR=31.79dB PSNR=31.79dB p = 1 PSNR=31.25dB PSNR=34.74dB PSNR=31.81dB O. L´ ezoray (University of Caen Normandy) Graph Signal Processing and Applications 28 / 69
  37. Examples: Colored Point Cloud denoising Initial Point cloud Noisy Local

    Graph Non Local Graph f 0 : V → R3 4-NNG 200-NNG, Ff0 9 127039 points F. Lozes, A. Elmoataz, O. Lezoray, Nonlocal processing of 3D colored point clouds, International Conference on Pattern Recognition (ICPR), pp. 1968-1971, 2012. O. L´ ezoray (University of Caen Normandy) Graph Signal Processing and Applications 29 / 69
  38. Examples: Image Database denoising Initial data Noisy data 10-NNG f

    0 : V → R16×16 O. L´ ezoray (University of Caen Normandy) Graph Signal Processing and Applications 30 / 69
  39. Examples: Image Database denoising λ = 1 λ = 0.01

    λ = 0 Isotropic p = 1 PSNR=18.80dB PSNR=13.54dB PSNR=10.52dB Anisotropic p = 1 PSNR=18.96dB PSNR=15.19dB PSNR=14.41dB O. L´ ezoray (University of Caen Normandy) Graph Signal Processing and Applications 31 / 69
  40. Hierarchical decomposition by iterative regularization Original Image Removing layers u1

    to u3 and u6 to u9 removes acne removes freckles M. Hidane, O. L´ ezoray, A. Elmoataz, Graph signal decomposition for multi-scale detail O. L´ ezoray (University of Caen Normandy) Graph Signal Processing and Applications 32 / 69
  41. Mesh enhancement Original Mesh Coarse Mesh Intermediate Mesh Enhanced Mesh

    O. L´ ezoray (University of Caen Normandy) Graph Signal Processing and Applications 33 / 69
  42. High Quality Colored Mesh enhancement 553053 vertices, 1105611 faces Original

    scan Enhanced scan O. L´ ezoray (University of Caen Normandy) Graph Signal Processing and Applications 34 / 69
  43. Interpolation of missing data on graphs Let f 0 :

    V0 → R be a function with V0 ⊂ V be the subset of vertices from the whole graph with known values. The interpolation consists in recovering values of f for the vertices of V \ V0 given values for vertices of V0 formulated by: min f :V→R R∗ w,p (f ) + λ(vi ) f (vi ) − f 0(vi ) 2 2 . (25) Since f 0(vi ) is known only for vertices of V0 , the Lagrange parameter is defined as λ : V → R: λ(vi ) = λ if vi ∈ V0 0 otherwise. (26) This comes to consider ∆∗ w,p f (vi ) = 0 on V \ V0 . O. L´ ezoray (University of Caen Normandy) Graph Signal Processing and Applications 35 / 69
  44. Semi-supervised clustering Each vertex of vi ∈ V is then

    described by a vector of labels f0(vi ) = (f 0 l (vi ))T l=1,...,k with f 0 l (vi ) =    +1 if vi ∈ Cl the l-th class 0 otherwise. 0 ∀vi ∈ V\V0 (27) Final class memberships are estimated and the class of a vertex given by: arg max l∈1,...,k f (t) l (vi ) l f (t) l (vi ) (28) O. L´ ezoray (University of Caen Normandy) Graph Signal Processing and Applications 36 / 69
  45. Examples: Image segmentation Solve ∆∗ w,p f (vi ) =

    0 on V \ V0 . (a) 27 512 pixels (b) Original+Labels (c) t = 50 (11 seconds) (d) 639 zones (98% of reduc- tion) (e) Original+Labels (f) t = 5 (< 1 second) (g) 639 zones (98% of reduc- tion) (h) Original+Labels (i) t = 2 (< 1 second) Fig. 5. Semi-supervised image segmentation. First row: grid-graph based. Second O. L´ ezoray (University of Caen Normandy) Graph Signal Processing and Applications 37 / 69
  46. Examples: Image Database clustering O. L´ ezoray (University of Caen

    Normandy) Graph Signal Processing and Applications 38 / 69
  47. Examples: 3D Point Cloud colorization p = 1, G25 ,

    Ff0 9 F. Lozes, A. Elmoataz, O. L´ ezoray, PDE-based Graph Signal Processing for 3D Color Point Clouds: Opportunities for Cultural Heritage, IEEE Signal Processing Magazine, Vol. 32, n4, pp. 103-111, 2015. O. L´ ezoray (University of Caen Normandy) Graph Signal Processing and Applications 39 / 69
  48. Examples: Point cloud inpainting p = 1, G300 , Ff0

    9 F. Lozes, A. Elmoataz, O. Lezoray, PDEs on Graphs for Filtering and Inpainting of Point Clouds, International Symposium on Image and Signal Processing and Analysis (IEEE), Special Session on Digital Imaging in Cultural Heritage, 2013. O. L´ ezoray (University of Caen Normandy) Graph Signal Processing and Applications 40 / 69
  49. 1 Introduction 2 Graphs and difference operators 3 Construction of

    graphs - non locality 4 p-Laplacian nonlocal regularization on graphs Applications in medical imaging 5 Mathematical Morphology and Eikonal equation on graphs O. L´ ezoray (University of Caen Normandy) Graph Signal Processing and Applications 41 / 69
  50. Dermoscopic Imaging Aim: accurate skin lesion segmentation for automated early

    skin cancer detection and diagnosis. Images: multispectral dermoscopic images composed of 6 spectral bands (3 in visible light and 3 in infrared -IR- light). O. L´ ezoray (University of Caen Normandy) Graph Signal Processing and Applications 42 / 69
  51. Dermoscopic Imaging Superpixel Segmentation: uses Eikonal-based Region Growing Clustering algorithm

    on a 8-grid weighted graph (seen later). Superpixel Clustering: k-means (k = 3) on 6 features computed for each superpixel (average and standard deviation in CIELAB). Semi-supervised graph-based superpixel label regularization: performed on the graph ˜ G = (˜ V, ˜ E, w2 ) of the superpixel clustering with w2 (˜ vi , ˜ vj ) = Gσc ( fc (˜ vi )−fc (˜ vj ) 2 2 )·Gσh ( h(˜ vi )−h(˜ vj ) 2 χ2 ) with h(˜ vi ) the histogram of uniform gray-scale and rotation invariant Local Binary Patterns of the superpixel. O. L´ ezoray (University of Caen Normandy) Graph Signal Processing and Applications 43 / 69
  52. Dermoscopic Imaging Region merging: One class (light green) is merged

    with the lesion or the surrounding skin classes using criteria based on area, color and spatial position relative to the detected lesion (dark-green). Pixel boundary spatial refinement: spatial label refinement is performed on the graph G+ = (∂+V, E++, w3 ) with w3 (vi , vj ) = Gσ ( Ff0 3 (vi ) − Ff0 3 (vj ) 2 2 ), ∂+V = {vi ∈ V : ∃vj ∈ ∂V with d(vi , vj ) ≤ δ}, E+ = {(vi , vj ) ∈ E : vi , vj ∈ ∂+V } and E++ ⊂ E+ such that each vertex vi is connect to only its 8-nearest neighbors (in terms of 3 × 3 patch L2 distance). O. L´ ezoray (University of Caen Normandy) Graph Signal Processing and Applications 44 / 69
  53. Dermoscopic Imaging O. L´ ezoray, M. Revenu, M. Desvignes, Graph-based

    skin lesion segmentation of multispectral dermoscopic images, International Conference on Image Processing (IEEE), pp. 897-901, 2014 O. L´ ezoray (University of Caen Normandy) Graph Signal Processing and Applications 45 / 69
  54. Histopathology The medical field of pathology is living a revolution

    similar to that of radiology with the advent of efficient whole slide scanners. These Whole slide scanners enable to scan a tissue with different resolutions. 4x 4x 4x These multi-resolution images have very huge: 40000 × 40000 pixels. They are divided in tiles for efficient visualization and processing. O. L´ ezoray (University of Caen Normandy) Graph Signal Processing and Applications 46 / 69
  55. Whole Slide Image (1) O. L´ ezoray (University of Caen

    Normandy) Graph Signal Processing and Applications 47 / 69
  56. Whole Slide Image (2) O. L´ ezoray (University of Caen

    Normandy) Graph Signal Processing and Applications 48 / 69
  57. Whole Slide Image (3) O. L´ ezoray (University of Caen

    Normandy) Graph Signal Processing and Applications 49 / 69
  58. Whole Slide Image (4) O. L´ ezoray (University of Caen

    Normandy) Graph Signal Processing and Applications 50 / 69
  59. Breast Cancer Breast Cancer Second leading cause of cancer death

    for women; Breast cancer grading : Elston-Ellis criterion Proliferation of mitotic figures is one of the strongest prognostic and predictive factor in breast carcinoma Our Approach on Breast Cancer Histological WSI Graph-based multi-resolution segmentation; Top-down approach that mimics pathologist interpretation process; Segmentation based on two important steps : 1 Unsupervised clustering process at each resolution level; 2 Refinement of the associated segmentation in specific areas as the resolution increases; V. Roullier, O. L´ ezoray, V.-T. Ta, A. Elmoataz, Multi-resolution graph-based analysis of histopathological whole slide images: application to mitotic cell extraction and visualization, Computerized Medical Imaging and Graphics, Vol. 35, pp. 603-615, 2011. O. L´ ezoray (University of Caen Normandy) Graph Signal Processing and Applications 51 / 69
  60. Principle Principle First level: separate background and tissue; Next levels:

    in a given region of interest, cluster the pixels into two classes Last level: extract mitotic figures. Background Whole slide image Normal surrounding tissue Tissue Stroma and normal glandular acini Lesion Tumorous cells Tumorous cells groups Mitotic figures Level 2 Level 3 Level 1 Level 4 O. L´ ezoray (University of Caen Normandy) Graph Signal Processing and Applications 52 / 69
  61. General Algorithm Algorithm O. L´ ezoray (University of Caen Normandy)

    Graph Signal Processing and Applications 53 / 69
  62. General Algorithm Algorithm 1 Regularization of the image tiles O.

    L´ ezoray (University of Caen Normandy) Graph Signal Processing and Applications 53 / 69
  63. General Algorithm Algorithm 1 Regularization of the image tiles 2

    Unsupervised clustering (color) in 2 classes of the Histogram of the tiles O. L´ ezoray (University of Caen Normandy) Graph Signal Processing and Applications 53 / 69
  64. General Algorithm Algorithm 1 Regularization of the image tiles 2

    Unsupervised clustering (color) in 2 classes of the Histogram of the tiles 3 Spatial refinement O. L´ ezoray (University of Caen Normandy) Graph Signal Processing and Applications 53 / 69
  65. General Algorithm Algorithm 1 Regularization of the image tiles 2

    Unsupervised clustering (color) in 2 classes of the Histogram of the tiles 3 Spatial refinement 4 For each level : O. L´ ezoray (University of Caen Normandy) Graph Signal Processing and Applications 53 / 69
  66. General Algorithm Algorithm 1 Regularization of the image tiles 2

    Unsupervised clustering (color) in 2 classes of the Histogram of the tiles 3 Spatial refinement 4 For each level : 1 Replication at a finer level of resolution (in region of interest); O. L´ ezoray (University of Caen Normandy) Graph Signal Processing and Applications 53 / 69
  67. General Algorithm Algorithm 1 Regularization of the image tiles 2

    Unsupervised clustering (color) in 2 classes of the Histogram of the tiles 3 Spatial refinement 4 For each level : 1 Replication at a finer level of resolution (in region of interest); 2 Regularization of the tiles with (RGB + LBP) information in the weights; O. L´ ezoray (University of Caen Normandy) Graph Signal Processing and Applications 53 / 69
  68. General Algorithm Algorithm 1 Regularization of the image tiles 2

    Unsupervised clustering (color) in 2 classes of the Histogram of the tiles 3 Spatial refinement 4 For each level : 1 Replication at a finer level of resolution (in region of interest); 2 Regularization of the tiles with (RGB + LBP) information in the weights; 3 Unsupervised clustering (color+texture) process in 2 classes; O. L´ ezoray (University of Caen Normandy) Graph Signal Processing and Applications 53 / 69
  69. General Algorithm Algorithm 1 Regularization of the image tiles 2

    Unsupervised clustering (color) in 2 classes of the Histogram of the tiles 3 Spatial refinement 4 For each level : 1 Replication at a finer level of resolution (in region of interest); 2 Regularization of the tiles with (RGB + LBP) information in the weights; 3 Unsupervised clustering (color+texture) process in 2 classes; 4 Spatial refinement for each tile; O. L´ ezoray (University of Caen Normandy) Graph Signal Processing and Applications 53 / 69
  70. General Algorithm Algorithm 1 Regularization of the image tiles 2

    Unsupervised clustering (color) in 2 classes of the Histogram of the tiles 3 Spatial refinement 4 For each level : 1 Replication at a finer level of resolution (in region of interest); 2 Regularization of the tiles with (RGB + LBP) information in the weights; 3 Unsupervised clustering (color+texture) process in 2 classes; 4 Spatial refinement for each tile; O. L´ ezoray (University of Caen Normandy) Graph Signal Processing and Applications 53 / 69
  71. General Algorithm Algorithm 1 Regularization of the image tiles 2

    Unsupervised clustering (color) in 2 classes of the Histogram of the tiles 3 Spatial refinement 4 For each level : 1 Replication at a finer level of resolution (in region of interest); 2 Regularization of the tiles with (RGB + LBP) information in the weights; 3 Unsupervised clustering (color+texture) process in 2 classes; 4 Spatial refinement for each tile; O. L´ ezoray (University of Caen Normandy) Graph Signal Processing and Applications 53 / 69
  72. General Algorithm Algorithm 1 Regularization of the image tiles 2

    Unsupervised clustering (color) in 2 classes of the Histogram of the tiles 3 Spatial refinement 4 For each level : 1 Replication at a finer level of resolution (in region of interest); 2 Regularization of the tiles with (RGB + LBP) information in the weights; 3 Unsupervised clustering (color+texture) process in 2 classes; 4 Spatial refinement for each tile; 5 Mitosis extraction. O. L´ ezoray (University of Caen Normandy) Graph Signal Processing and Applications 53 / 69
  73. Results Segmentation at level 1: Image → (Tissue vs Background)

    O. L´ ezoray (University of Caen Normandy) Graph Signal Processing and Applications 54 / 69
  74. Results Segmentation at level 2: Tissue → (Lesion vs Normal

    Tissue) O. L´ ezoray (University of Caen Normandy) Graph Signal Processing and Applications 54 / 69
  75. Results Segmentation at level 3: Lesion → (Stroma vs Tumor

    cell groups) O. L´ ezoray (University of Caen Normandy) Graph Signal Processing and Applications 54 / 69
  76. Results Segmentation at level 4: Tumor cell groups → (tumorous

    cells and mitosis) O. L´ ezoray (University of Caen Normandy) Graph Signal Processing and Applications 54 / 69
  77. Results Segmentation at level 4: Tumor cell groups → (tumorous

    cells and mitosis) zoomed O. L´ ezoray (University of Caen Normandy) Graph Signal Processing and Applications 54 / 69
  78. Results Visualization of the tumor proliferation (Voronoi distance map) Semi-Supervised

    clustering on the graph of extracted mitosis O. L´ ezoray (University of Caen Normandy) Graph Signal Processing and Applications 54 / 69
  79. 1 Introduction 2 Graphs and difference operators 3 Construction of

    graphs - non locality 4 p-Laplacian nonlocal regularization on graphs 5 Mathematical Morphology and Eikonal equation on graphs O. L´ ezoray (University of Caen Normandy) Graph Signal Processing and Applications 55 / 69
  80. Morphological difference operators on graphs We introduce morphological (or upwind)

    difference operators (weighted directional operators): (d+ w f )(vi , vj )=w(vi , vj )1/2 max f (vi ), f (vj ) −f (vi ) and (d− w f )(vi , vj )=w(vi , vj )1/2 f (vi )− min f (vi ), f (vj ) , (29) with the following properties (always positive) (d+ w f )(vi , vj )= max 0, (dw f )(vi , vj ) (d− w f )(vi , vj )= − min 0, (dw f )(vi , vj ) with the associated internal and external gradients: (∇± w f)(vi ) = [(d± w f )(vi , vj ) : ∀vj ∈ V]T . A. Elmoataz, O. Lezoray, S. Bougleux, Nonlocal Discrete Regularization on Weighted Graphs: a framework for Image and Manifold Processing, IEEE transactions on Image Processing, Vol. 17(7), pp. 1047-1060, 2008. O. L´ ezoray (University of Caen Normandy) Graph Signal Processing and Applications 56 / 69
  81. Mathematical Morphology: Continuous formulation Continuous scale morphology defines flat erosion

    and dilation of a function f 0 : Ω ⊂ R2 → R by structuring sets B = {z ∈ R2 : z p ≤ 1} with the general Partial Differential Equations that describes an evolution equation ∂f ∂t = ∂t f = ± ∇f p Solution of f (x, y, t) at time t > 0 provides dilation (with the plus sign) or erosion (with the minus sign) within a structuring element of size n∆t: δ(f ) = ∂t f = + ∇f p and (f ) = ∂t f = − ∇f p Dilation of a single point with a size of 100∆t, ∆t = 0.25 and p = 1, p = 2, and p = ∞. O. L´ ezoray (University of Caen Normandy) Graph Signal Processing and Applications 57 / 69
  82. MM: Transcription on graphs Transcription on graphs Given G =

    (V, E, w), f 0 : V → R, f (., 0) = f , ∀vi ∈ V, we define: δ : ∂t f (vi , t) = + (∇+ w f)(vi , t) p : ∂t f (vi , t) = − (∇− w f)(vi , t) p O. L´ ezoray (University of Caen Normandy) Graph Signal Processing and Applications 58 / 69
  83. MM: Transcription on graphs Transcription on graphs Given G =

    (V, E, w), f 0 : V → R, f (., 0) = f , ∀vi ∈ V, we define: δ : ∂t f (vi , t) = + (∇+ w f)(vi , t) p : ∂t f (vi , t) = − (∇− w f)(vi , t) p A⊂V O. L´ ezoray (University of Caen Normandy) Graph Signal Processing and Applications 58 / 69
  84. MM: Transcription on graphs Transcription on graphs Given G =

    (V, E, w), f 0 : V → R, f (., 0) = f , ∀vi ∈ V, we define: δ : ∂t f (vi , t) = + (∇+ w f)(vi , t) p : ∂t f (vi , t) = − (∇− w f)(vi , t) p - - - - - + + + + + + + + + - + A⊂V ∂+A = {vi / ∈A : ∃vj ∈A with eij ∈E} ∂−A = {vi ∈A : ∃vj / ∈A with eij ∈E} O. L´ ezoray (University of Caen Normandy) Graph Signal Processing and Applications 58 / 69
  85. MM: Transcription on graphs Transcription on graphs Given G =

    (V, E, w), f 0 : V → R, f (., 0) = f , ∀vi ∈ V, we define: δ : ∂t f (vi , t) = + (∇+ w f)(vi , t) p : ∂t f (vi , t) = − (∇− w f)(vi , t) p - - - - - + + + + + + + + + - + A⊂V ∂+A = {vi / ∈A : ∃vj ∈A with eij ∈E} ∂−A = {vi ∈A : ∃vj / ∈A with eij ∈E} Dilation: adding vertices from ∂+A to A O. L´ ezoray (University of Caen Normandy) Graph Signal Processing and Applications 58 / 69
  86. MM: Transcription on graphs Transcription on graphs Given G =

    (V, E, w), f 0 : V → R, f (., 0) = f , ∀vi ∈ V, we define: δ : ∂t f (vi , t) = + (∇+ w f)(vi , t) p : ∂t f (vi , t) = − (∇− w f)(vi , t) p - - - - - + + + + + + + + + - + A⊂V ∂+A = {vi / ∈A : ∃vj ∈A with eij ∈E} ∂−A = {vi ∈A : ∃vj / ∈A with eij ∈E} Dilation: adding vertices from ∂+A to A Erosion: removing vertices from ∂−A to A O. L´ ezoray (University of Caen Normandy) Graph Signal Processing and Applications 58 / 69
  87. MM: Transcription on graphs PDE MM: δ : ∂t f

    (x, t) = + ∇f(x, t) p : ∂t f (x, t) = − ∇f(x, t) p Transcription on graphs Given G = (V, E, w), f 0 : V → R, f (., 0) = f , ∀vi ∈ V, we define: δ : ∂t f (vi , t) = + (∇+ w f)(vi , t) p : ∂t f (vi , t) = − (∇− w f)(vi , t) p Since we can prove that for any level f l of f , we have: (∇w fl)(vi ) p = (∇+ w fl)(vi ) p if vi ∈ ∂+Al , (∇− w fl)(vi ) p if vi ∈ ∂−Al . (30) Iterative algorithms with discretization in time: f 0 : V → R, f (n)(vi )≈f (vi , n∆t) f (n+1)(vi )=f (n)(vi )±∆t (∇± w f(n))(vi ) p f 0(vi )=f 0(vi ) V.T. Ta, A. Elmoataz, O. L´ ezoray, Nonlocal PDEs-based Morphology on Weighted Graphs for Image and Data Processing, IEEE transactions on Image Processing, Vol. 20, n6, pp. 1504-1516, 2011, 2011. O. L´ ezoray (University of Caen Normandy) Graph Signal Processing and Applications 59 / 69
  88. Example: image database MM processing f0 : V → IR256

    Dilation Erosion Opening k-NNG Initial O. L´ ezoray (University of Caen Normandy) Graph Signal Processing and Applications 60 / 69
  89. Eikonal equation The Eikonal equation in 2D enables to describe

    the evolution of a propagation front Γ ∇f (x) = F(x) in Ω ⊂ R2 f (x) = 0 on Γ ⊂ R2 where f (x) is the arrival time of the front at x and F(x) ≥ 0 is a slowness field. This can be solved with Fast Marching on grid-graphs domains. A discrete adaptation of the Eikonal equation on weighted graphs, that describes a morphological erosion process, can be formulated as (∇− w f)(vi ) p = P(vi ) ∀vi ∈ V f (vi ) = 0 ∀ ∈ V0 This can be solved on weighted arbitrary graphs with an adapted and generalized fast marching algorithm. X. Desquesnes, A. Elmoataz, O. L´ ezoray, Eikonal equation adaptation on weighted graphs: fast geometric diffusion process for local and non-local image and data processing, Journal of Mathematical Imaging and Vision, Vol. 46, n2, pp. 238-257, 2013. O. L´ ezoray (University of Caen Normandy) Graph Signal Processing and Applications 61 / 69
  90. Geodesic distance computation (P = 1) O. L´ ezoray (University

    of Caen Normandy) Graph Signal Processing and Applications 62 / 69
  91. Geodesic distance computation (P = 1) With specific weights (color,

    texture) O. L´ ezoray (University of Caen Normandy) Graph Signal Processing and Applications 62 / 69
  92. WSI Cell semi-supervised classification · The Eikonal equation enables Semi-Supervised

    graph clustering: alternative to state-of-the-art methods. Example for the classification of cells extracted from cytopathological whole slide images. O. L´ ezoray (University of Caen Normandy) Graph Signal Processing and Applications 63 / 69
  93. Limitations due to the potential function Classical potential function :

    P(vi ) = (∇w f)(vi ) Explanation: The front slows down on a contour, but evolves freely once the contour has been crossed. O. L´ ezoray (University of Caen Normandy) Graph Signal Processing and Applications 64 / 69
  94. Dynamic potential Inspired from region growing techniques P(vi , Ci

    ) = ¯ f (Ci ) − f (vi ) , vi ∈ Γ (31) with Ci the neighboring cluster to vi , ¯ f (Ci ) the average of f on cluster Ci P. Buyssens, M. Toutain, A. Elmoataz, O. L´ ezoray, Eikonal-based vertices growing and iterative seeding for efficient graph-based segmentation, International Conference on Image Processing (IEEE), pp. 4368-4372, 2014. O. L´ ezoray (University of Caen Normandy) Graph Signal Processing and Applications 65 / 69
  95. Beyond mean dynamic potential Each class is modeled with a

    Gaussian Mixture Model Π = K k=1 πk Gk and Gk (x) = 1 (2π) d 2 | k | 1 2 e(− 1 2 (x−µk ) −1(x−µk )) with µk the average of the k-th Gaussian k the covariance matrix of the k-th Gaussian πk the mixture coefficients (with K k=1 πk = 1) Initialization: estimate the GMMs parameters for each cluster with K = 10 Proposed potential function γ(vi |Ci ) = maxk (πk Gk (f(vi ))) Gaussian that best fits x = f(vi ) is retained. P(vi |Ci ) = 1 γ(vi |Ci ) If a Gaussian is underrepresented (πk << 1), the front slows down. Online Update of the Gaussians for more efficiency P. Buyssens, O. L´ ezoray, Multivalued label diffusion for semi-supervised segmentation, International Conference on Image Processing (IEEE), 2015 O. L´ ezoray (University of Caen Normandy) Graph Signal Processing and Applications 66 / 69
  96. Dynamic GMM Potential Eikonal equation Image with seeds O. L´

    ezoray (University of Caen Normandy) Graph Signal Processing and Applications 67 / 69
  97. Dynamic GMM Potential Eikonal equation Result with the gradient-based potential

    function O. L´ ezoray (University of Caen Normandy) Graph Signal Processing and Applications 67 / 69
  98. Dynamic GMM Potential Eikonal equation Result with the mean potential

    function O. L´ ezoray (University of Caen Normandy) Graph Signal Processing and Applications 67 / 69
  99. Dynamic GMM Potential Eikonal equation Power Watershed (state-of-the-art graph-based method)

    O. L´ ezoray (University of Caen Normandy) Graph Signal Processing and Applications 67 / 69
  100. Dynamic GMM Potential Eikonal equation Result with the GMM Potential

    function O. L´ ezoray (University of Caen Normandy) Graph Signal Processing and Applications 67 / 69
  101. Conclusion A very recent research domain At the frontier between

    many domains (Graph Theory, Signal / Image Processing, Computer Science, Applied Mathematics) PDEs can be easily transposed on graphs domains using the proposed partial difference framework Many challenges to be studied, including: The construction and downsampling/upsampling of graphs, The design of efficient and distributed convex optimization methods operating on graphs, The study of the interplay between graph construction and variational problems optimization. O. L´ ezoray (University of Caen Normandy) Graph Signal Processing and Applications 68 / 69
  102. The End. Thanks. Publications available at : https://lezoray.users.greyc.fr O. L´

    ezoray and Leo Grady Image Processing and Analysis with Graphs: Theory and Practice, CRC Press, July 2012. https://lezoray.users.greyc.fr/IPAG/ O. L´ ezoray (University of Caen Normandy) Graph Signal Processing and Applications 69 / 69