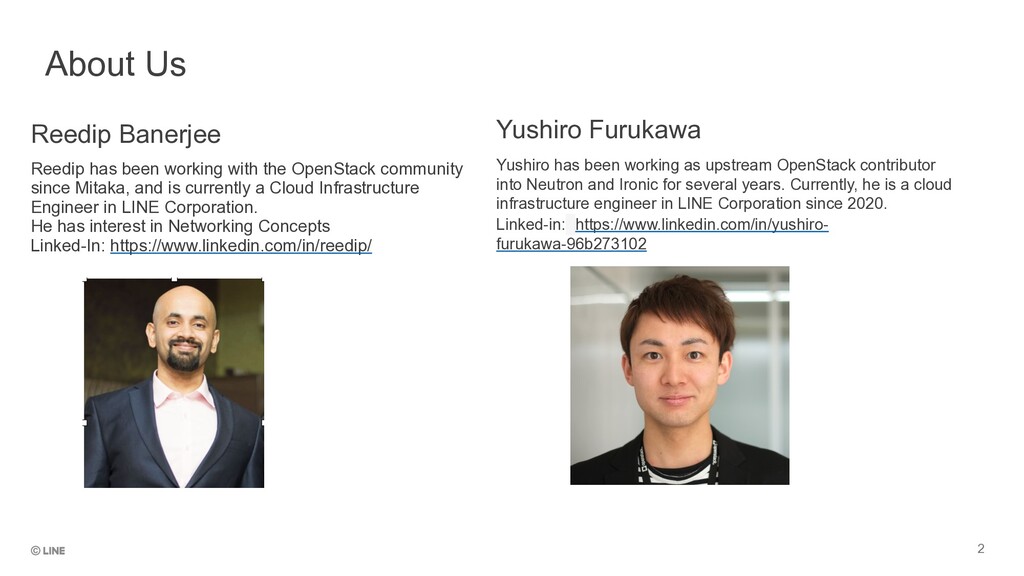
contributor into Neutron and Ironic for several years. Currently, he is a cloud infrastructure engineer in LINE Corporation since 2020. Linked-in: https://www.linkedin.com/in/yushiro- furukawa-96b273102 Reedip Banerjee Reedip has been working with the OpenStack community since Mitaka, and is currently a Cloud Infrastructure Engineer in LINE Corporation. He has interest in Networking Concepts Linked-In: https://www.linkedin.com/in/reedip/ About Us
6 As per data observed between Apr to Jun. 2021 NUMBER OF MONTHLY ACTIVE USERS OF LINE APP : GLOBAL 188 Million NUMBER OF DAILY MESSAGES ~4.9 Billion NUMBER OF MONTHLY ACTIVE USERS OF LINE APP IN JAPAN 88 Million
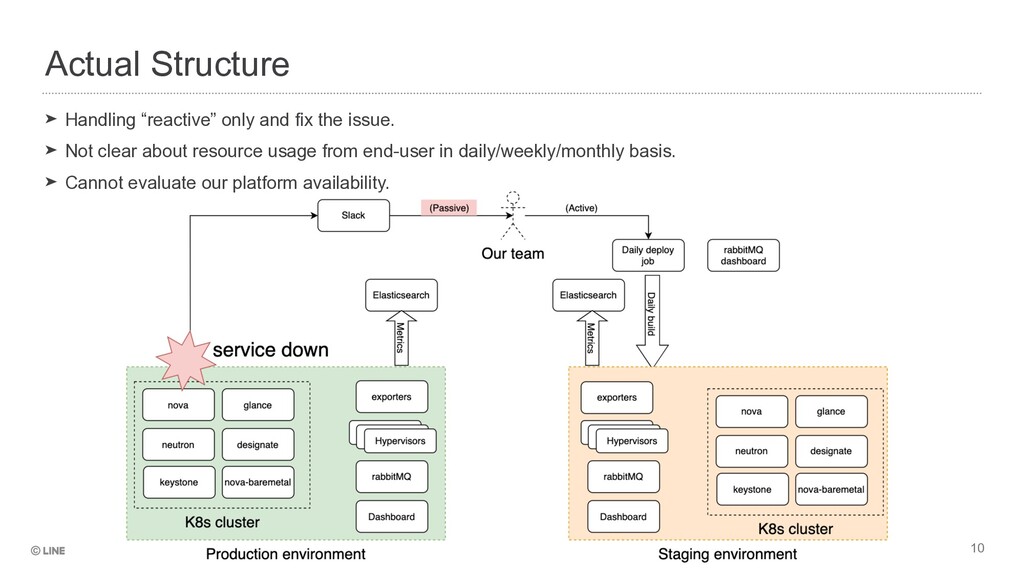
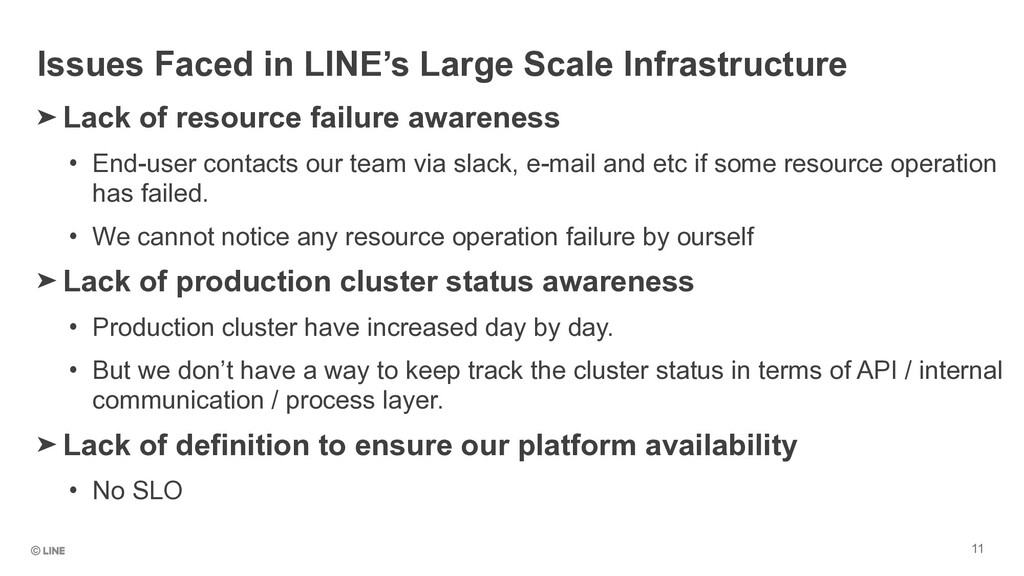
our team via slack, e-mail and etc if some resource operation has failed. • We cannot notice any resource operation failure by ourself ➤ Lack of production cluster status awareness • Production cluster have increased day by day. • But we don’t have a way to keep track the cluster status in terms of API / internal communication / process layer. ➤ Lack of definition to ensure our platform availability • No SLO Issues Faced in LINE’s Large Scale Infrastructure
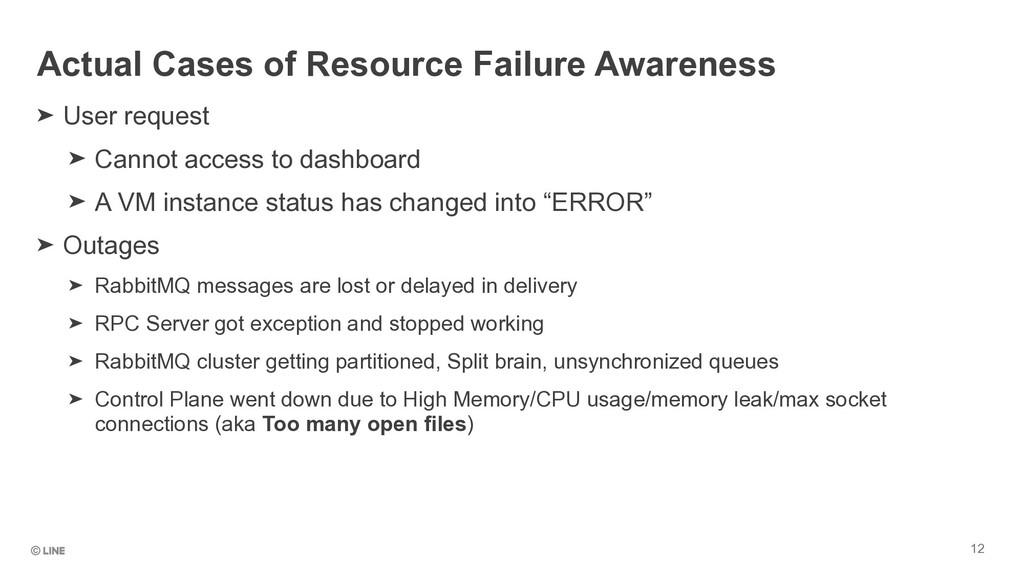
A VM instance status has changed into “ERROR” ➤ Outages ➤ RabbitMQ messages are lost or delayed in delivery ➤ RPC Server got exception and stopped working ➤ RabbitMQ cluster getting partitioned, Split brain, unsynchronized queues ➤ Control Plane went down due to High Memory/CPU usage/memory leak/max socket connections (aka Too many open files) Actual Cases of Resource Failure Awareness
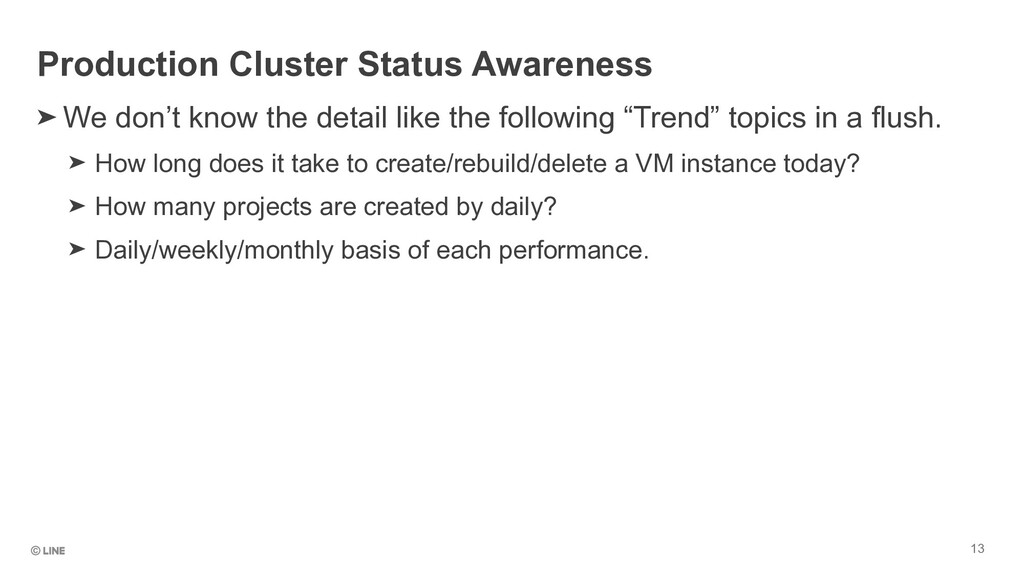
“Trend” topics in a flush. ➤ How long does it take to create/rebuild/delete a VM instance today? ➤ How many projects are created by daily? ➤ Daily/weekly/monthly basis of each performance. Production Cluster Status Awareness
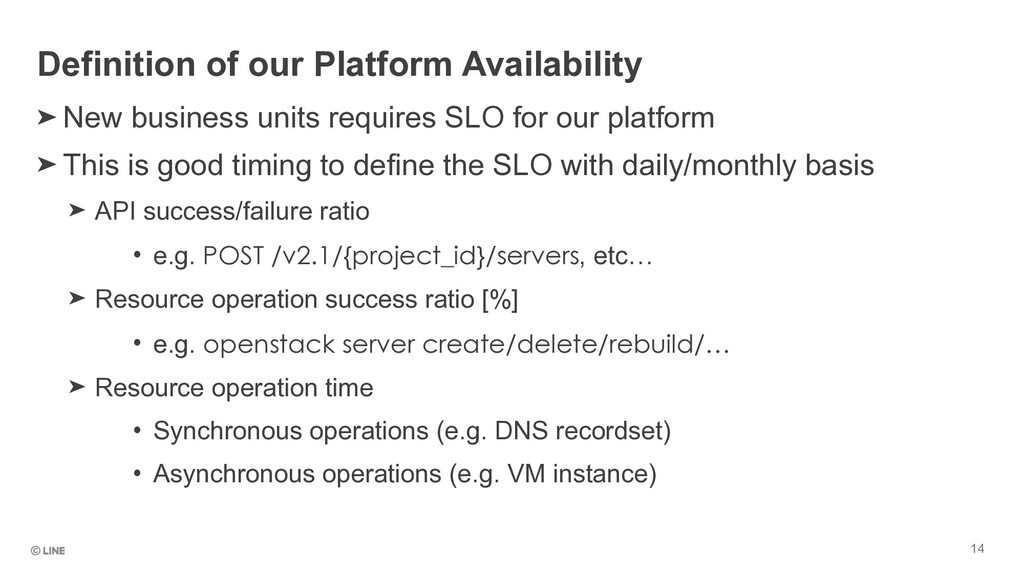
➤ This is good timing to define the SLO with daily/monthly basis ➤ API success/failure ratio • e.g. POST /v2.1/{project_id}/servers, etc… ➤ Resource operation success ratio [%] • e.g. openstack server create/delete/rebuild/… ➤ Resource operation time • Synchronous operations (e.g. DNS recordset) • Asynchronous operations (e.g. VM instance) Definition of our Platform Availability
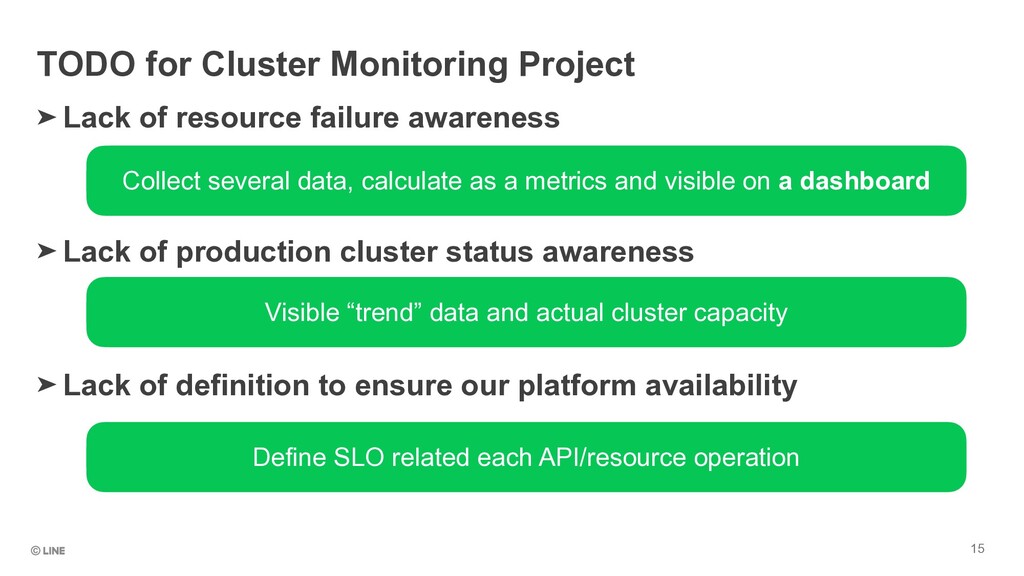
failure awareness ➤ Lack of production cluster status awareness ➤ Lack of definition to ensure our platform availability Collect several data, calculate as a metrics and visible on a dashboard Visible “trend” data and actual cluster capacity Define SLO related each API/resource operation
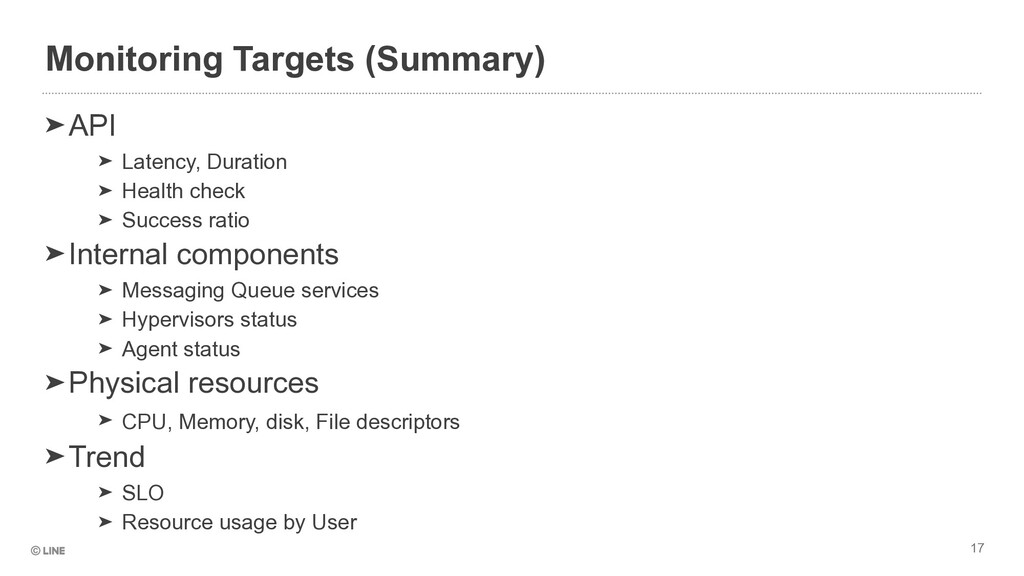
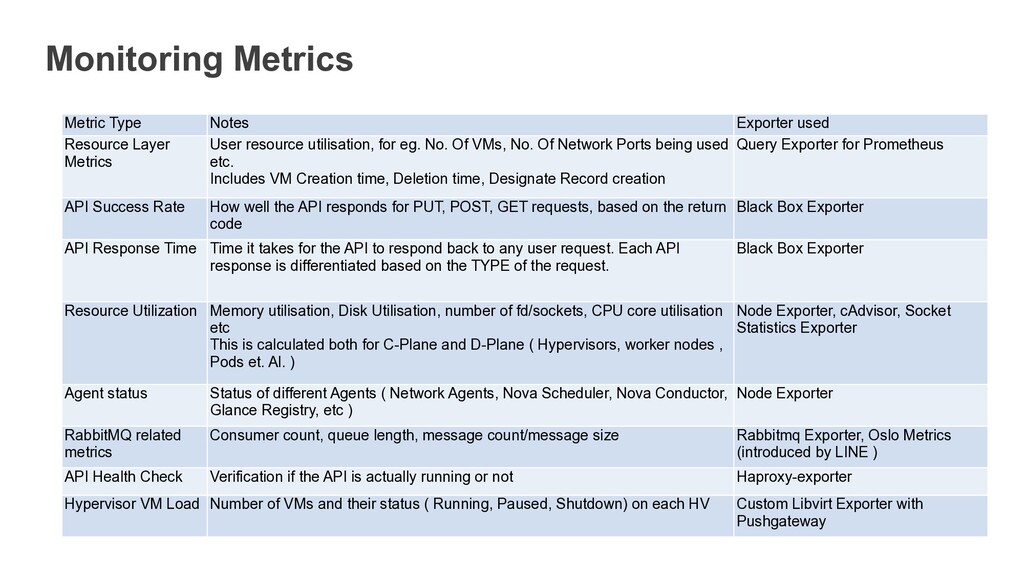
User resource utilisation, for eg. No. Of VMs, No. Of Network Ports being used etc. Includes VM Creation time, Deletion time, Designate Record creation Query Exporter for Prometheus API Success Rate How well the API responds for PUT, POST, GET requests, based on the return code Black Box Exporter API Response Time Time it takes for the API to respond back to any user request. Each API response is differentiated based on the TYPE of the request. Black Box Exporter Resource Utilization Memory utilisation, Disk Utilisation, number of fd/sockets, CPU core utilisation etc This is calculated both for C-Plane and D-Plane ( Hypervisors, worker nodes , Pods et. Al. ) Node Exporter, cAdvisor, Socket Statistics Exporter Agent status Status of different Agents ( Network Agents, Nova Scheduler, Nova Conductor, Glance Registry, etc ) Node Exporter RabbitMQ related metrics Consumer count, queue length, message count/message size Rabbitmq Exporter, Oslo Metrics (introduced by LINE ) API Health Check Verification if the API is actually running or not Haproxy-exporter Hypervisor VM Load Number of VMs and their status ( Running, Paused, Shutdown) on each HV Custom Libvirt Exporter with Pushgateway
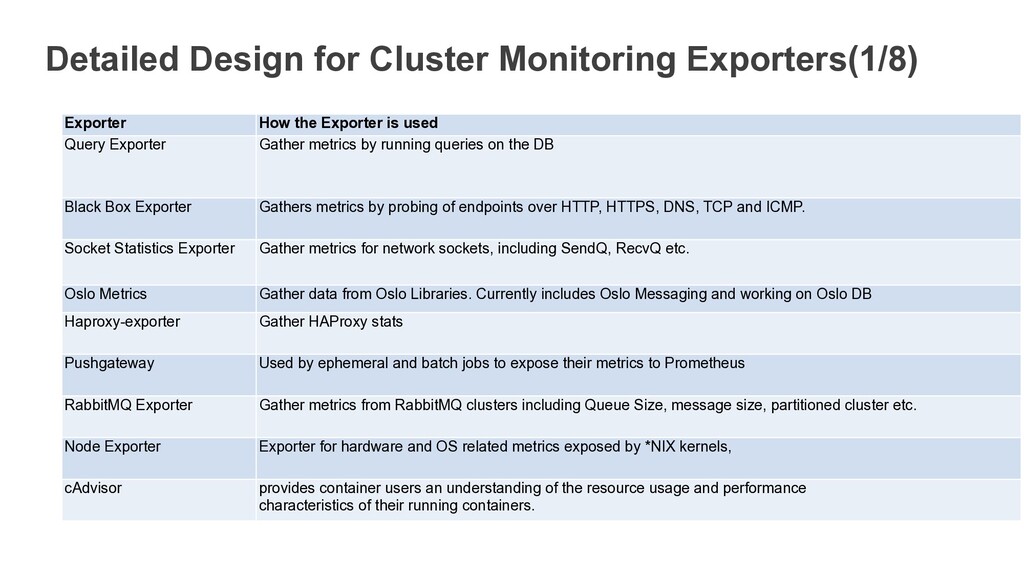
is used Query Exporter Gather metrics by running queries on the DB Black Box Exporter Gathers metrics by probing of endpoints over HTTP, HTTPS, DNS, TCP and ICMP. Socket Statistics Exporter Gather metrics for network sockets, including SendQ, RecvQ etc. Oslo Metrics Gather data from Oslo Libraries. Currently includes Oslo Messaging and working on Oslo DB Haproxy-exporter Gather HAProxy stats Pushgateway Used by ephemeral and batch jobs to expose their metrics to Prometheus RabbitMQ Exporter Gather metrics from RabbitMQ clusters including Queue Size, message size, partitioned cluster etc. Node Exporter Exporter for hardware and OS related metrics exposed by *NIX kernels, cAdvisor provides container users an understanding of the resource usage and performance characteristics of their running containers.
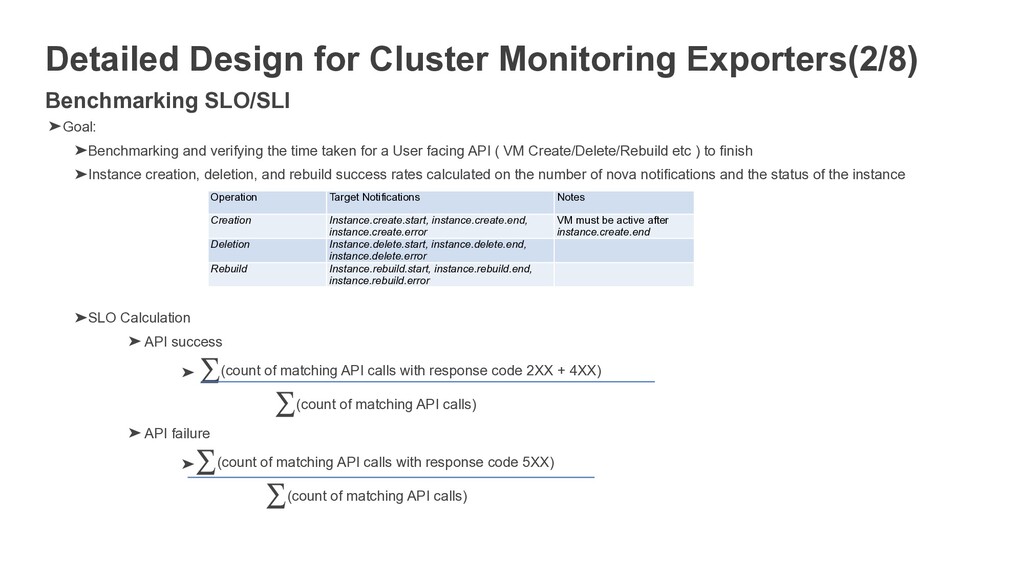
and verifying the time taken for a User facing API ( VM Create/Delete/Rebuild etc ) to finish ➤Instance creation, deletion, and rebuild success rates calculated on the number of nova notifications and the status of the instance ➤SLO Calculation ➤ API success ➤ (count of matching API calls with response code 2XX + 4XX) (count of matching API calls) ➤ API failure ➤ (count of matching API calls with response code 5XX) (count of matching API calls) ∑ ∑ ∑ ∑ Operation Target Notifications Notes Creation Instance.create.start, instance.create.end, instance.create.error VM must be active after instance.create.end Deletion Instance.delete.start, instance.delete.end, instance.delete.error Rebuild Instance.rebuild.start, instance.rebuild.end, instance.rebuild.error
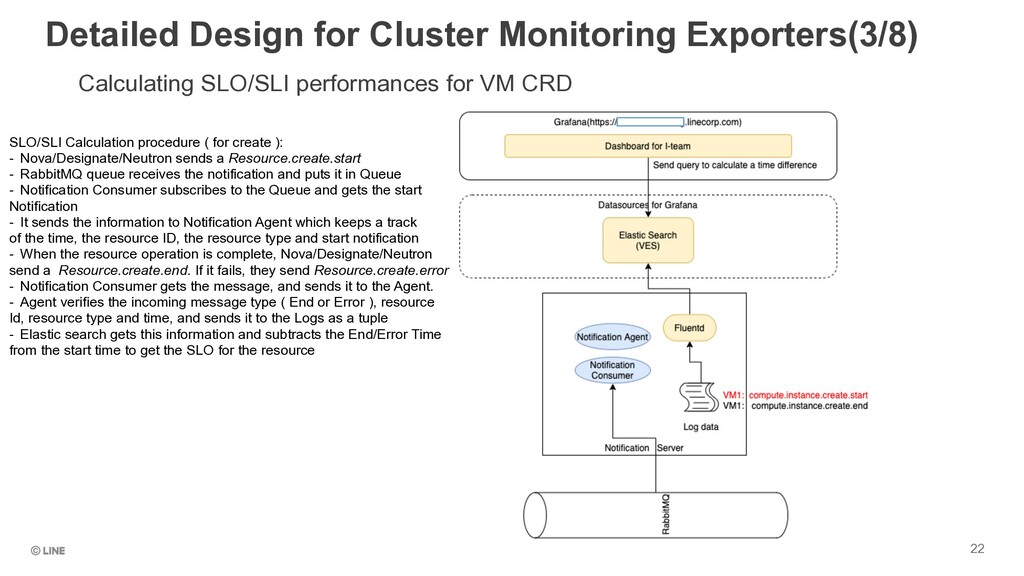
Monitoring Exporters(3/8) 22 SLO/SLI Calculation procedure ( for create ): - Nova/Designate/Neutron sends a Resource.create.start - RabbitMQ queue receives the notification and puts it in Queue - Notification Consumer subscribes to the Queue and gets the start Notification - It sends the information to Notification Agent which keeps a track of the time, the resource ID, the resource type and start notification - When the resource operation is complete, Nova/Designate/Neutron send a Resource.create.end. If it fails, they send Resource.create.error - Notification Consumer gets the message, and sends it to the Agent. - Agent verifies the incoming message type ( End or Error ), resource Id, resource type and time, and sends it to the Logs as a tuple - Elastic search gets this information and subtracts the End/Error Time from the start time to get the SLO for the resource
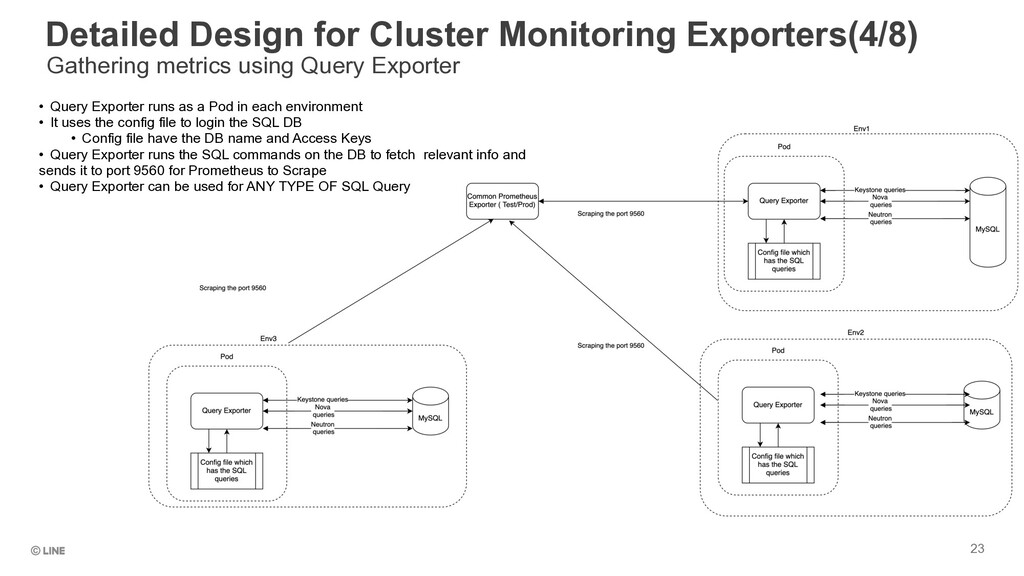
Exporter 23 • Query Exporter runs as a Pod in each environment • It uses the config file to login the SQL DB • Config file have the DB name and Access Keys • Query Exporter runs the SQL commands on the DB to fetch relevant info and sends it to port 9560 for Prometheus to Scrape • Query Exporter can be used for ANY TYPE OF SQL Query
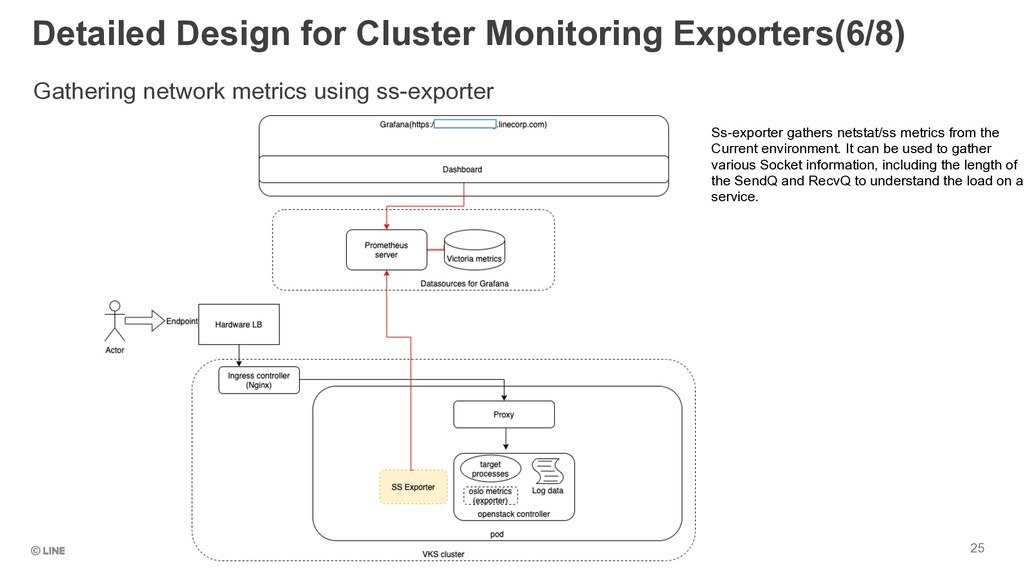
Monitoring Exporters(6/8) Ss-exporter gathers netstat/ss metrics from the Current environment. It can be used to gather various Socket information, including the length of the SendQ and RecvQ to understand the load on a service.
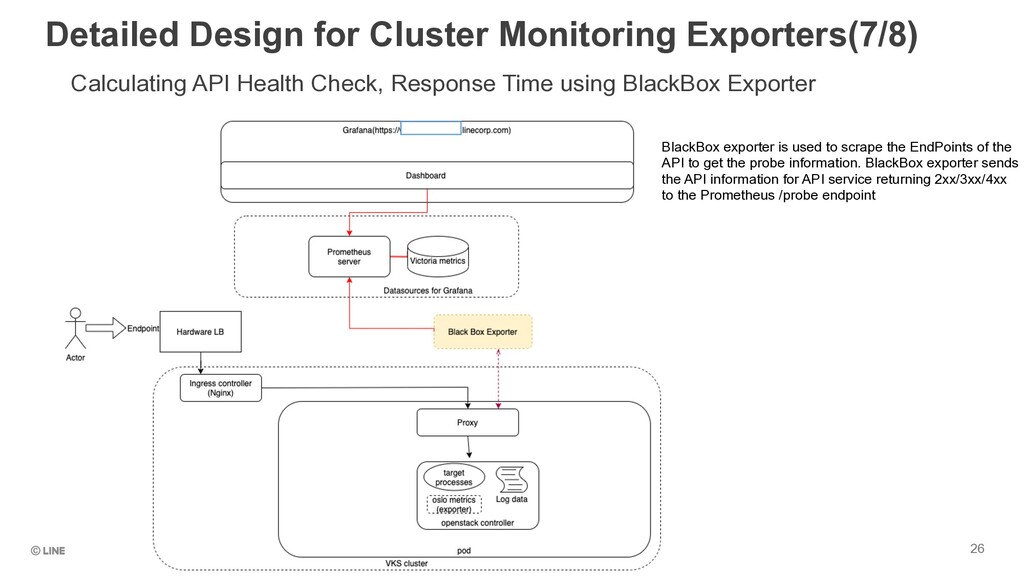
Response Time using BlackBox Exporter 26 BlackBox exporter is used to scrape the EndPoints of the API to get the probe information. BlackBox exporter sends the API information for API service returning 2xx/3xx/4xx to the Prometheus /probe endpoint
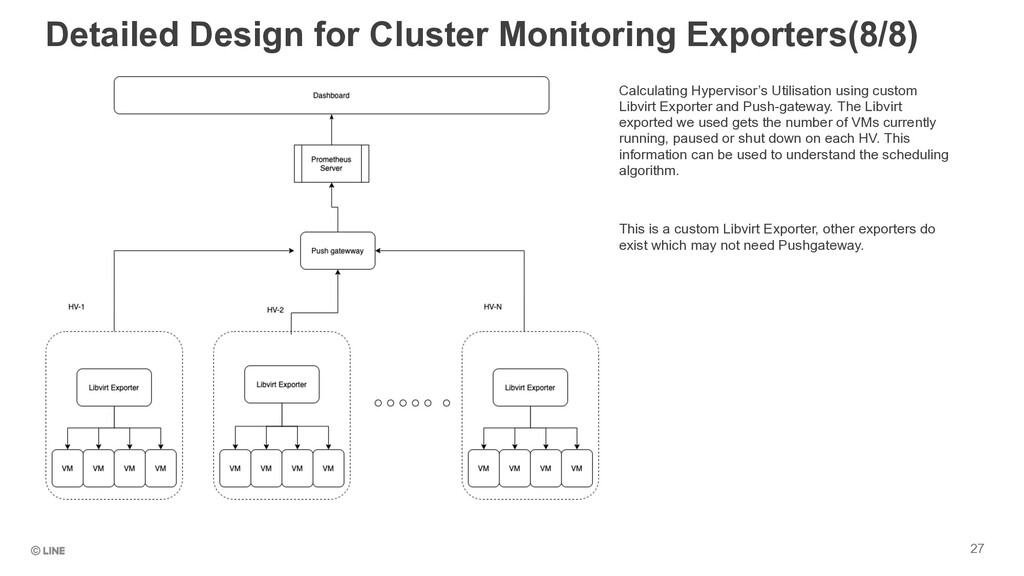
custom Libvirt Exporter and Push-gateway. The Libvirt exported we used gets the number of VMs currently running, paused or shut down on each HV. This information can be used to understand the scheduling algorithm. This is a custom Libvirt Exporter, other exporters do exist which may not need Pushgateway. 27
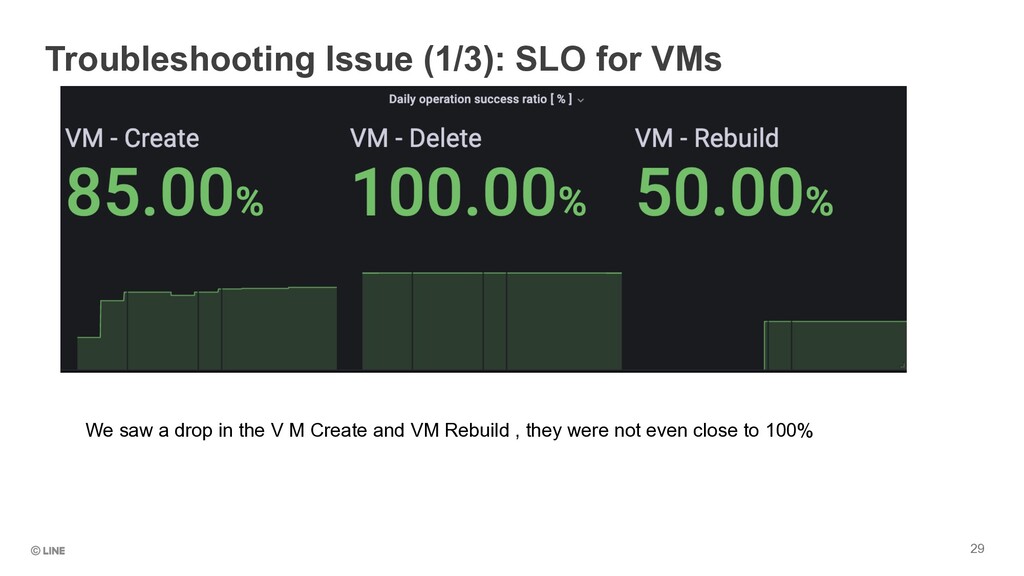
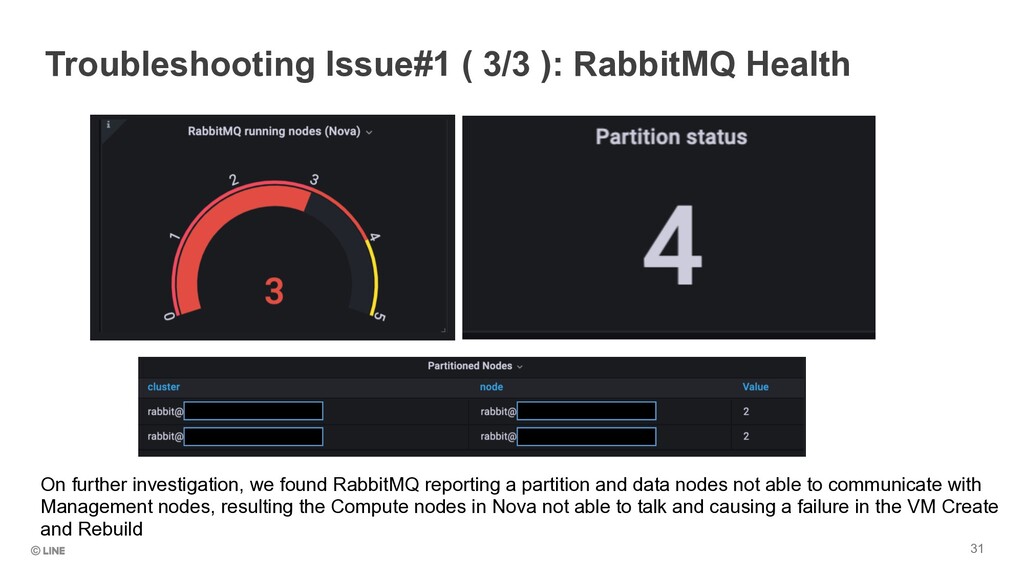
investigation, we found RabbitMQ reporting a partition and data nodes not able to communicate with Management nodes, resulting the Compute nodes in Nova not able to talk and causing a failure in the VM Create and Rebuild
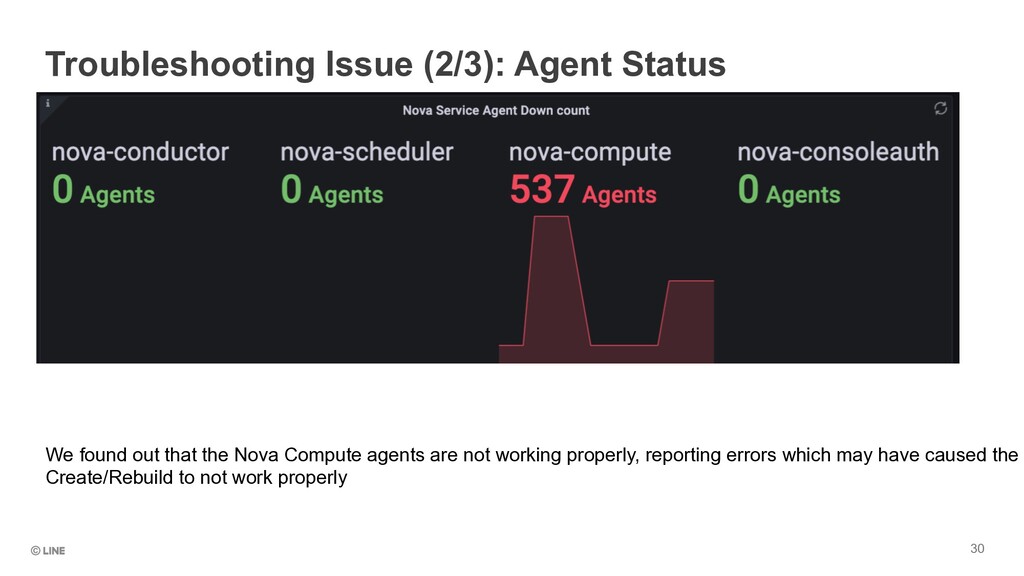
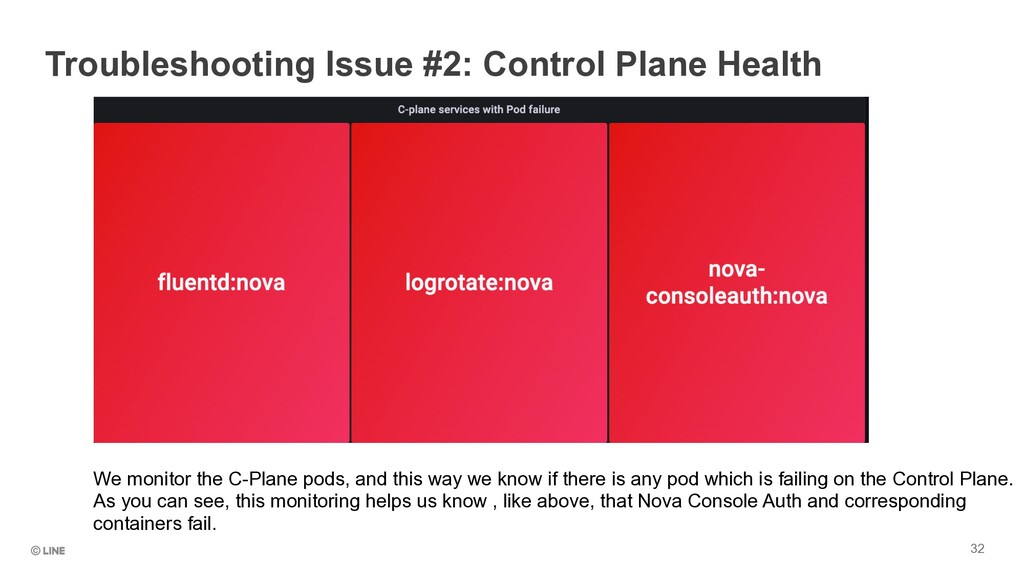
C-Plane pods, and this way we know if there is any pod which is failing on the Control Plane. As you can see, this monitoring helps us know , like above, that Nova Console Auth and corresponding containers fail.
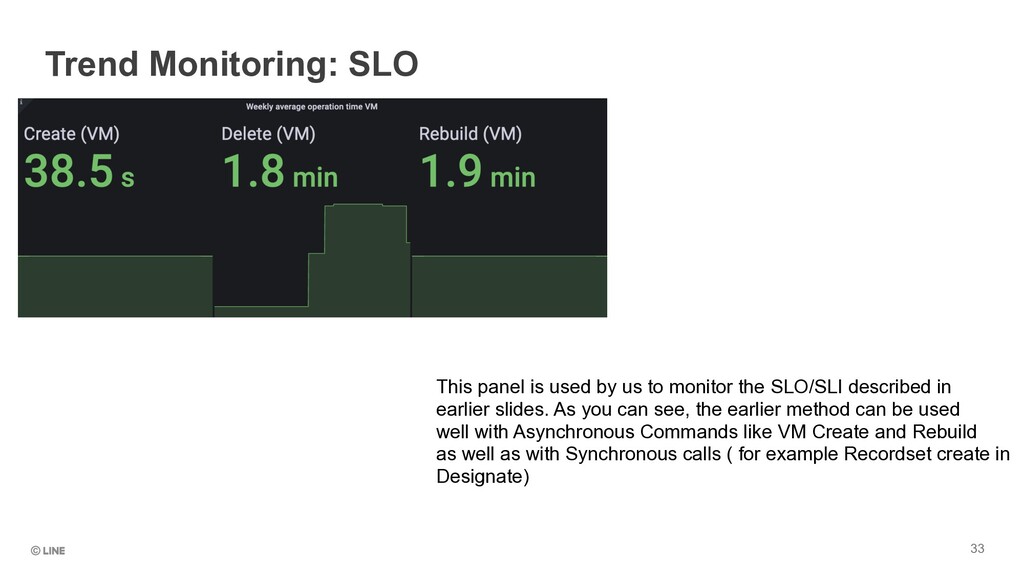
to monitor the SLO/SLI described in earlier slides. As you can see, the earlier method can be used well with Asynchronous Commands like VM Create and Rebuild as well as with Synchronous calls ( for example Recordset create in Designate)