Alex Chantavy and I delivered a talk based on this presentation at the "Cloud Native Security Day North America 2020" (November 17th, 2020).
Video Recording: https://youtu.be/ZwMSkFzgiFc
---
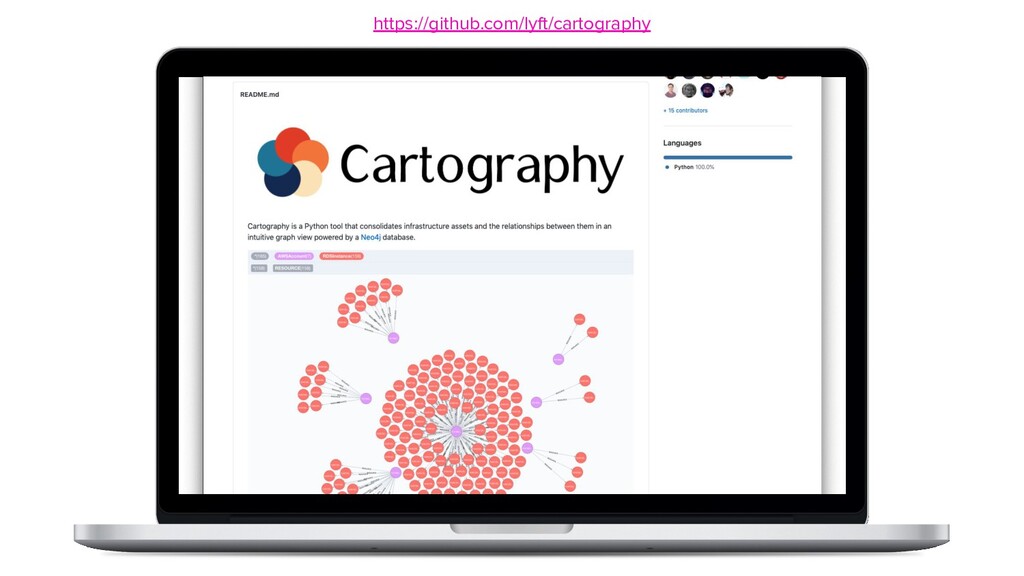
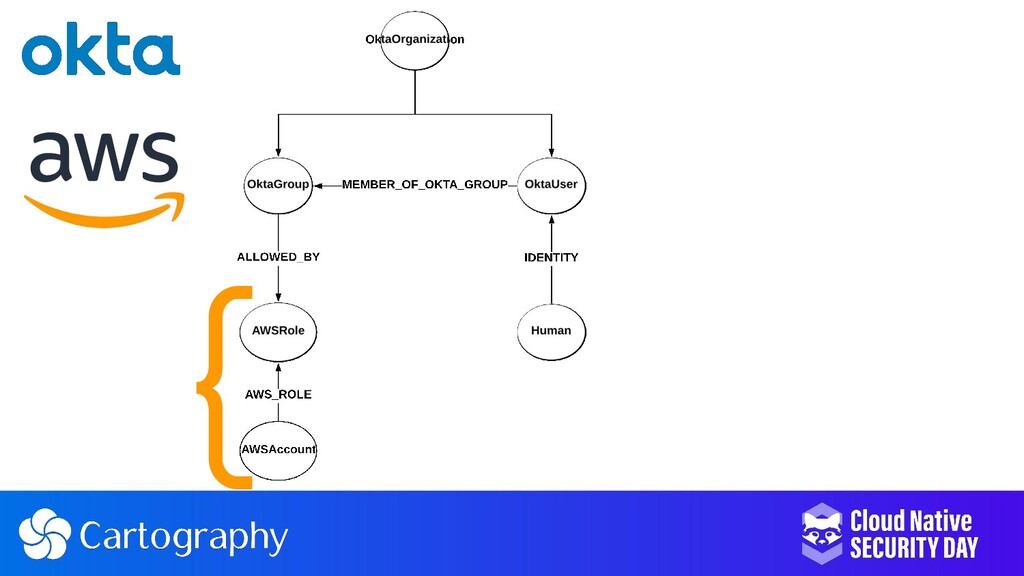
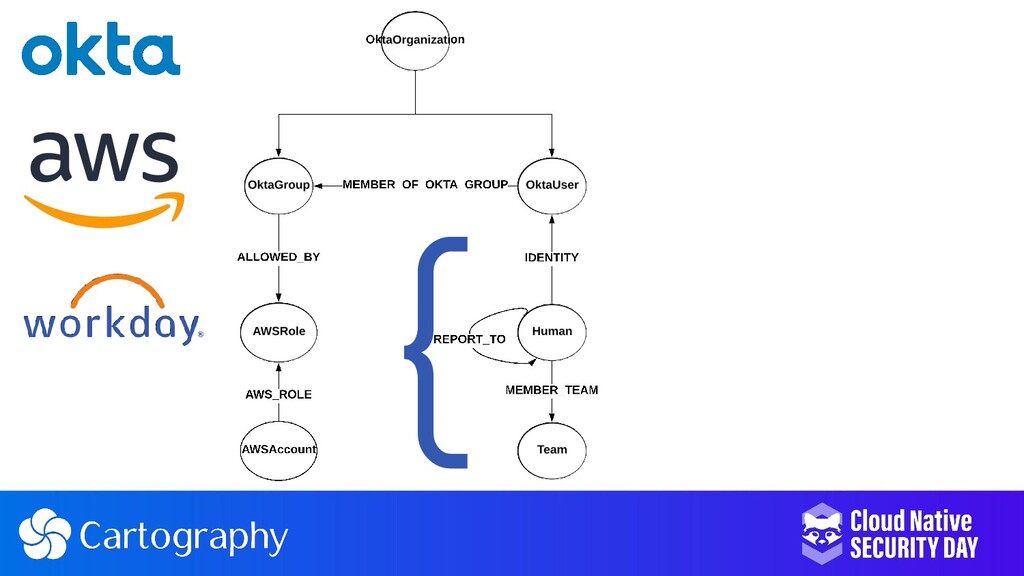
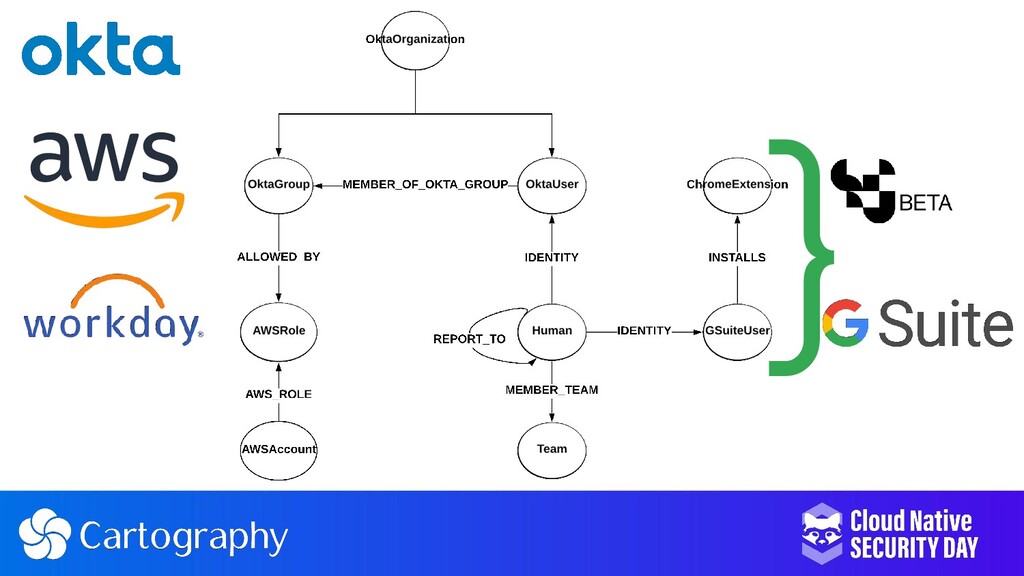
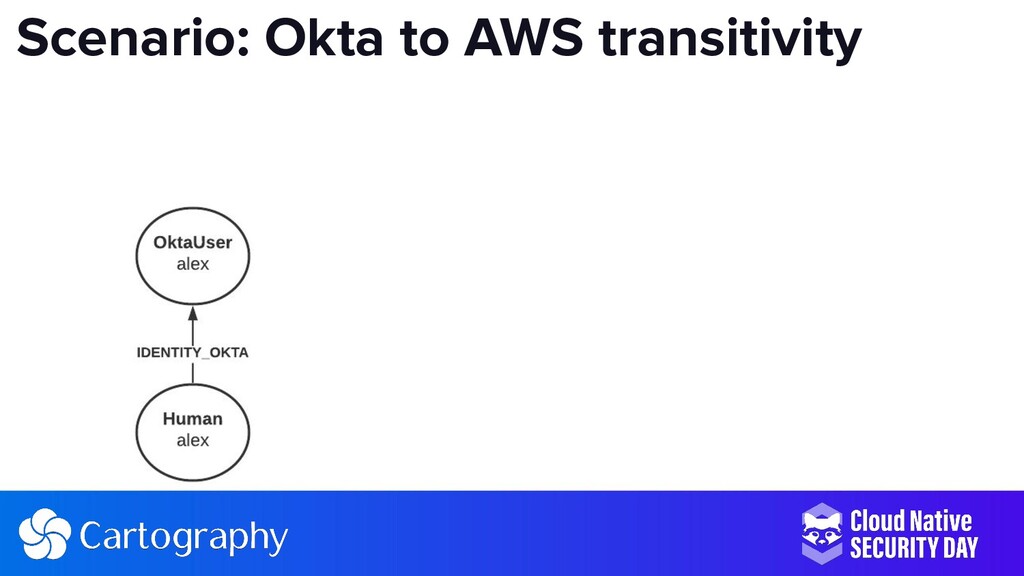
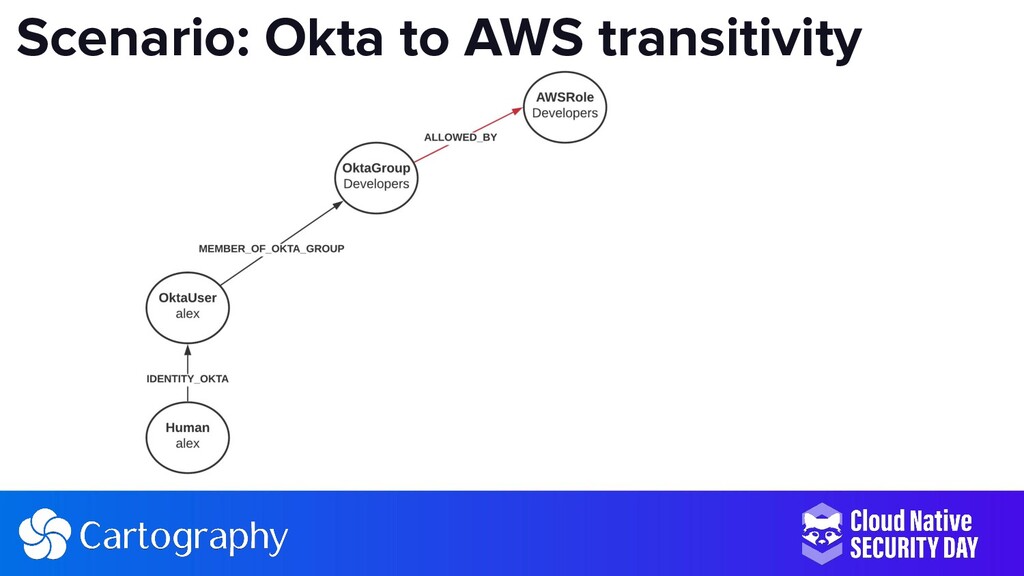
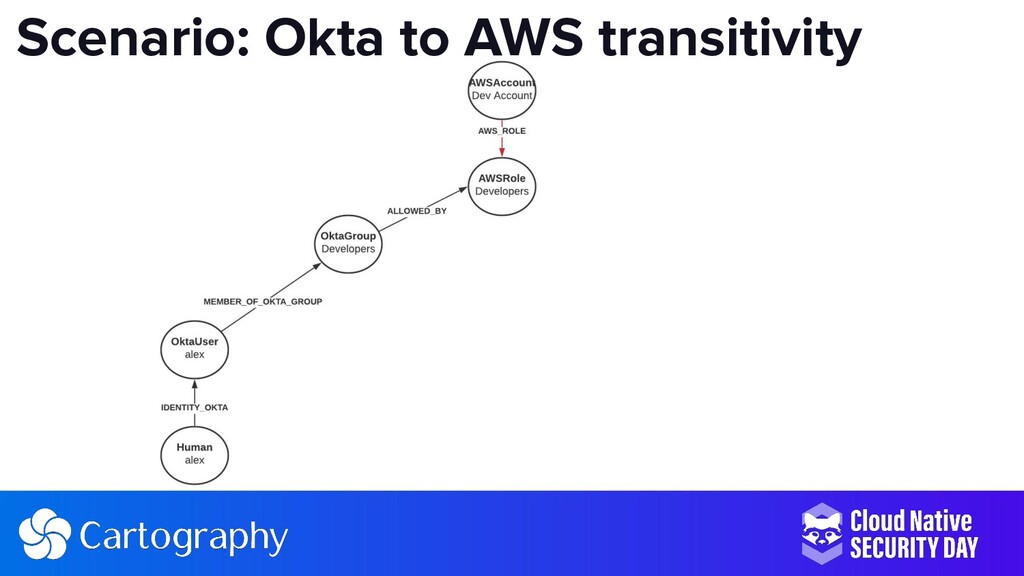
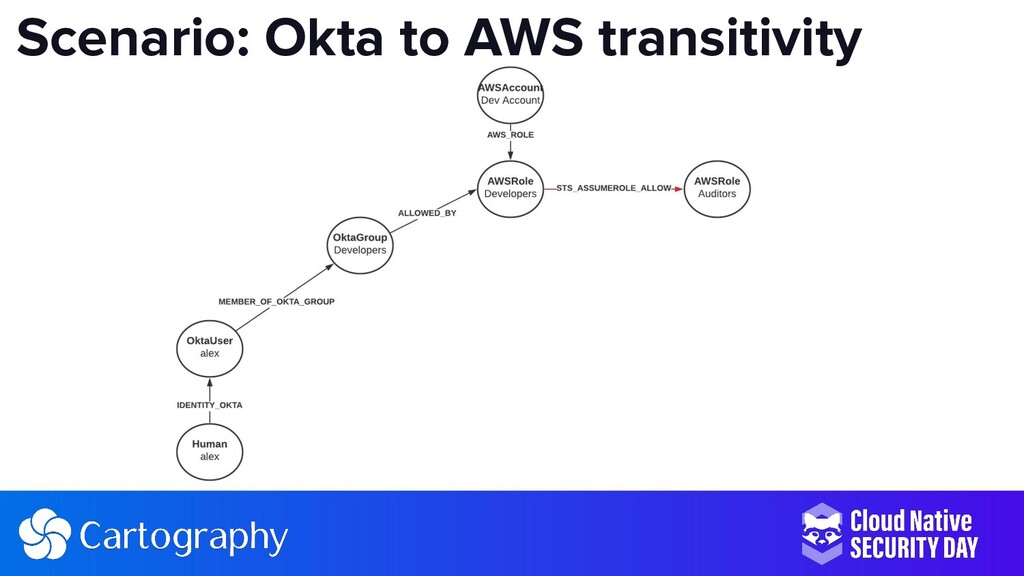
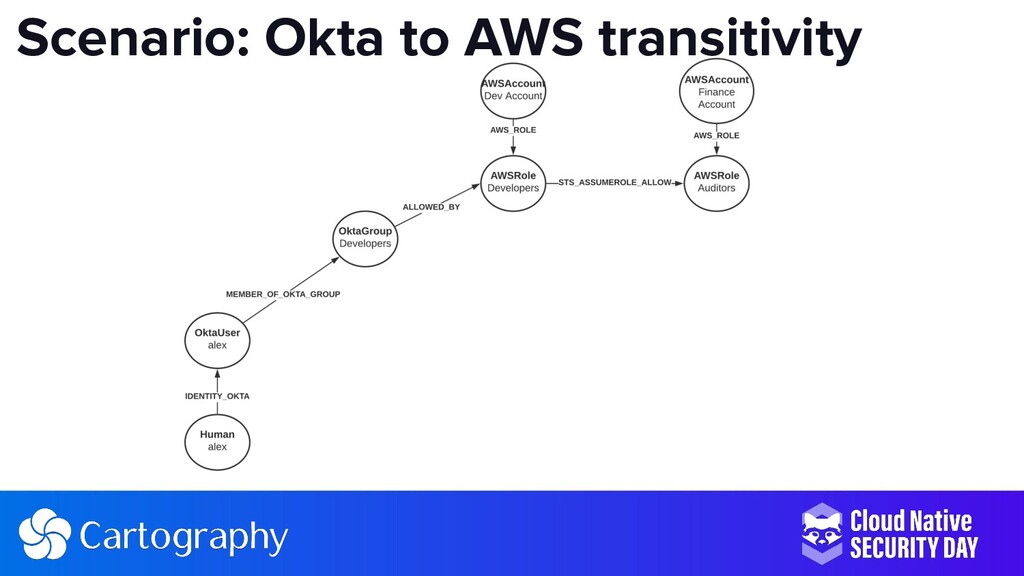
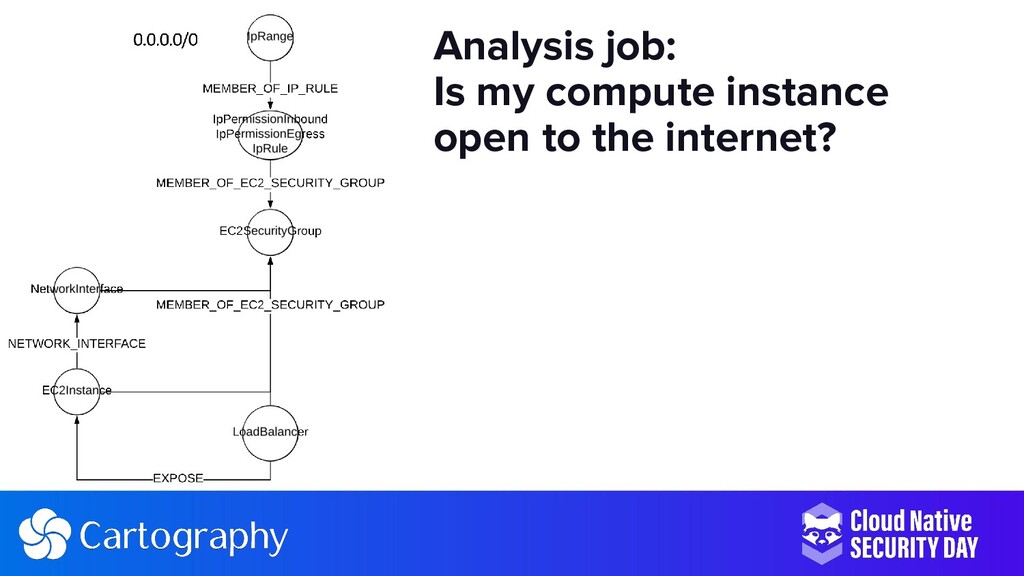
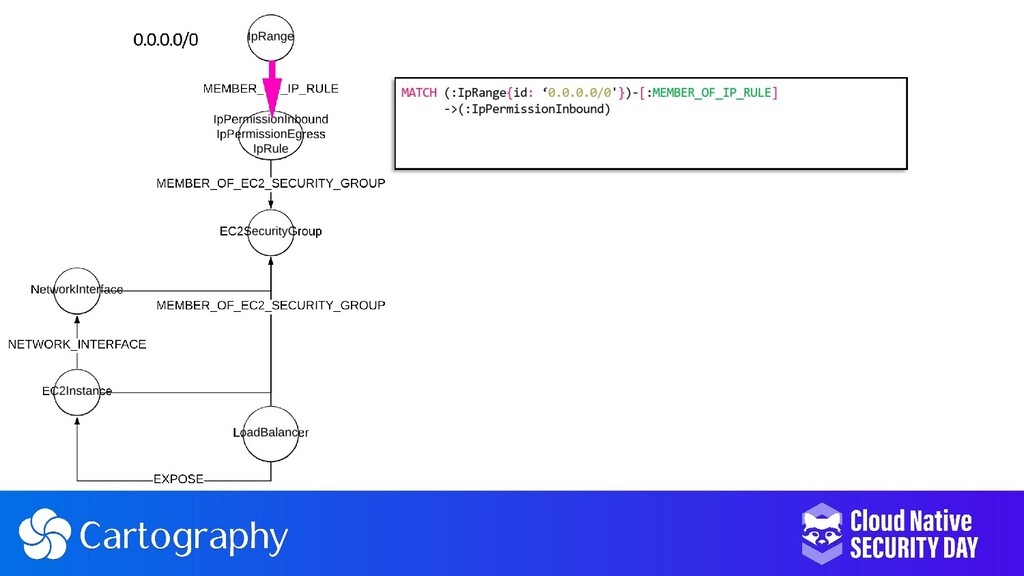
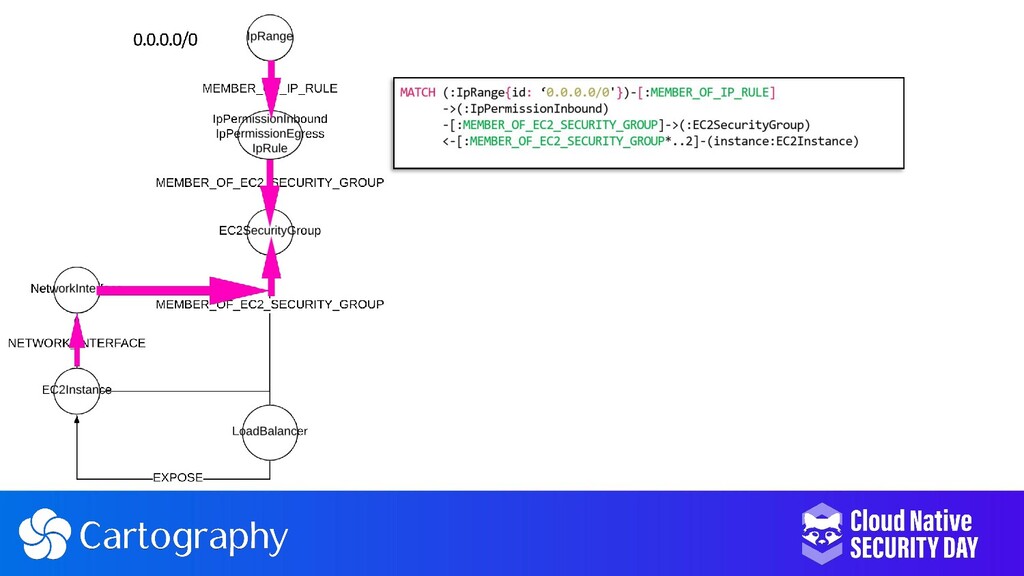
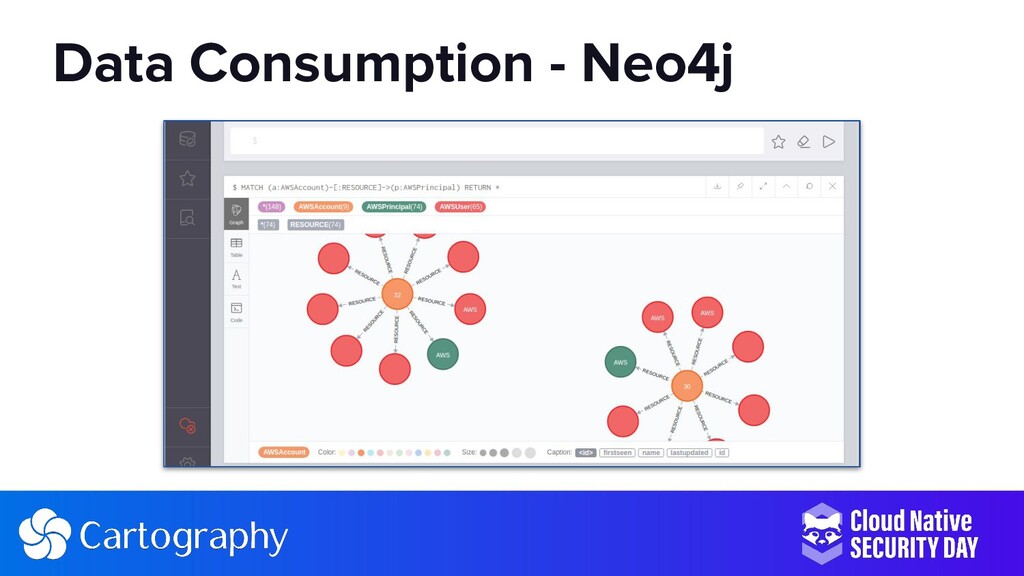
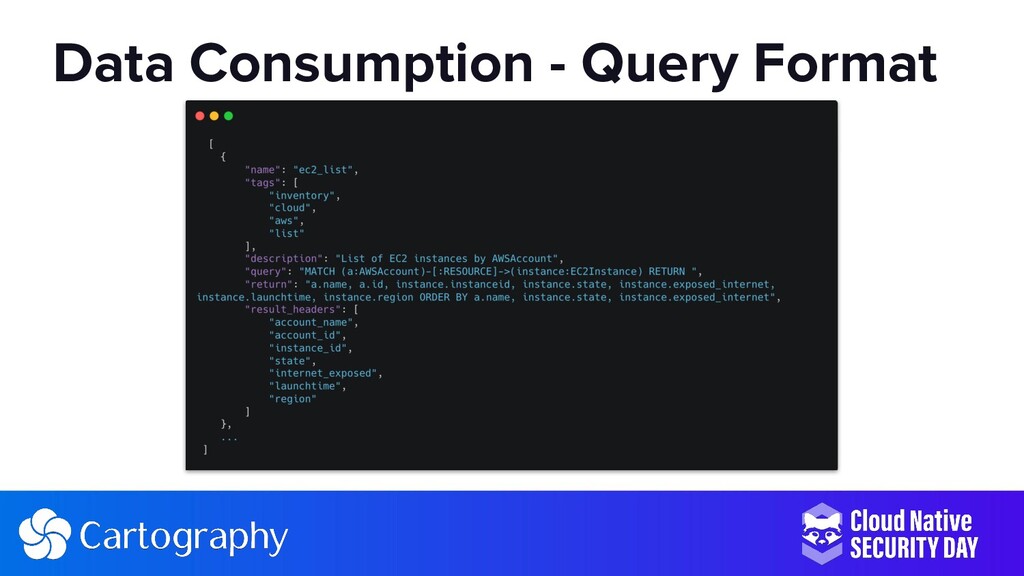
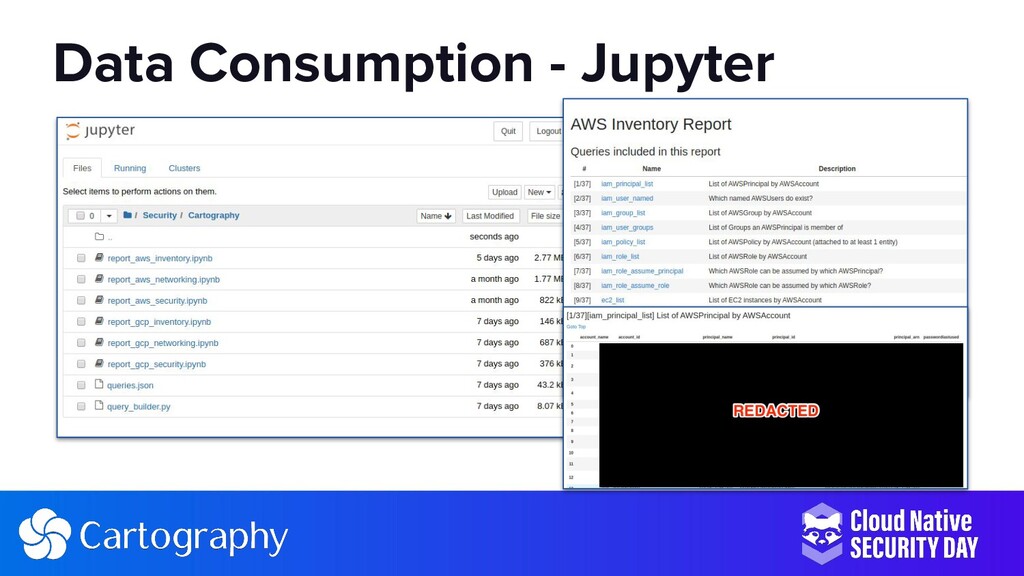
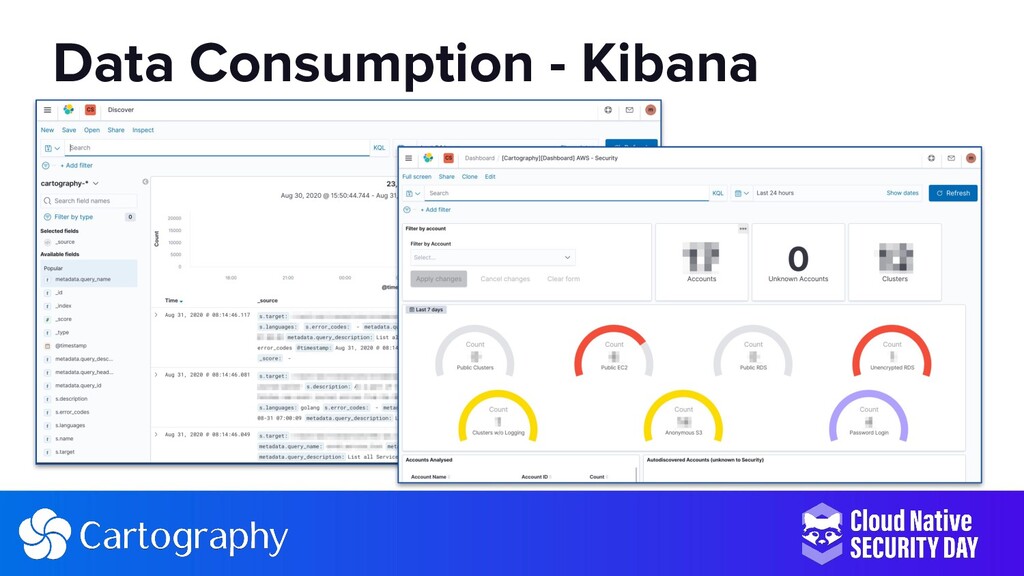
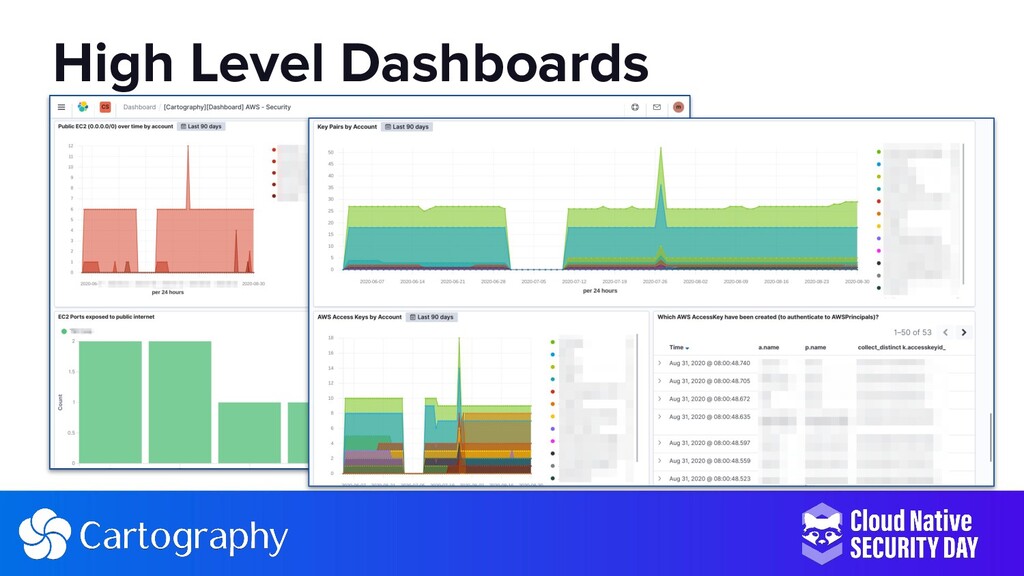
This talk highlights using Cartography (https://github.com/lyft/cartography) to improve and scale security decision-making in cloud-native environments. Attendees of this session will be introduced to the platform and shown a broad set of compelling scenarios including understanding complex permissions relationships, tracking and alerting on infrastructure changes, and enabling teams to see and better understand their security risk regardless of the platforms they use.
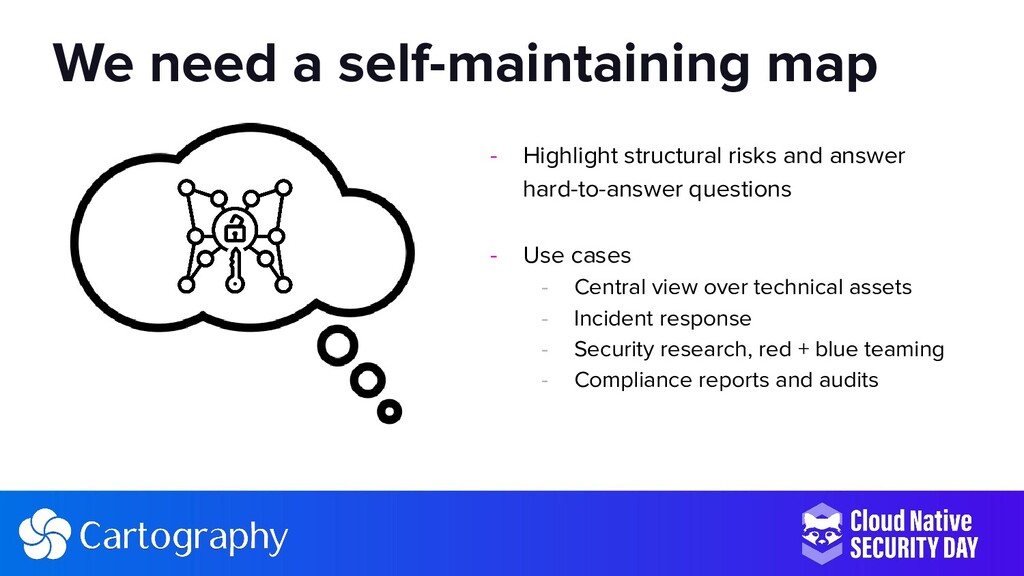
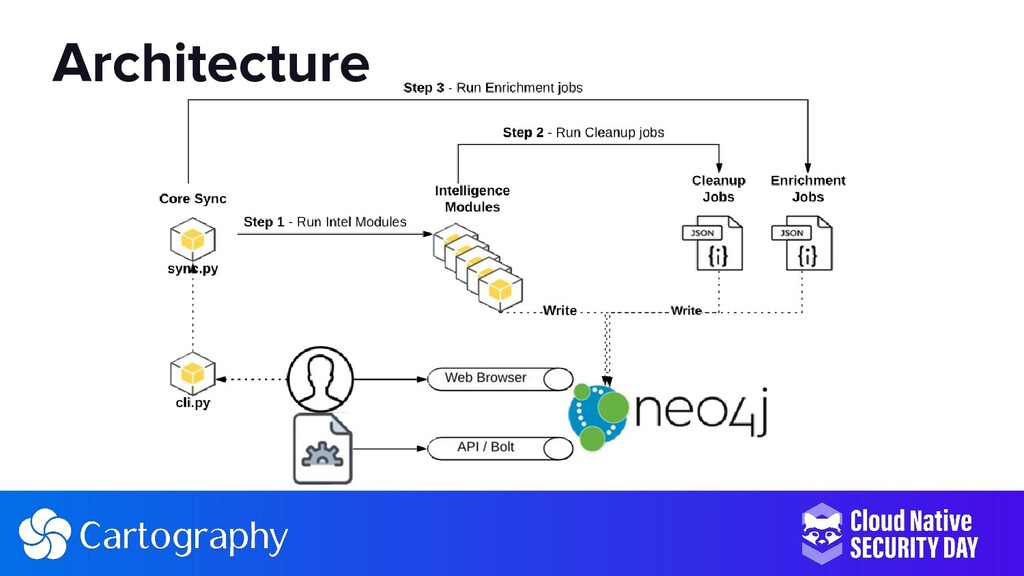
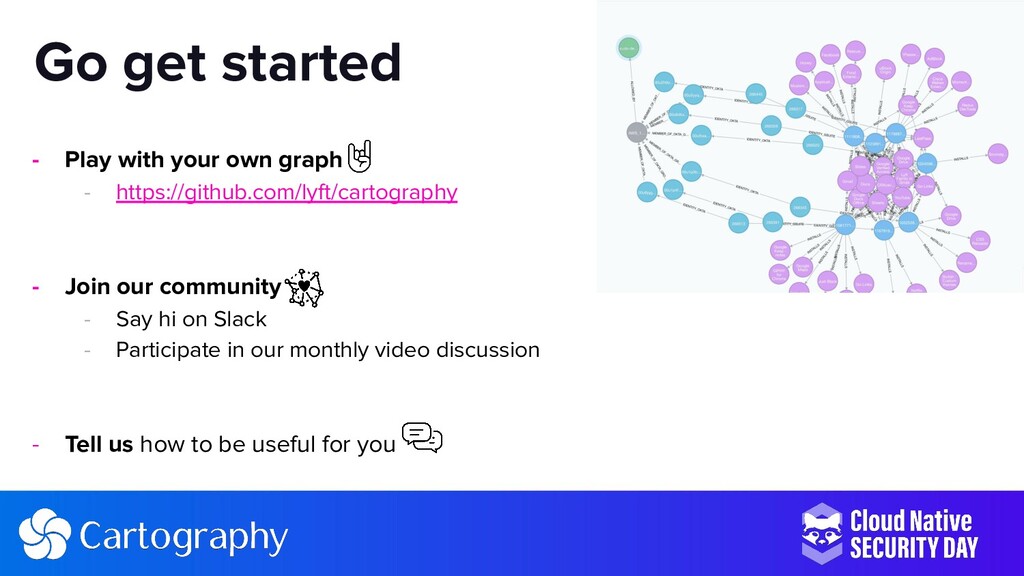
Cartography is a free open-source tool that consolidates your technical assets and the relationships between them in an intuitive graph database.
The presenters hope that sharing their approaches to these problems will help you better understand, categorize, and secure all the assets deployed in your cloud-native organization. They are thrilled to grow the Cartography community in the first couple years as an open source project and look forward to hearing your feedback!