"MONITORINGZ" - software for trending microbial cleanliness and number of airborne particles in clean production areas
MONITORINGZ is a multiuser server-client application designed for input, storage and processing of sampling results for microbial cleanliness and number of airborne particles in clean production areas, usually called “environmental monitoring”.
designed for input, storage and processing of sampling results for microbial cleanliness and number of particles in clean production areas, usually called “environmental monitoring”. Application consists of two parts: database back-end in PostgreSQL server and client front- end interface in MS Access.
report about collected results? • Environmental monitoring of clean production areas belongs to critical GMP requirements in pharmaceutical, food and similar industries. • Sampling on microbial cleanliness and number of airborne particles are obligations prescribed by legal regulative, and as such they are subject of state inspections and inspections of business partners. • By timely sampling and reporting, it is possible to determine contamination in early stages, before end-product quality is questioned. In such way, all possible sources of contamination are timely detected, so that end-product quality is ensured and risk of recall from market is significantly lowered. • Regulative, inspections, as well as internal documentation of companies often require graphical and statistical trending of microbial cleanliness and number of particles in clean areas. • By carefully designed and processed reports you show care for end- product quality and build positive image of your company.
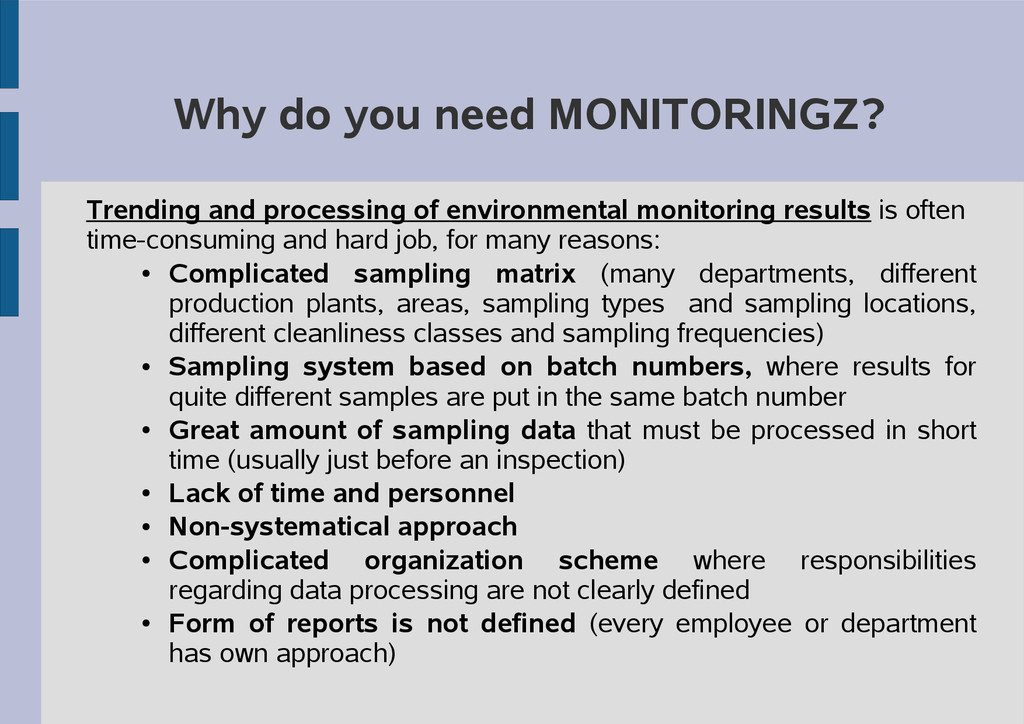
monitoring results is often time-consuming and hard job, for many reasons: • Complicated sampling matrix (many departments, different production plants, areas, sampling types and sampling locations, different cleanliness classes and sampling frequencies) • Sampling system based on batch numbers, where results for quite different samples are put in the same batch number • Great amount of sampling data that must be processed in short time (usually just before an inspection) • Lack of time and personnel • Non-systematical approach • Complicated organization scheme where responsibilities regarding data processing are not clearly defined • Form of reports is not defined (every employee or department has own approach)
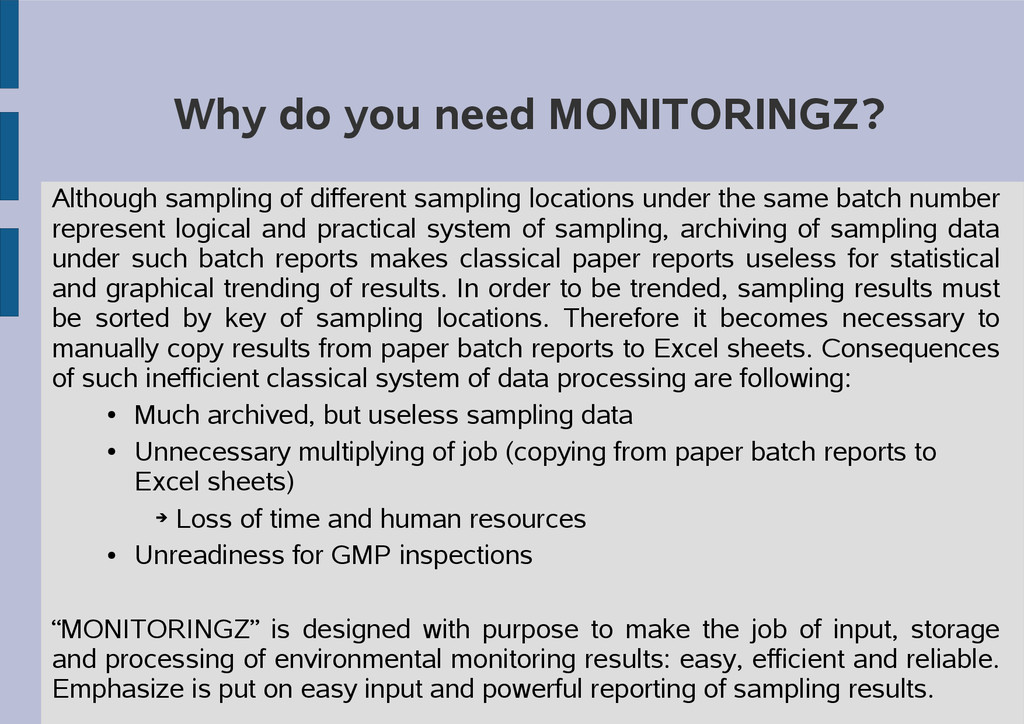
locations under the same batch number represent logical and practical system of sampling, archiving of sampling data under such batch reports makes classical paper reports useless for statistical and graphical trending of results. In order to be trended, sampling results must be sorted by key of sampling locations. Therefore it becomes necessary to manually copy results from paper batch reports to Excel sheets. Consequences of such inefficient classical system of data processing are following: • Much archived, but useless sampling data • Unnecessary multiplying of job (copying from paper batch reports to Excel sheets) ➔ Loss of time and human resources • Unreadiness for GMP inspections “MONITORINGZ” is designed with purpose to make the job of input, storage and processing of environmental monitoring results: easy, efficient and reliable. Emphasize is put on easy input and powerful reporting of sampling results.
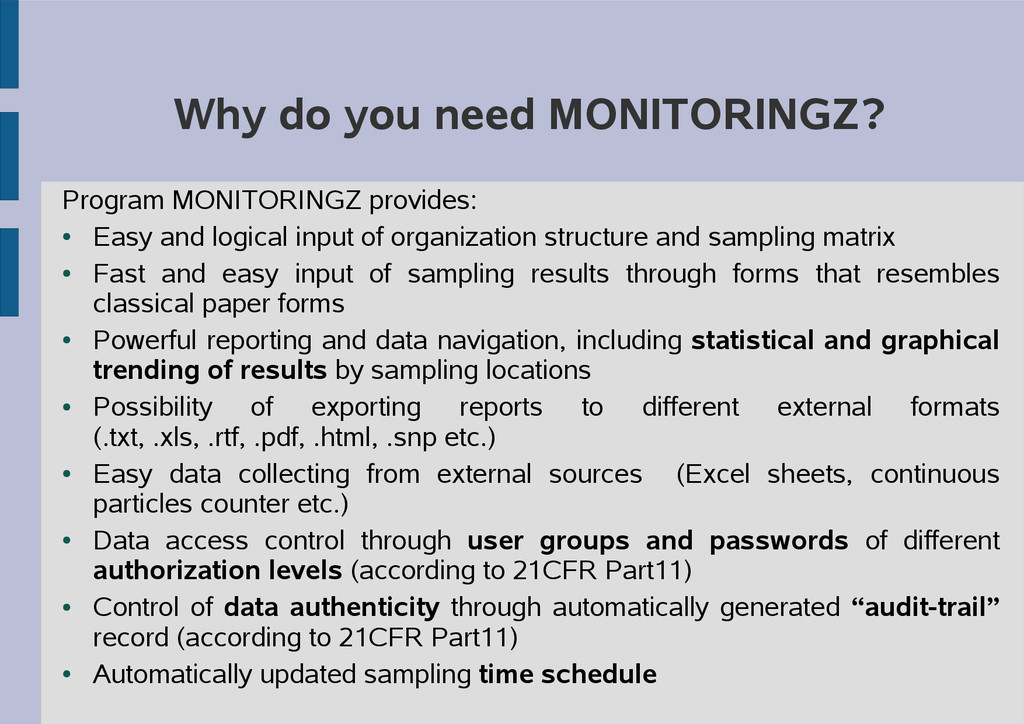
and logical input of organization structure and sampling matrix • Fast and easy input of sampling results through forms that resembles classical paper forms • Powerful reporting and data navigation, including statistical and graphical trending of results by sampling locations • Possibility of exporting reports to different external formats (.txt, .xls, .rtf, .pdf, .html, .snp etc.) • Easy data collecting from external sources (Excel sheets, continuous particles counter etc.) • Data access control through user groups and passwords of different authorization levels (according to 21CFR Part11) • Control of data authenticity through automatically generated “audit-trail” record (according to 21CFR Part11) • Automatically updated sampling time schedule
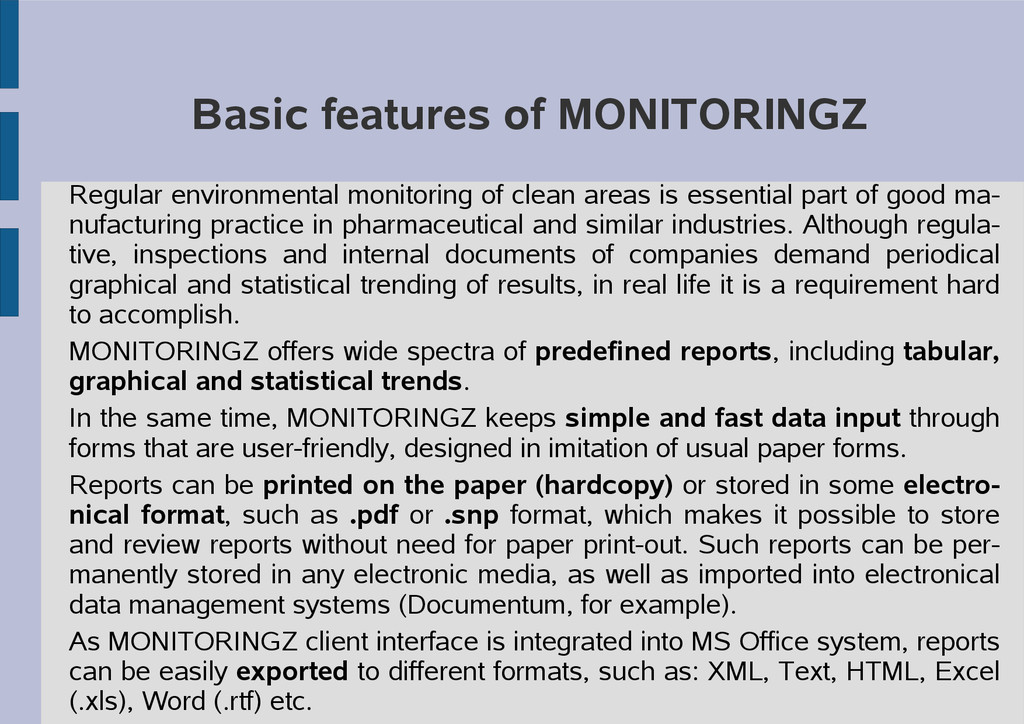
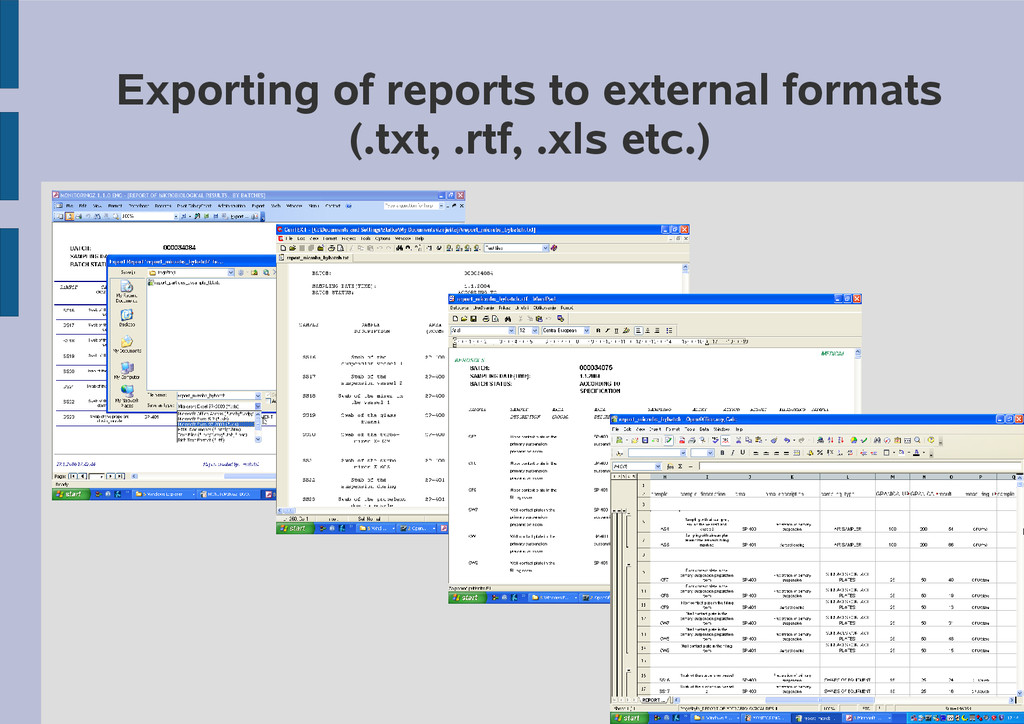
is essential part of good ma- nufacturing practice in pharmaceutical and similar industries. Although regula- tive, inspections and internal documents of companies demand periodical graphical and statistical trending of results, in real life it is a requirement hard to accomplish. MONITORINGZ offers wide spectra of predefined reports, including tabular, graphical and statistical trends. In the same time, MONITORINGZ keeps simple and fast data input through forms that are user-friendly, designed in imitation of usual paper forms. Reports can be printed on the paper (hardcopy) or stored in some electro- nical format, such as .pdf or .snp format, which makes it possible to store and review reports without need for paper print-out. Such reports can be per- manently stored in any electronic media, as well as imported into electronical data management systems (Documentum, for example). As MONITORINGZ client interface is integrated into MS Office system, reports can be easily exported to different formats, such as: XML, Text, HTML, Excel (.xls), Word (.rtf) etc.
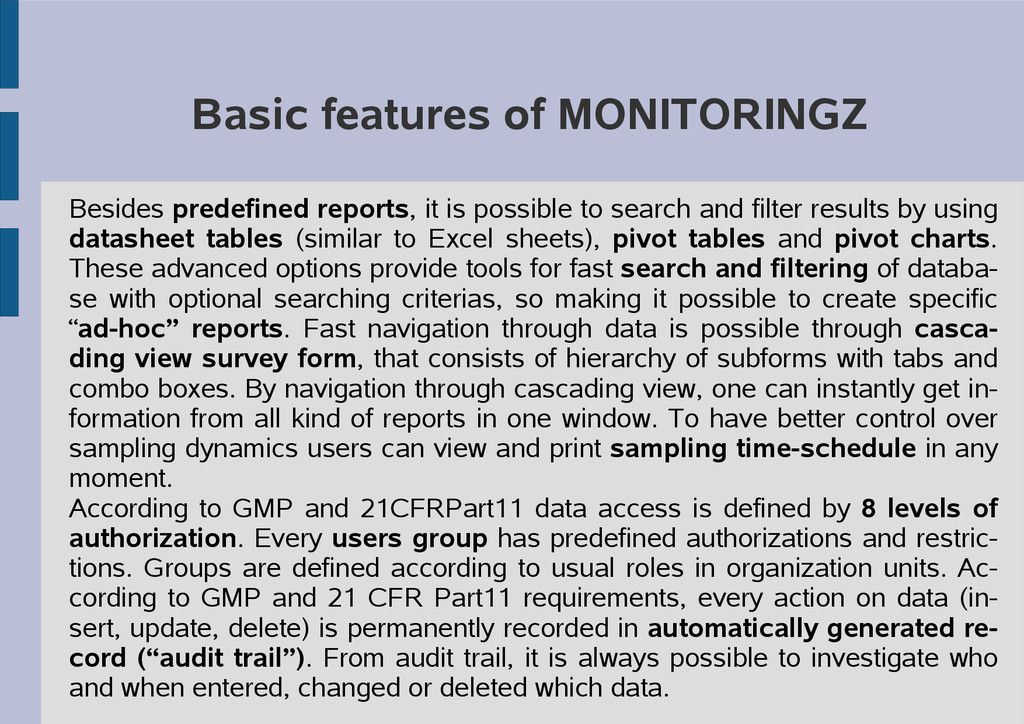
to search and filter results by using datasheet tables (similar to Excel sheets), pivot tables and pivot charts. These advanced options provide tools for fast search and filtering of databa- se with optional searching criterias, so making it possible to create specific “ad-hoc” reports. Fast navigation through data is possible through casca- ding view survey form, that consists of hierarchy of subforms with tabs and combo boxes. By navigation through cascading view, one can instantly get in- formation from all kind of reports in one window. To have better control over sampling dynamics users can view and print sampling time-schedule in any moment. According to GMP and 21CFRPart11 data access is defined by 8 levels of authorization. Every users group has predefined authorizations and restric- tions. Groups are defined according to usual roles in organization units. Ac- cording to GMP and 21 CFR Part11 requirements, every action on data (in- sert, update, delete) is permanently recorded in automatically generated re- cord (“audit trail”). From audit trail, it is always possible to investigate who and when entered, changed or deleted which data.
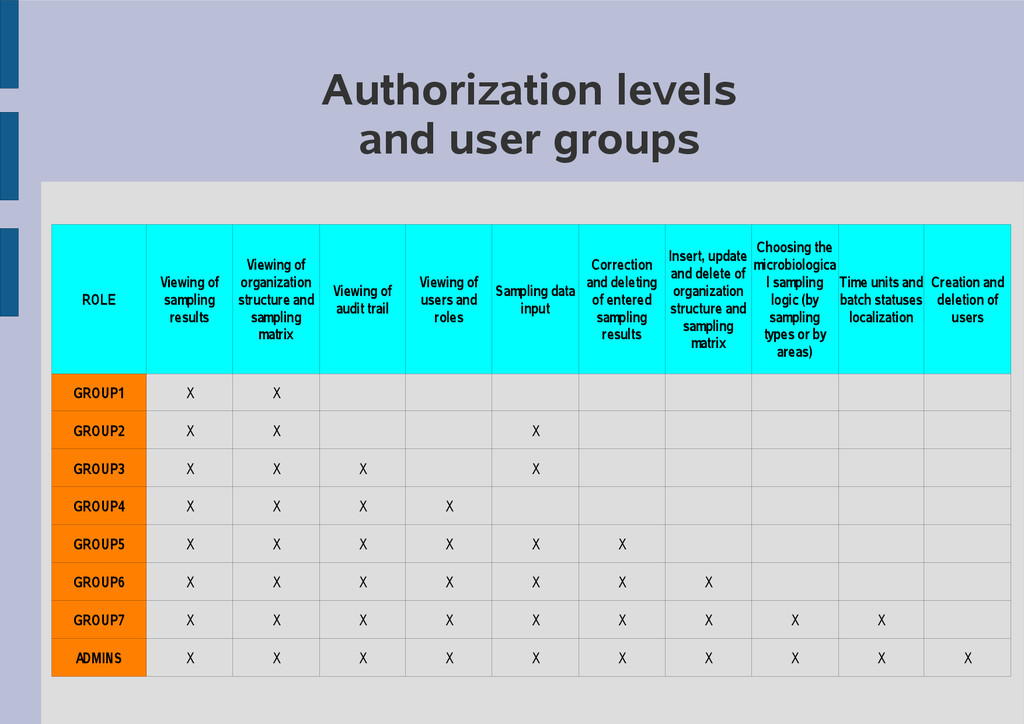
X X X GROUP3 X X X X GROUP4 X X X X GROUP5 X X X X X X GROUP6 X X X X X X X GROUP7 X X X X X X X X X ADMINS X X X X X X X X X X Viewing of sampling results Viewing of organization structure and sampling matrix Viewing of audit trail Viewing of users and roles Sampling data input Correction and deleting of entered sampling results Insert, update and delete of organization structure and sampling matrix Choosing the microbiologica l sampling logic (by sampling types or by areas) Time units and batch statuses localization Creation and deletion of users
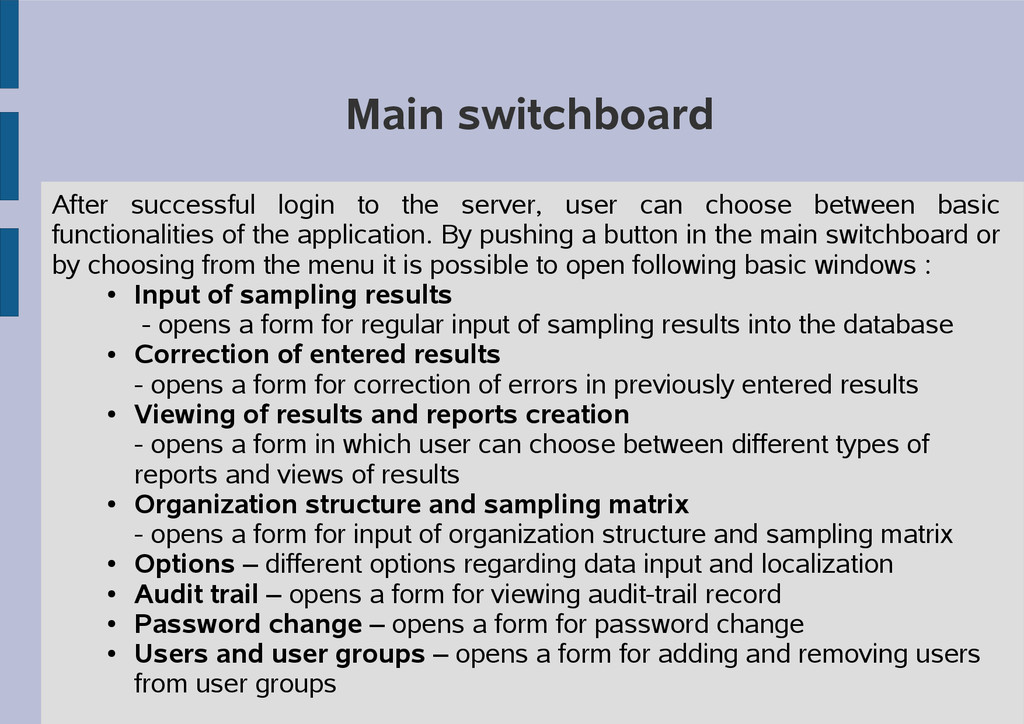
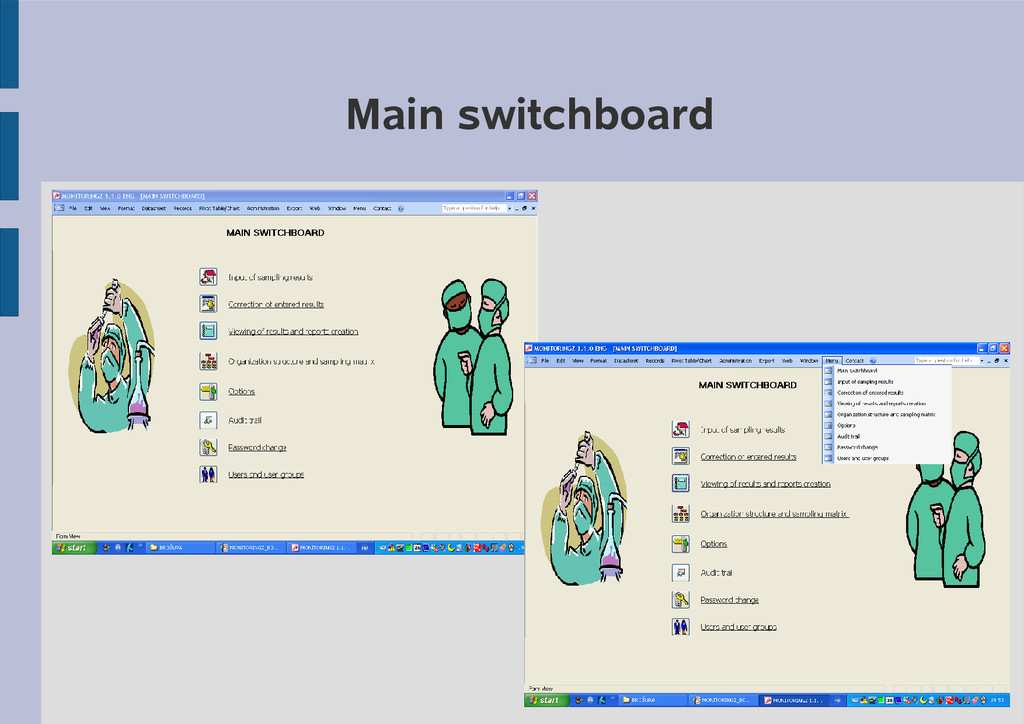
choose between basic functionalities of the application. By pushing a button in the main switchboard or by choosing from the menu it is possible to open following basic windows : • Input of sampling results - opens a form for regular input of sampling results into the database • Correction of entered results - opens a form for correction of errors in previously entered results • Viewing of results and reports creation - opens a form in which user can choose between different types of reports and views of results • Organization structure and sampling matrix - opens a form for input of organization structure and sampling matrix • Options – different options regarding data input and localization • Audit trail – opens a form for viewing audit-trail record • Password change – opens a form for password change • Users and user groups – opens a form for adding and removing users from user groups
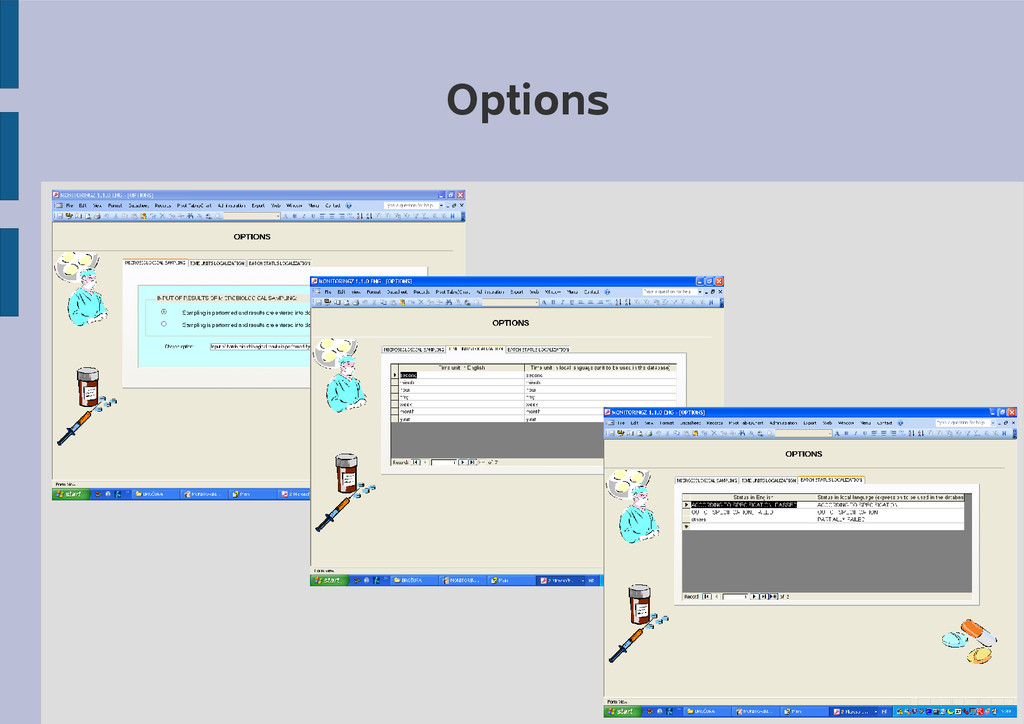
program, some options important for normal functioning of the application must be defined. The Options window consists of three tabs: • Input of microbial sampling results ➢ An authorized person chooses whether batch microbial sampling results will be entered into the database on the basis of sampling types or on the basis of production areas (rooms). • Localization of time units ➢ In this tab, an authorized person translates time units from English to corresponding expressions in the local language. • Localization of batch status expressions ➢ An authorized person translates English expressions for status of batch results to corresponding expressions in the local language.
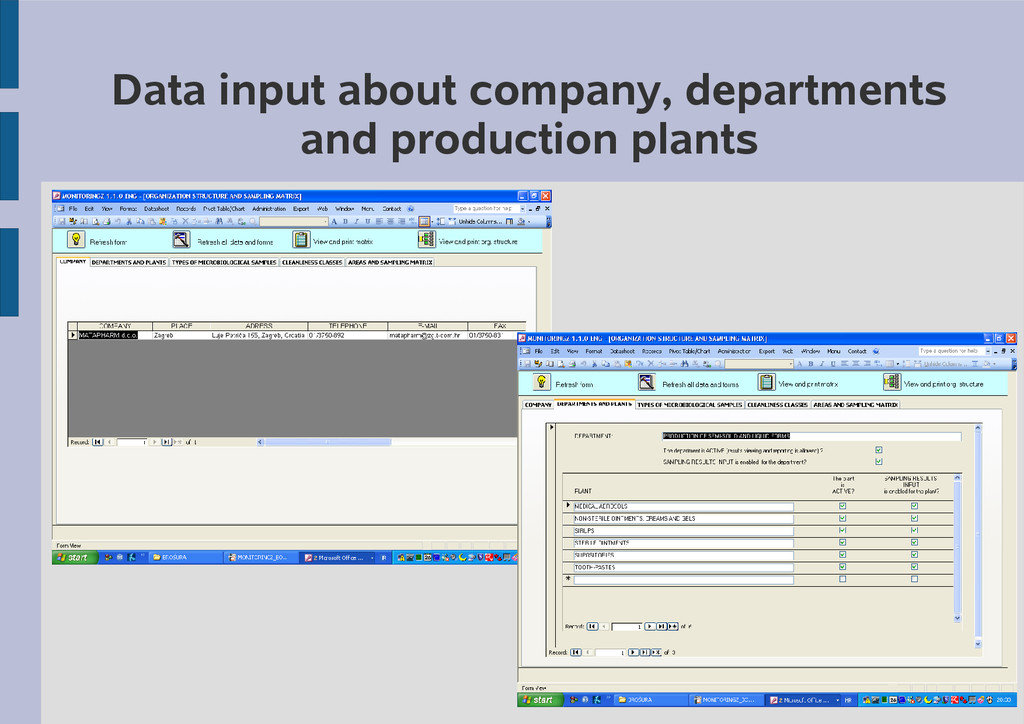
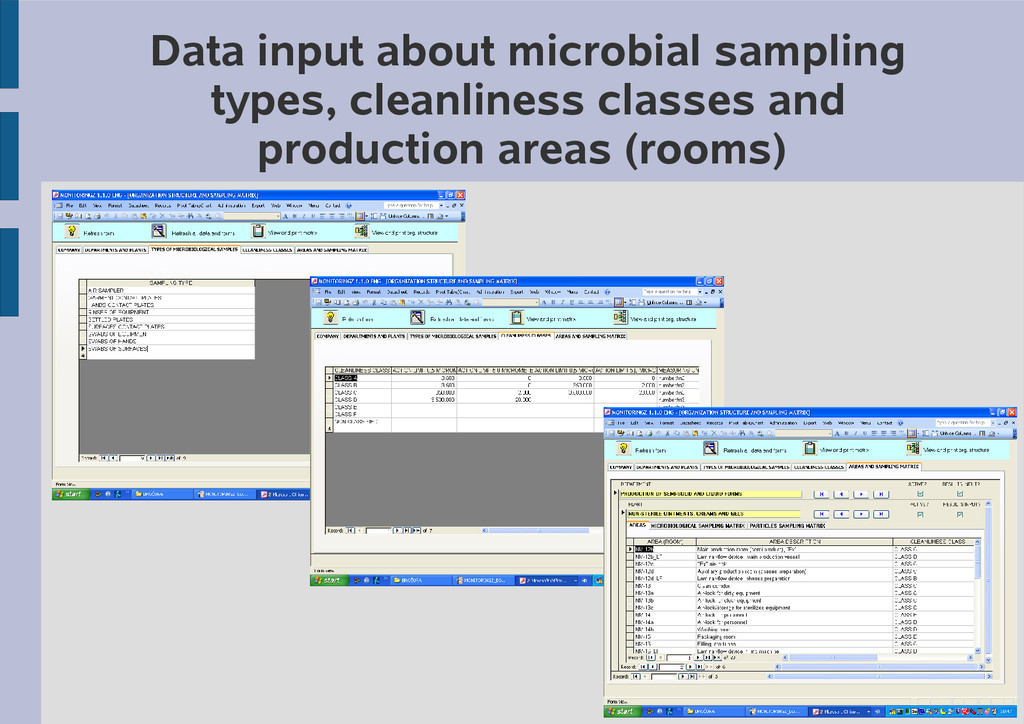
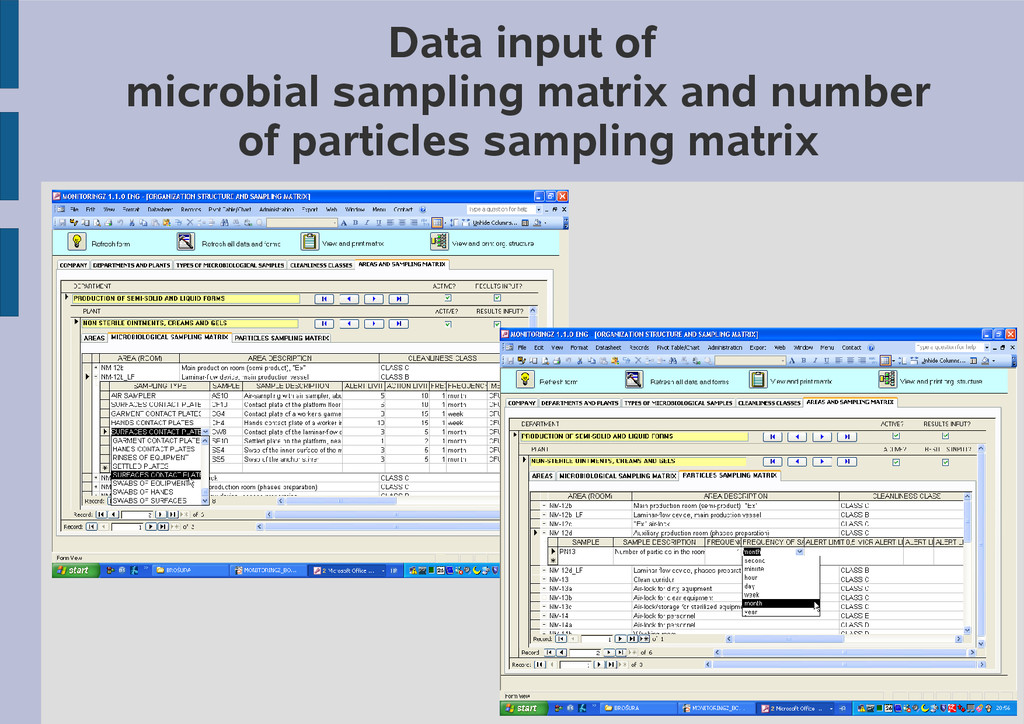
regular input of sampling results and reports creation, organization structure and sampling matrix must be defined. Therefore we must first input data about sampling matrix, including all relevant data about sampling locations, sampling frequency, alert and action limits. Through appropriate form for input of organization structure and sampling matrix, an authorized person enters data about company, departments, production plants, production areas (rooms), microbial sampling types and cleanliness classes. Finally, an authorized person enters sampling matrix for microbial sampling and sampling of particles.
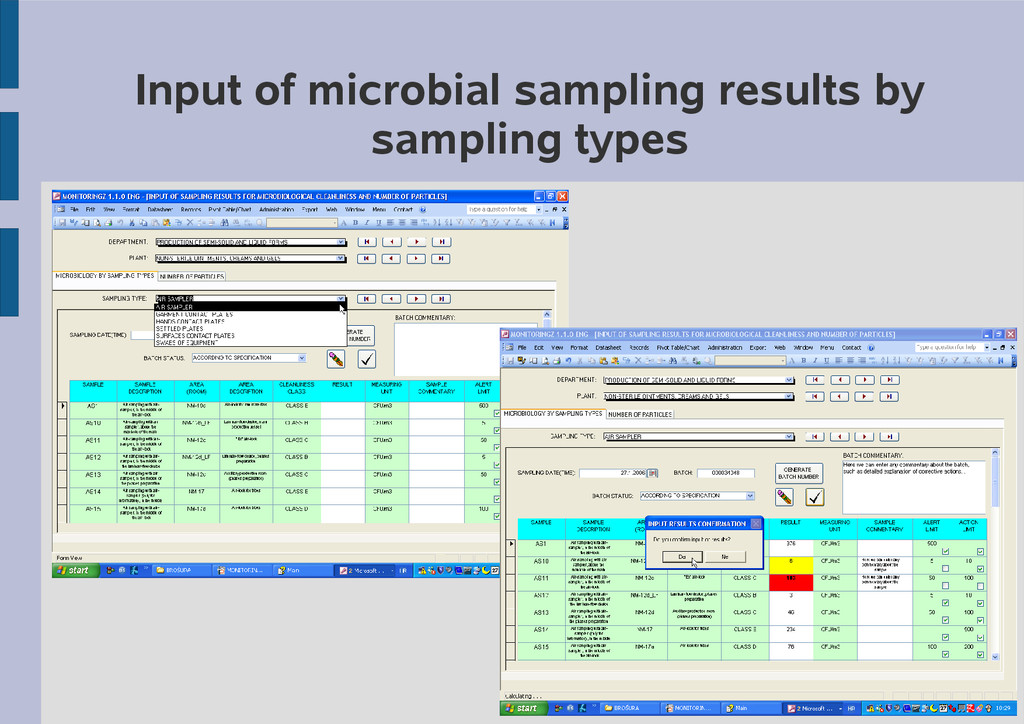
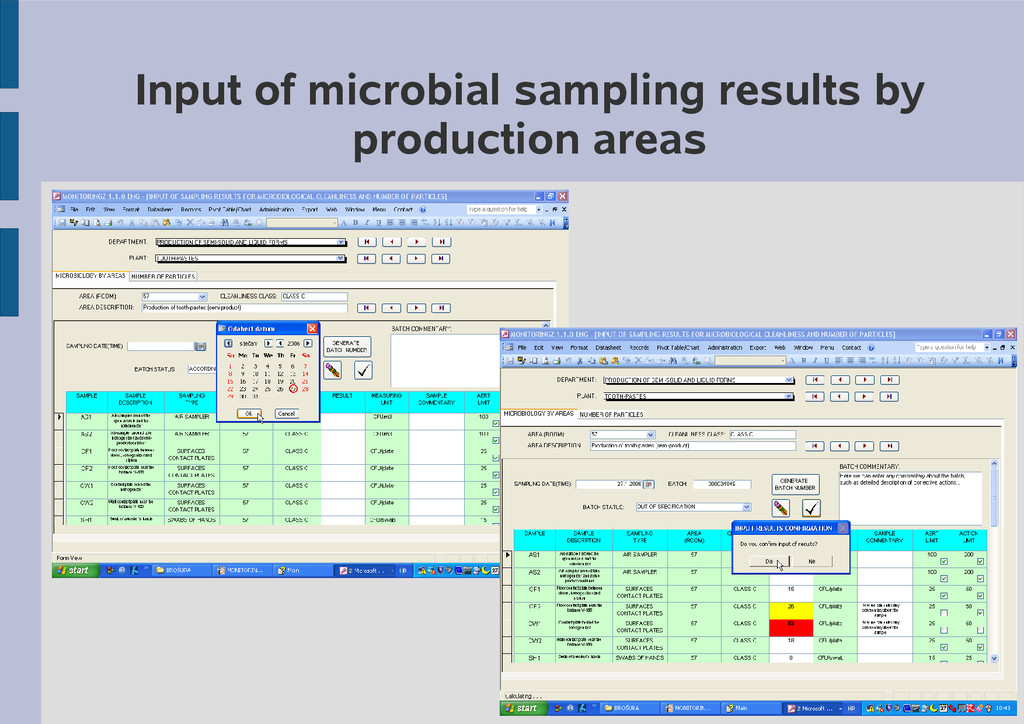
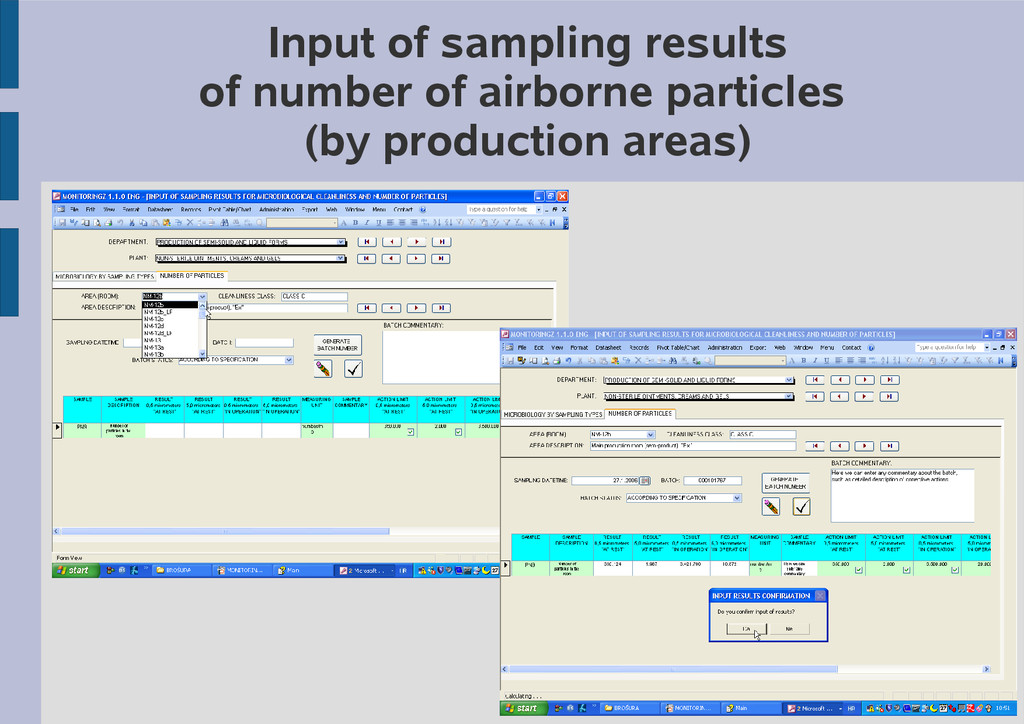
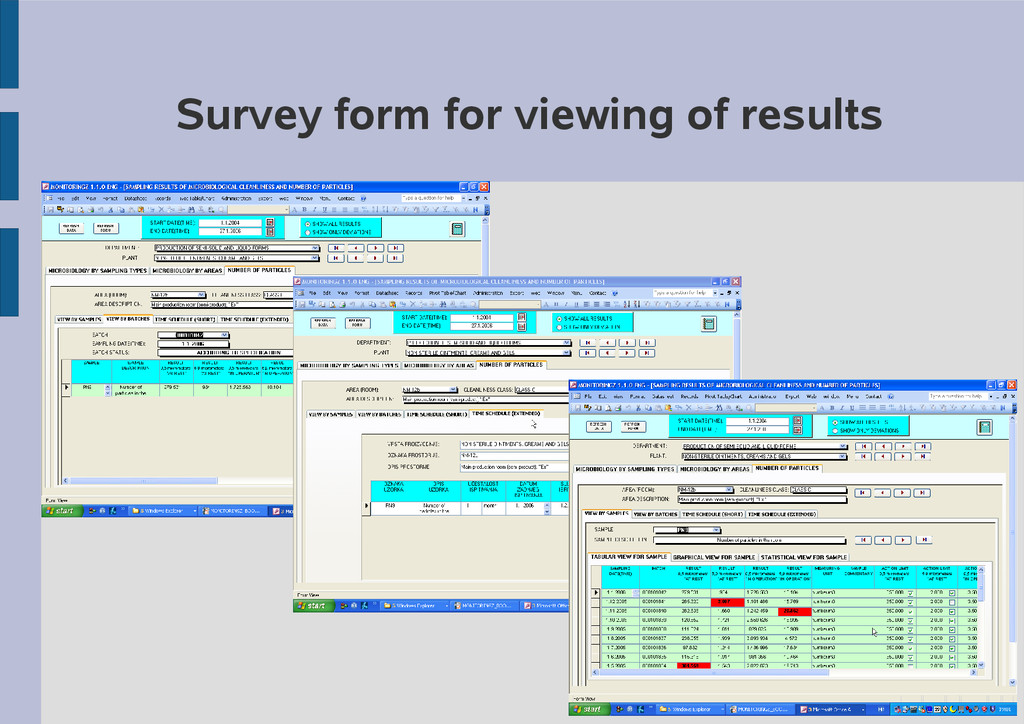
simple and user-friendly. Through appropriate combo boxes, user chooses department, production plant and sampling type or production area (room) where sampling is taking place. A form for data input then appears. The form is based on the values in combo boxes and data in sampling matrix. It consists of two tabs: • Input of microbial sampling results (depending on the chosen option, batch data input can be organized on the basis of sampling types or on the basis of production rooms) • Input of sampling results of number of particles in the air
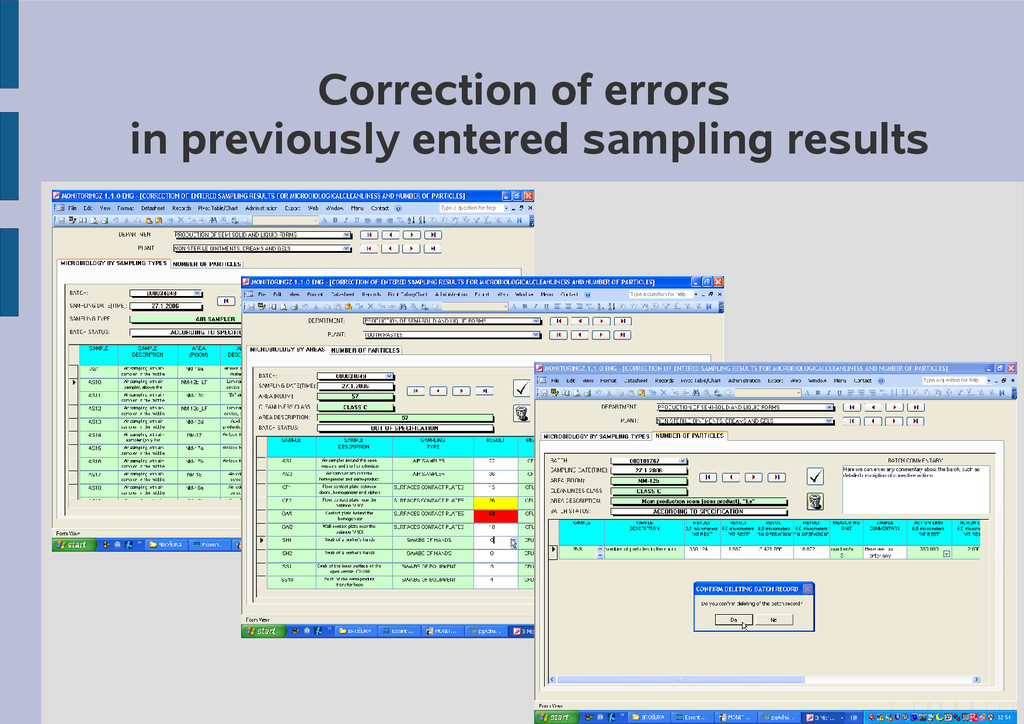
regularly input sampling results can unintentionally make a mistake. Once they confirmed data input, members of these user groups can do nothing to correct the error. According to GMP and 21 CFR Part11, it is required that a user of the higher authorization level corrects the error. Members of the higher level authorizations user groups should be persons that are ordinated to operators that perform regular data input. According to 21 CFR Part11, audit trail keeps originally entered data, as well as any later update or deletion. Also, audit trail records time stamp and user name of the user that entered, changed or deleted data. From audit-trail, it is always possible to examine who and when entered, changed or deleted which data. An authorized user can correct and delete entered batch sampling data, through the window for correction of results.
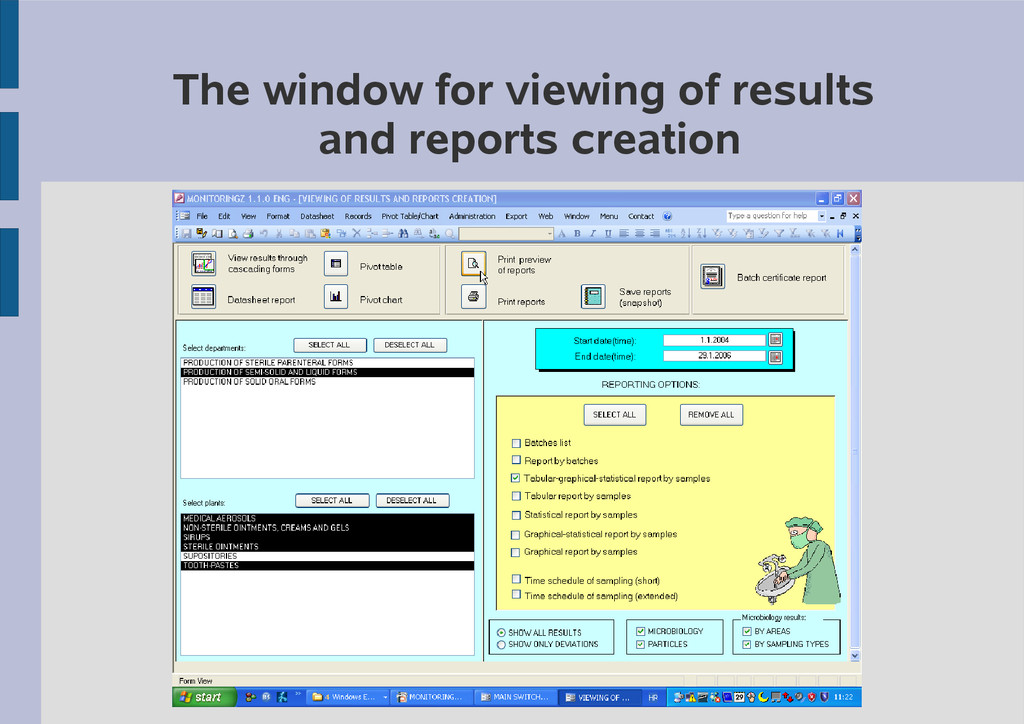
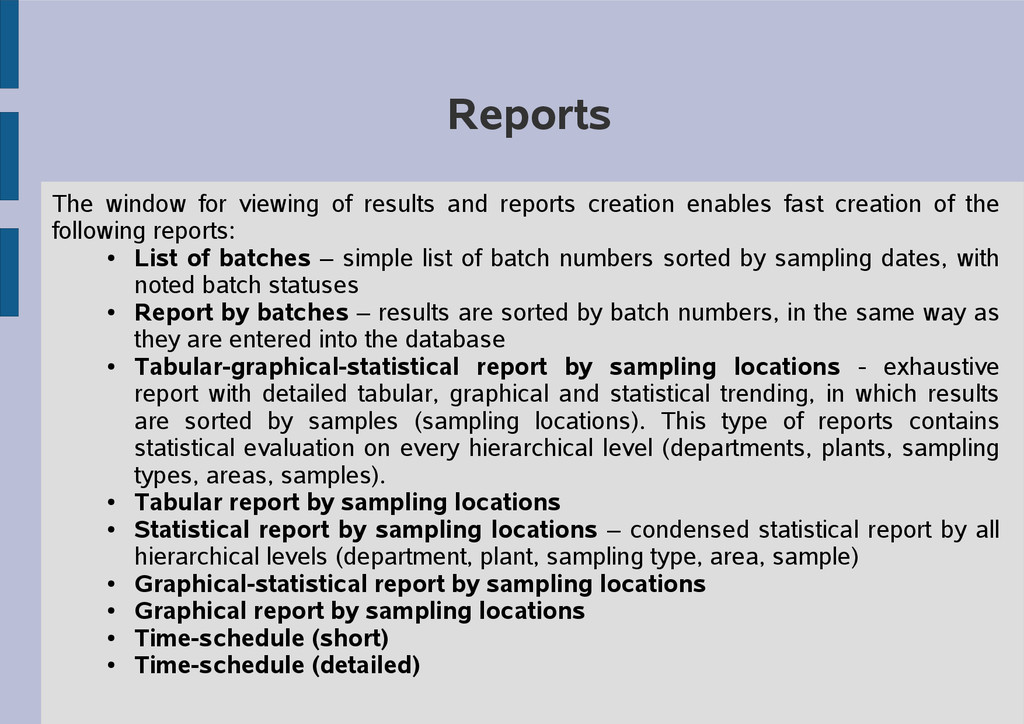
database become useful only when processed in form of thoughtful report. Therefore MONITORINGZ provides fast and efficient data processing of sampling results through predefined reports and views, including tabular, graphical and statistical processing of sampling results. Reports are created through a form in which user chooses departments and plants to be included in reports, start and end date, report type, as well as option of showing all results or only deviations. Reports can be printed out on paper or can be saved in some protected electronic format (.snp or .pdf format). This enables electronic storage and later viewing of reports without necessity for printing on paper. Saved reports can be stored in any electronic media, as well as imported into system for electronic management of documentation, such as Documentum. On account of being integrated into MS Office system, reports can be exported to different formats, such as: Text, HTML, Excel, Word etc.
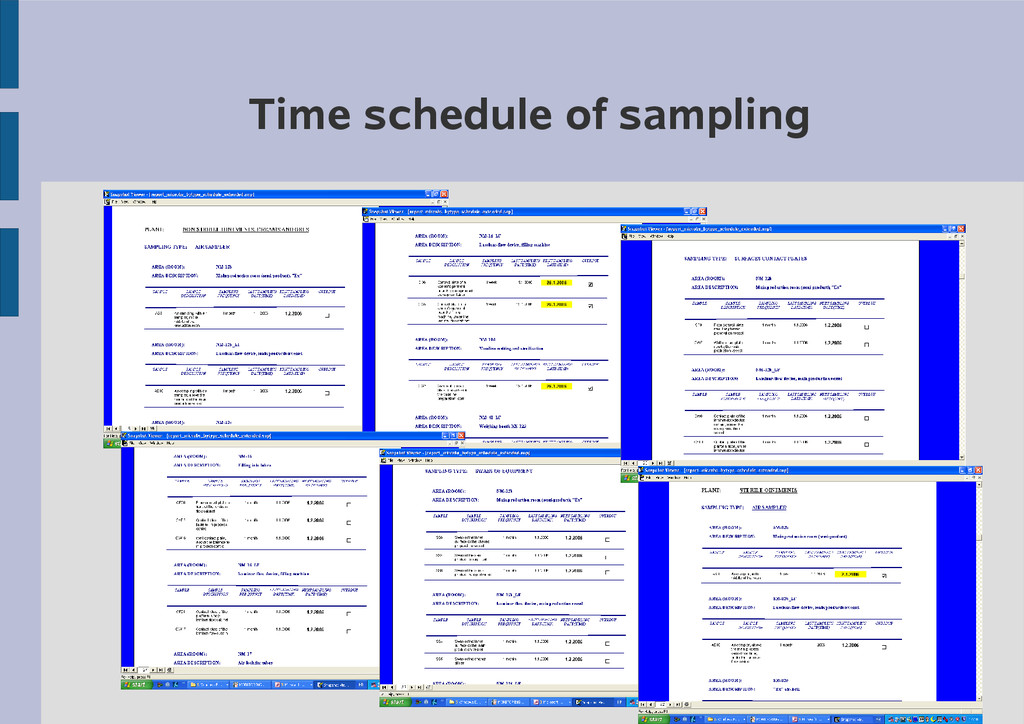
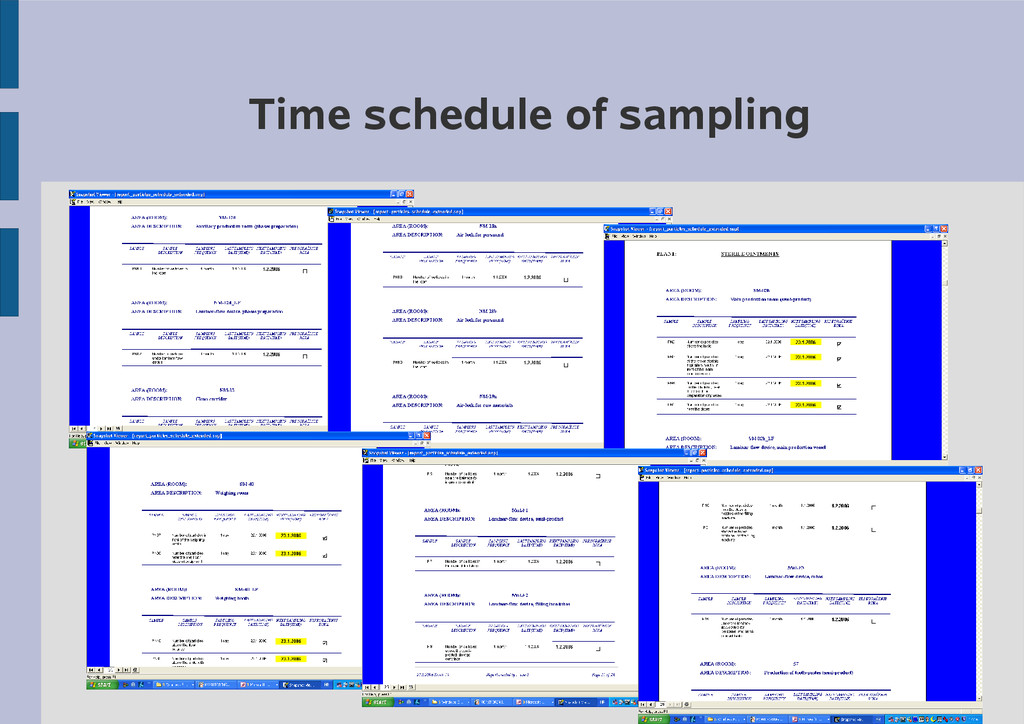
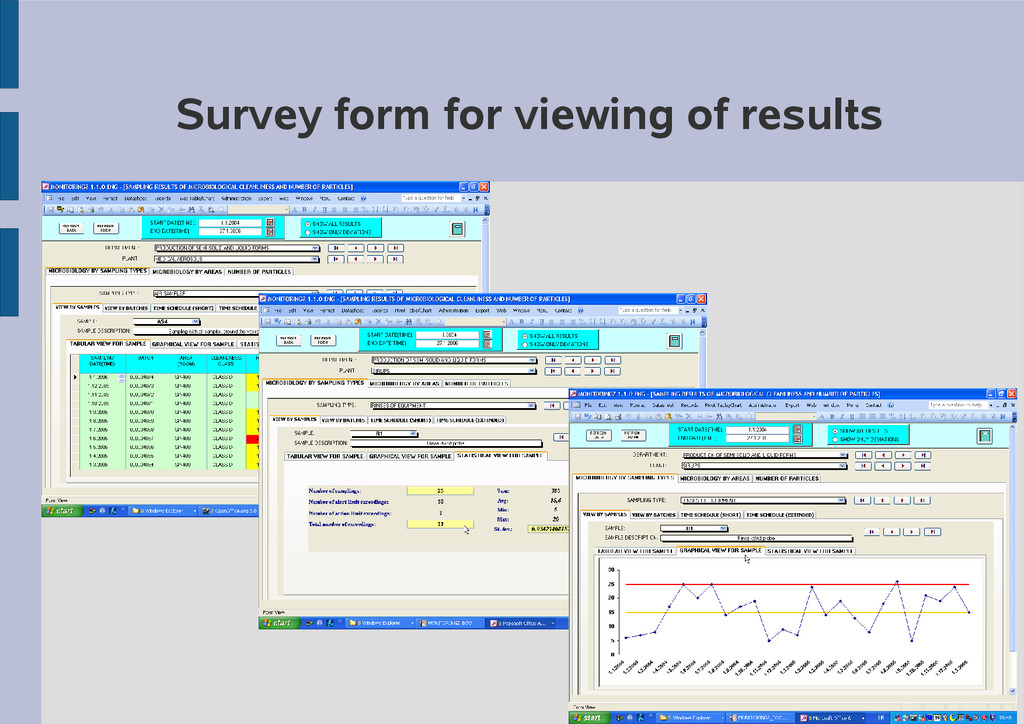
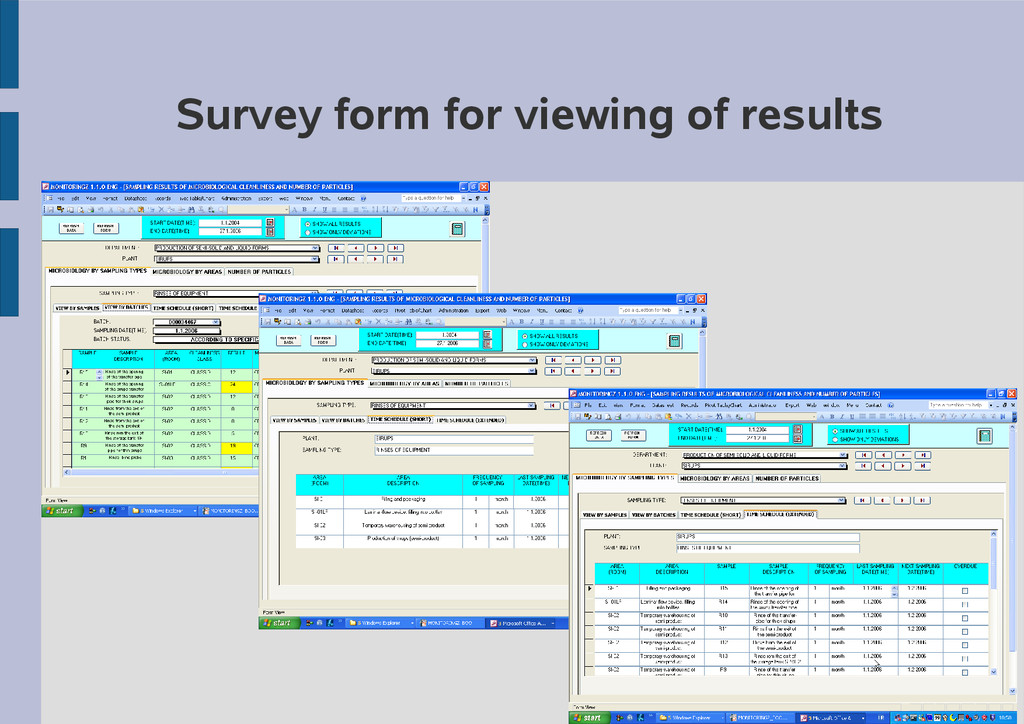
is additionally enabled to search and filter data by using datasheet tables (similar to Excel tables) and so-called pivot tables and pivot charts. These advanced options provide tools for fast and flexible search and filtering of database with defined searching criteria. In that way you can get very specific “ad-hoc” report. Fast searching of data is also enables through the cascading survey form for data view of results. It is based on the hierarchical system of forms and subforms with tabs and combo boxes, by which you can navigate through sampling results. This view gives you concentrated information from all kinds of reports in only one window. In distinction from predefined reports that are adjusted for printing and archiving of results, cascading view is adjusted for fast viewing of results. Additionally, it is enabled to view and print sampling time-schedule in any moment, which improves control over sampling.
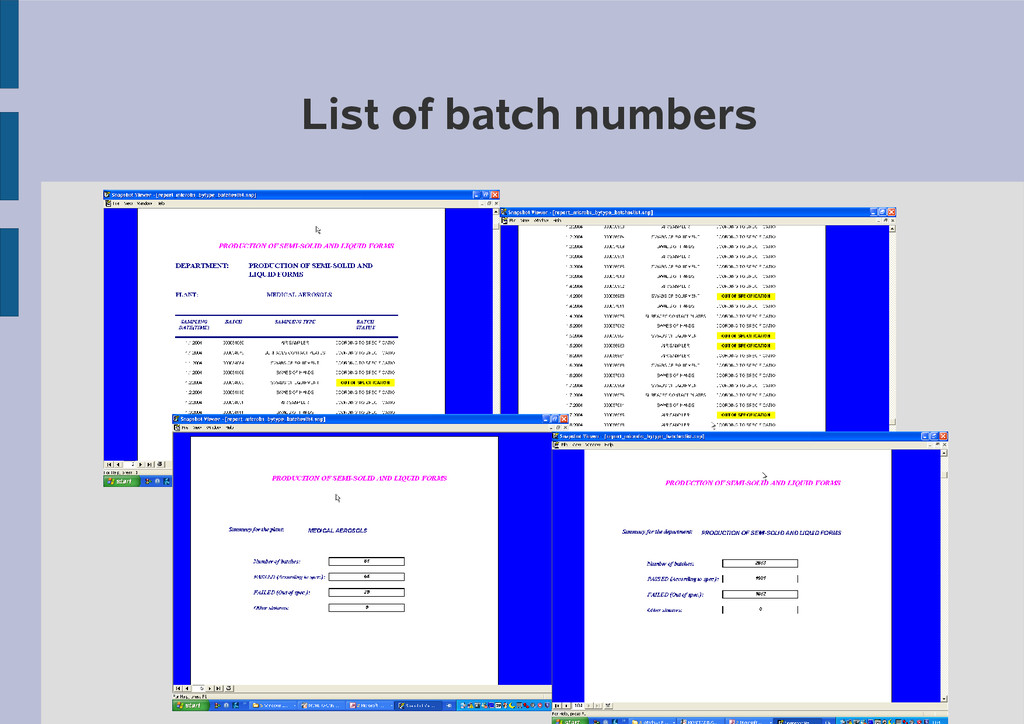
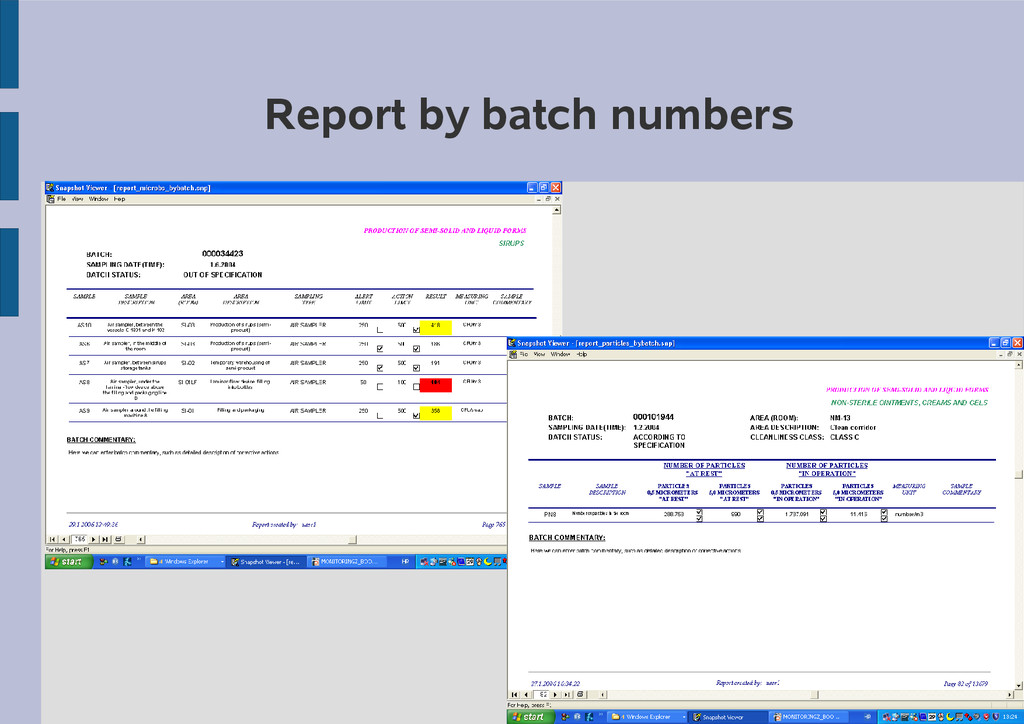
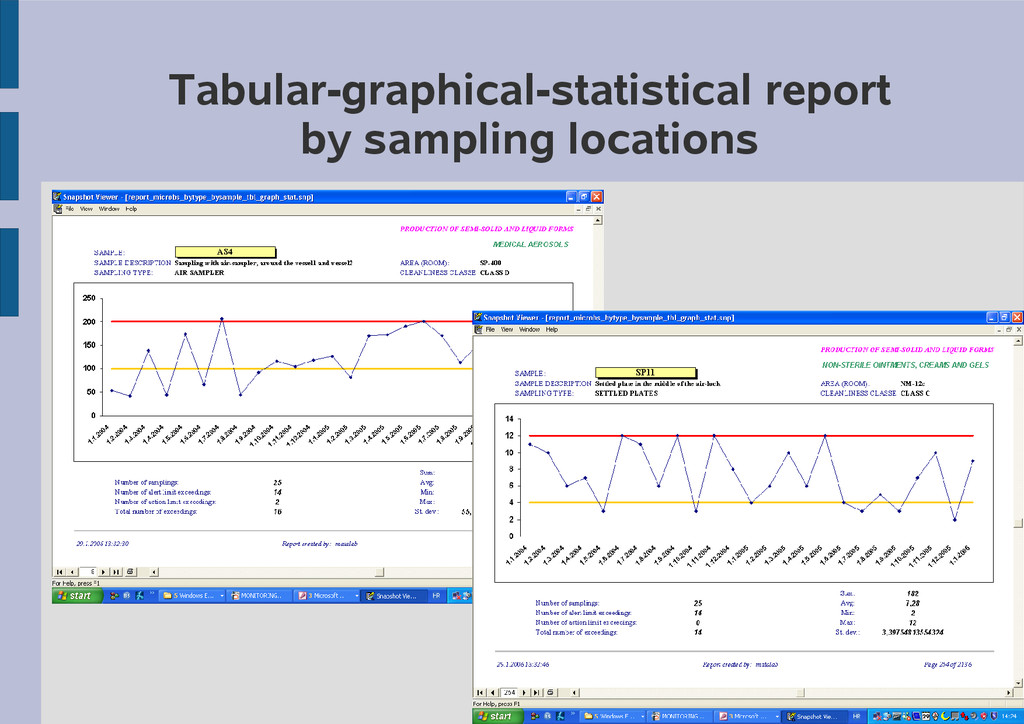
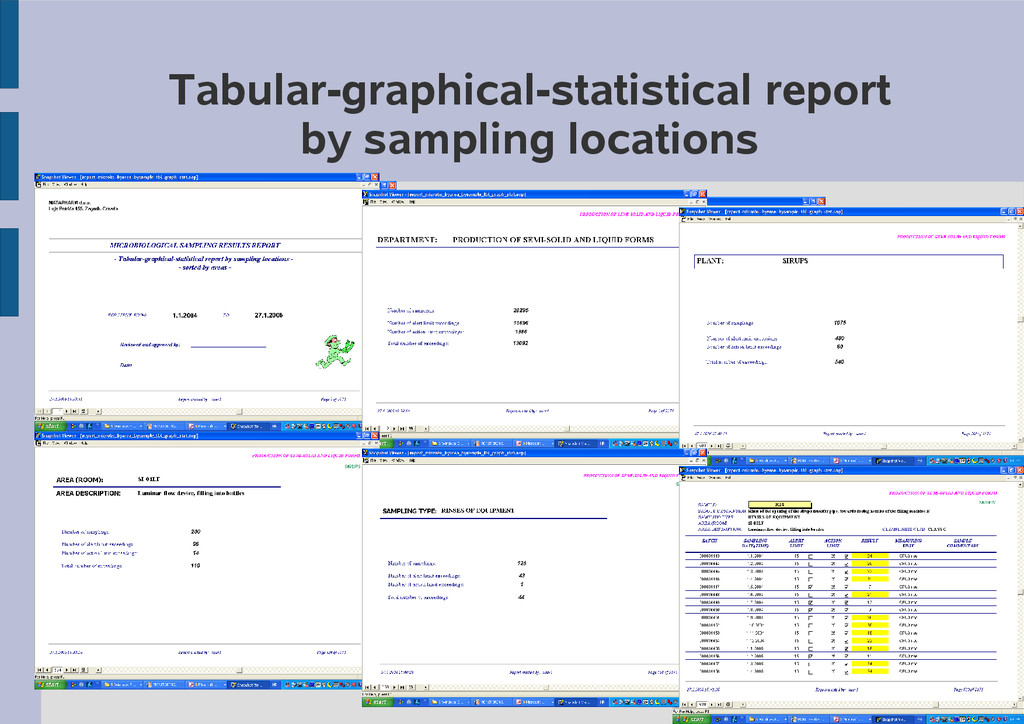
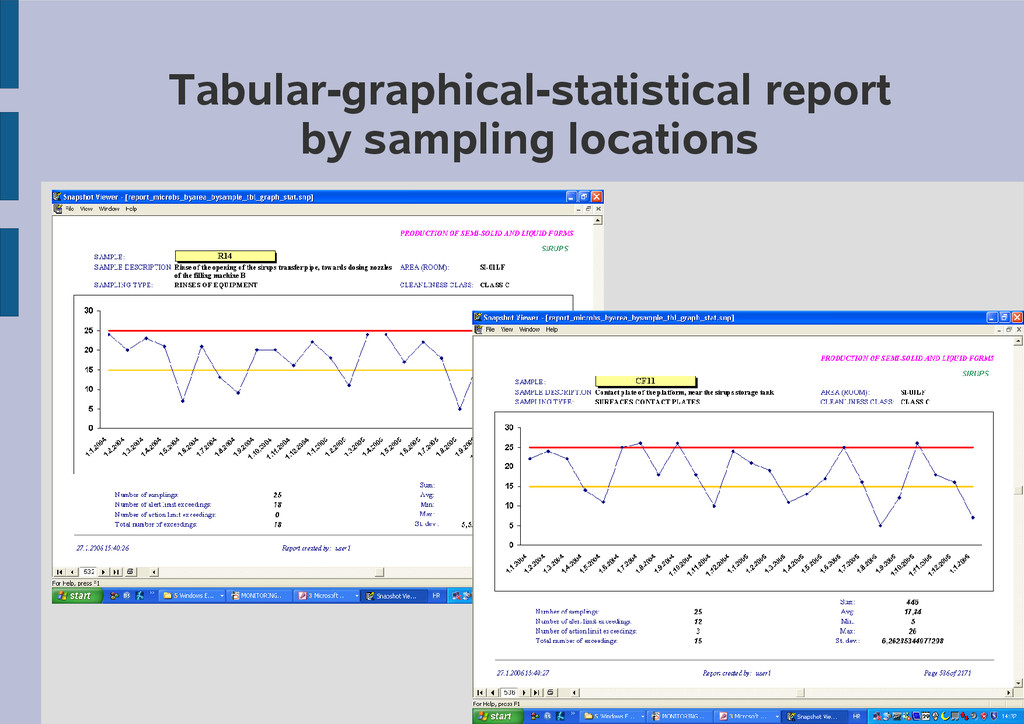
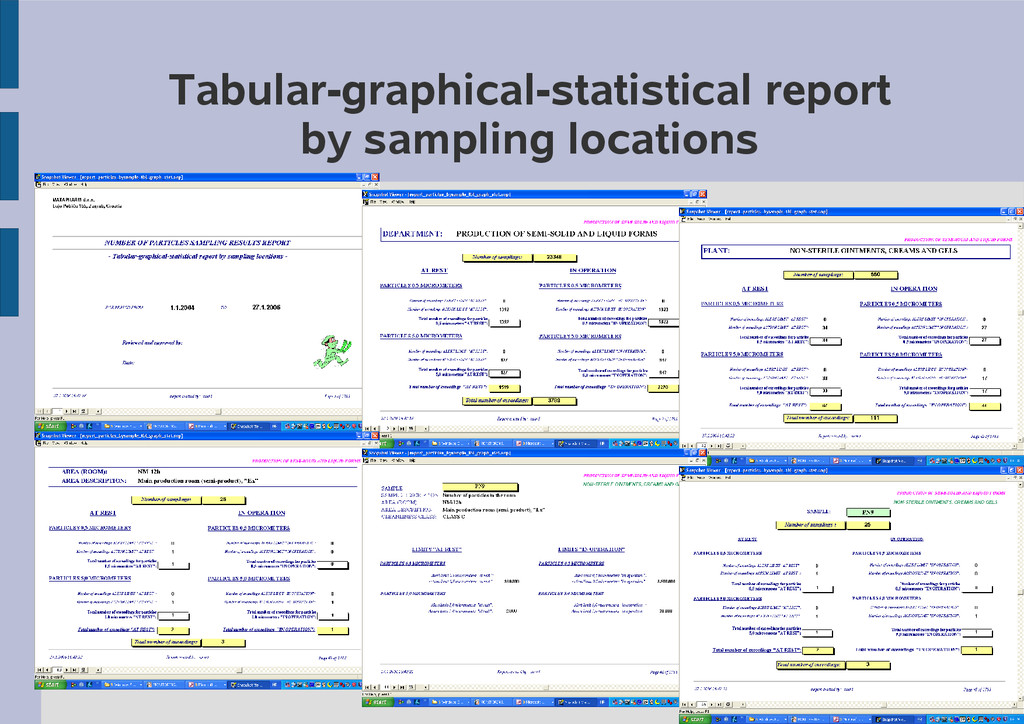
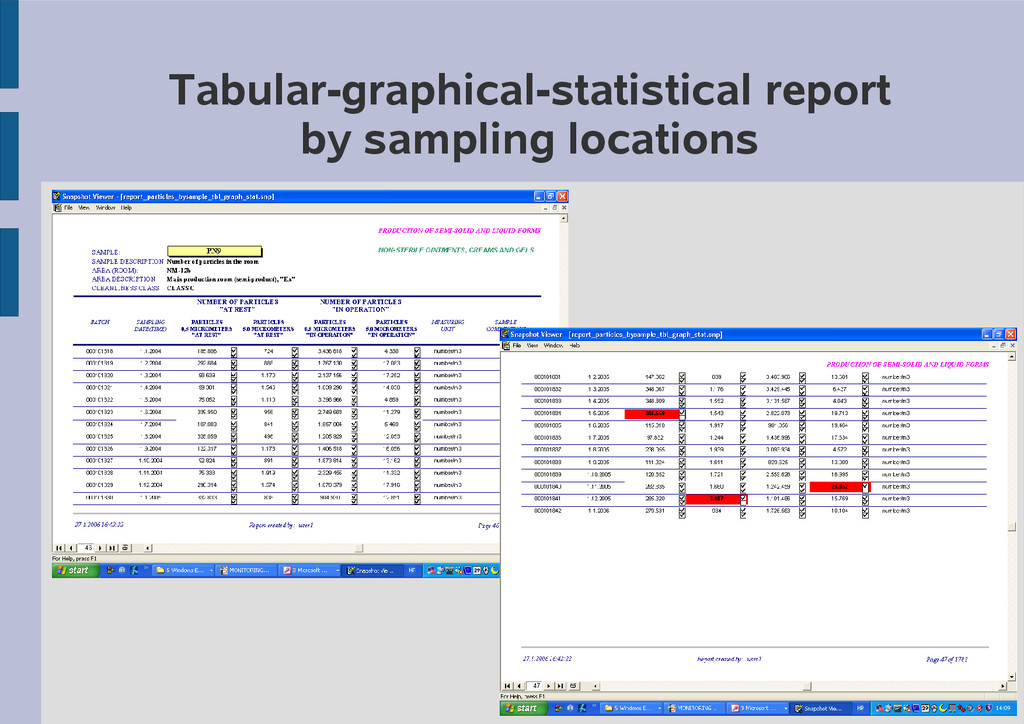
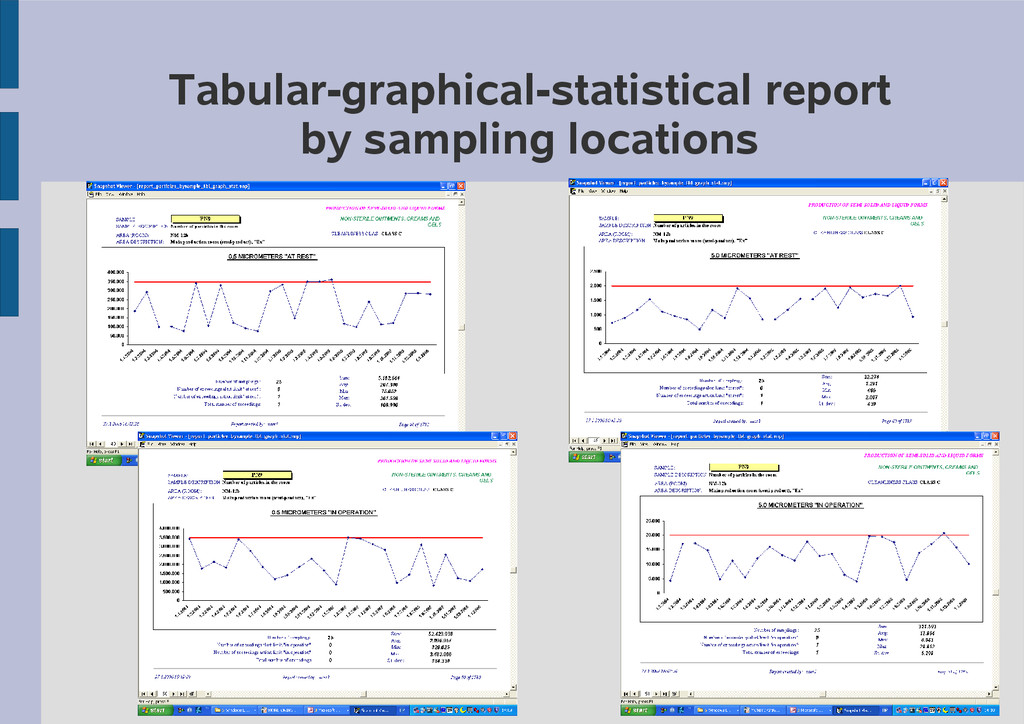
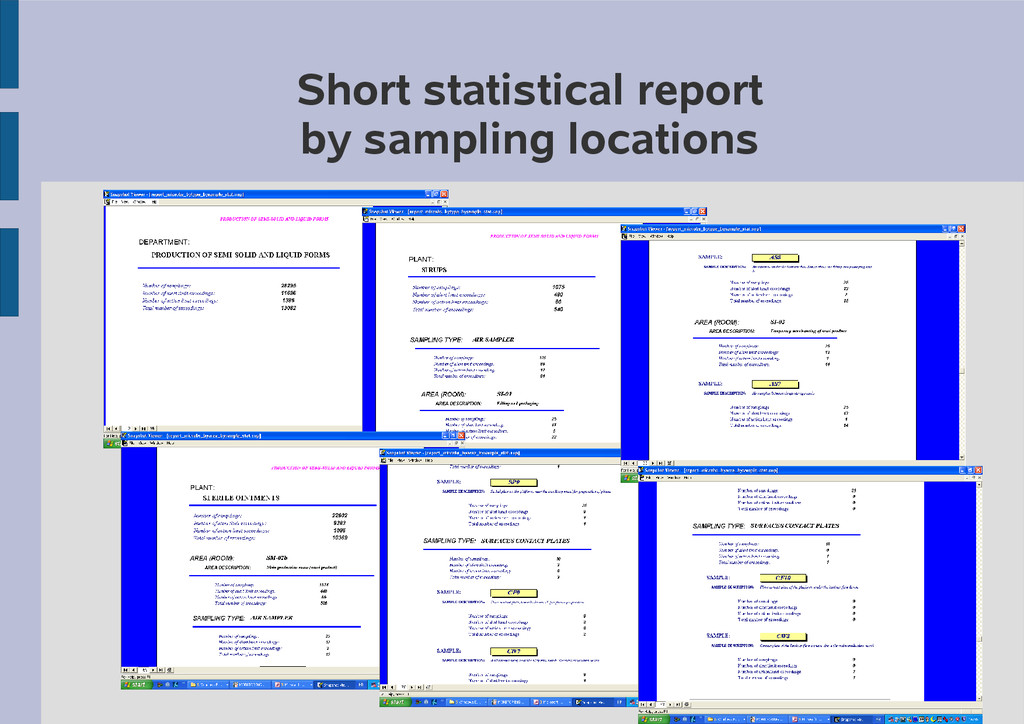
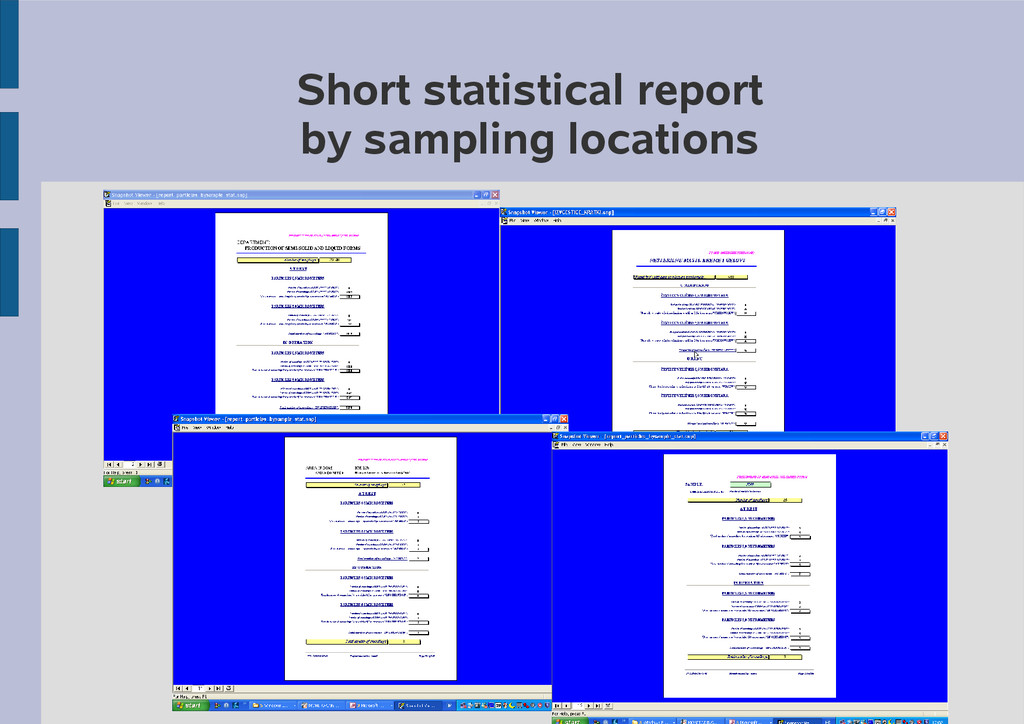
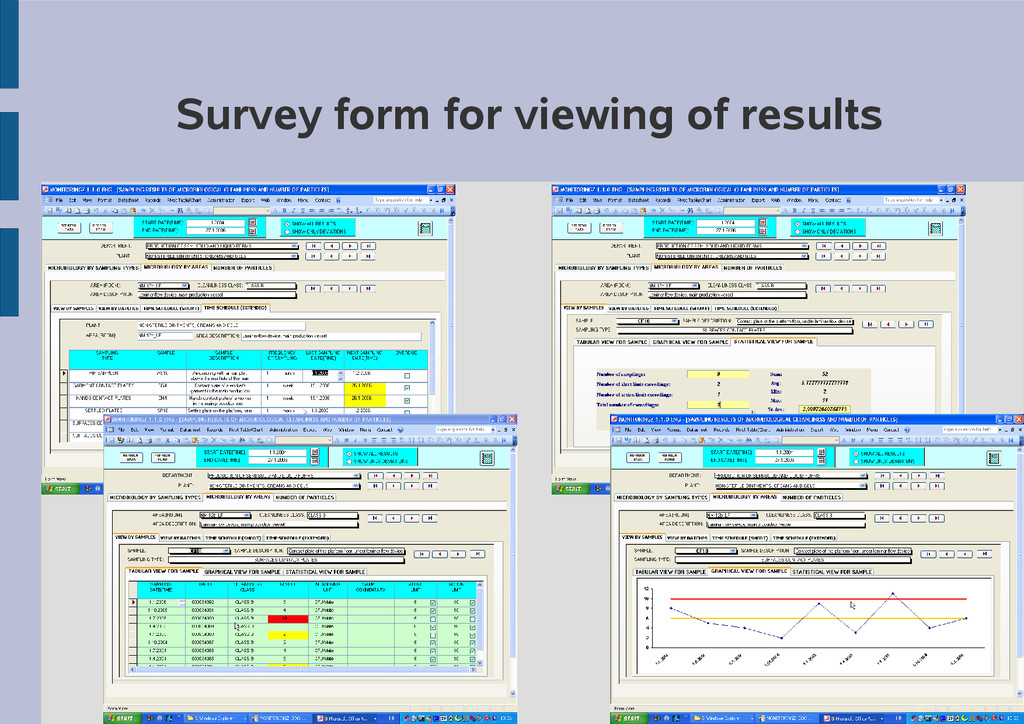
enables fast creation of the following reports: • List of batches – simple list of batch numbers sorted by sampling dates, with noted batch statuses • Report by batches – results are sorted by batch numbers, in the same way as they are entered into the database • Tabular-graphical-statistical report by sampling locations - exhaustive report with detailed tabular, graphical and statistical trending, in which results are sorted by samples (sampling locations). This type of reports contains statistical evaluation on every hierarchical level (departments, plants, sampling types, areas, samples). • Tabular report by sampling locations • Statistical report by sampling locations – condensed statistical report by all hierarchical levels (department, plant, sampling type, area, sample) • Graphical-statistical report by sampling locations • Graphical report by sampling locations • Time-schedule (short) • Time-schedule (detailed)
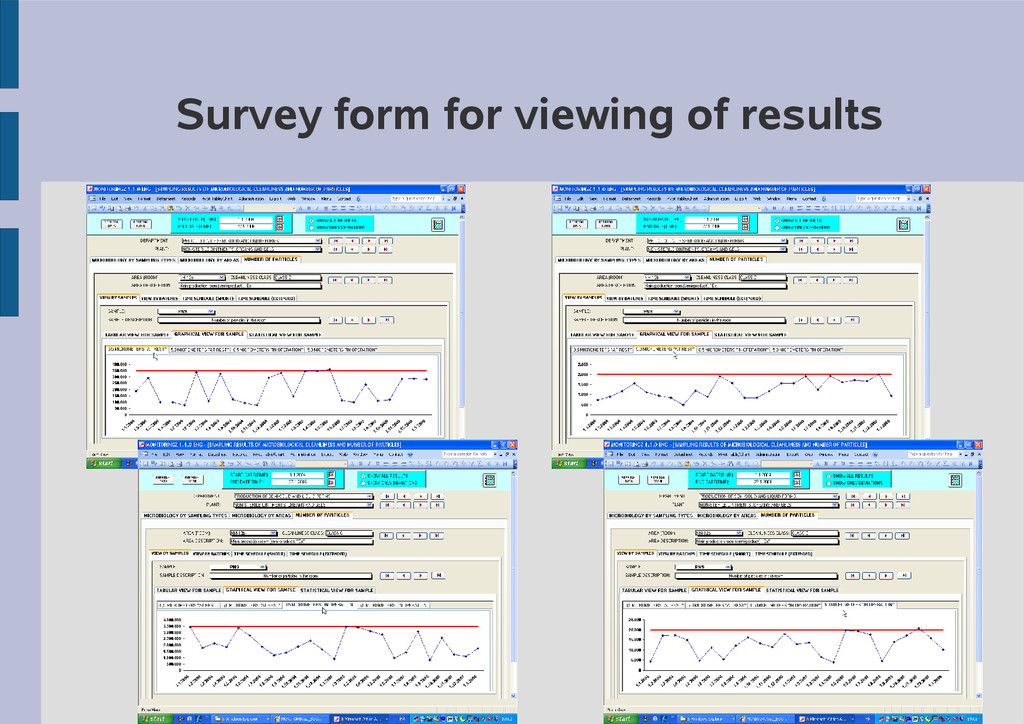
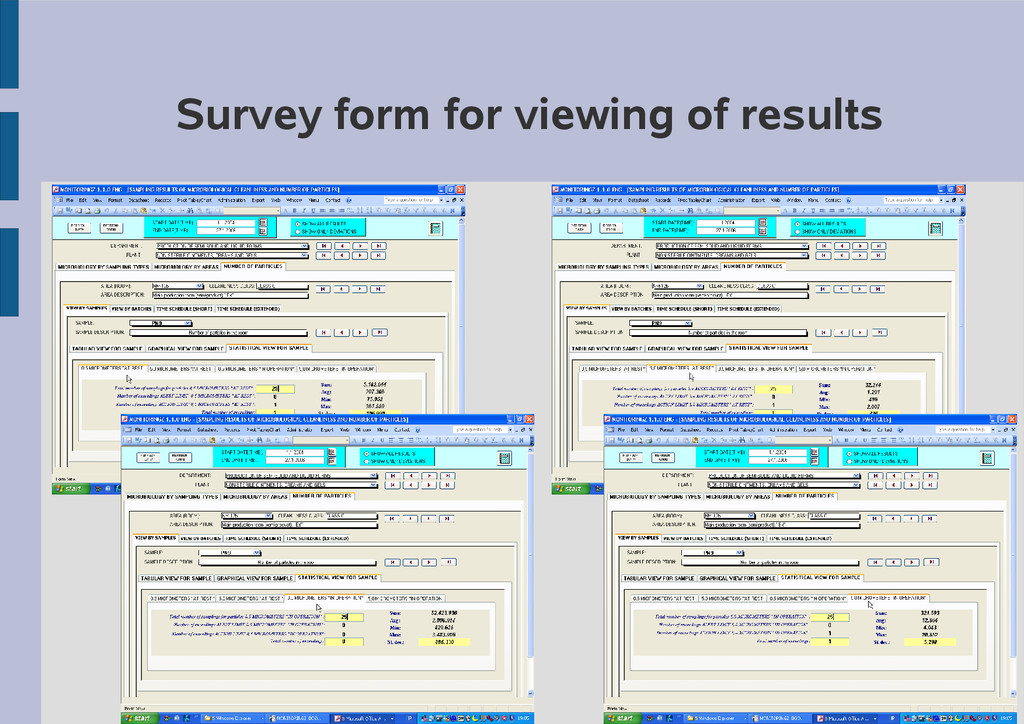
user just wants to take a brief view and simply navigate through results without need for printing on paper, opening of the data survey form is much suitable than viewing of reports. In opposite to reports which are adjusted for printing on paper, this survey form consisted of hierarchical system of subforms and tabs is suitable for viewing results on screen. It contains most important information from all kinds of reports, that are placed in just one interactive screen. The window for viewing of results consists of system of forms and subforms with tabs and combo boxes lists, by which user can navigate through results. Detail data are presented in tables, graphs and statistics.
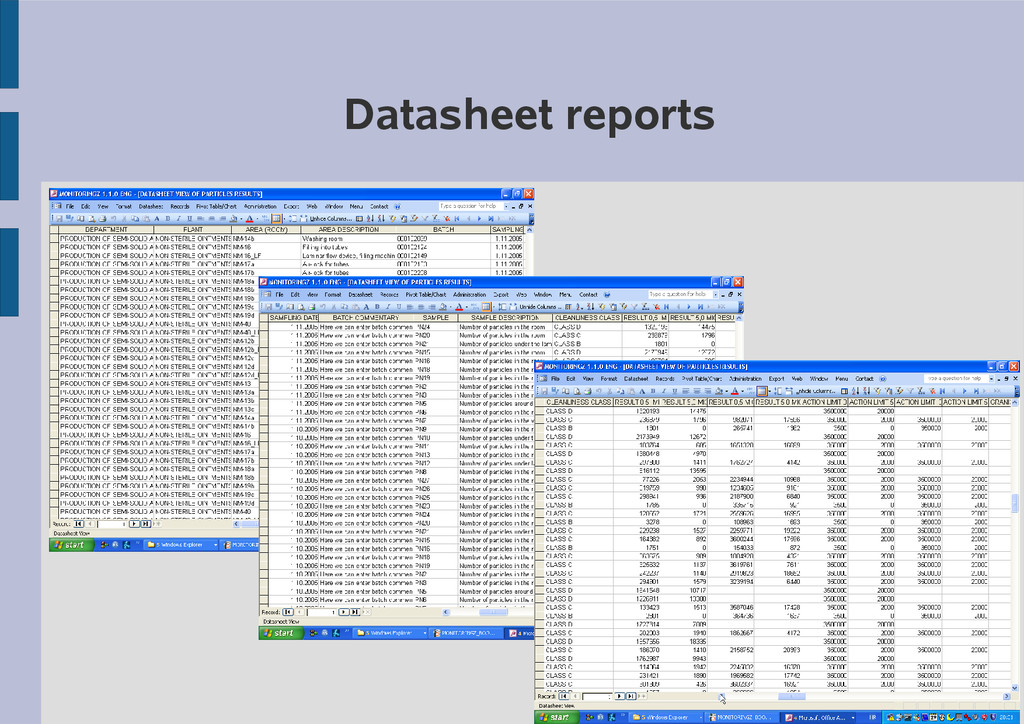
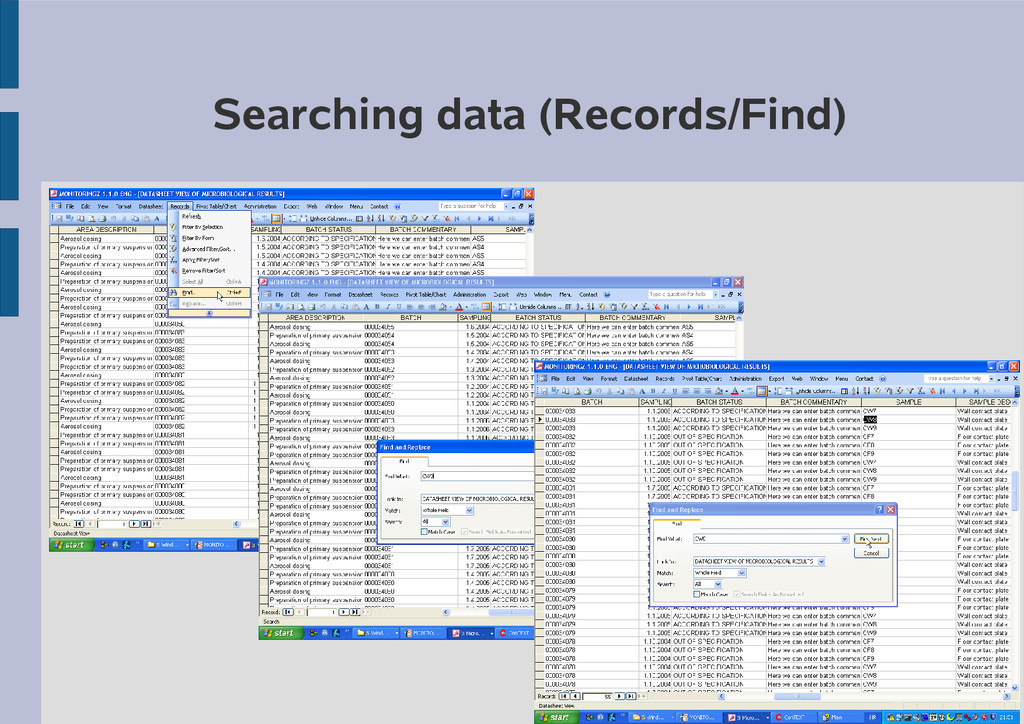
spreadsheet tabular form, similar to Excel sheets. It is called “datasheet” view. Those familiar with Excel would easily get accustomed with datasheets. In datasheet view, columns can be shrinked or spread, shown or hidden, data can be sorted ascending or descending The main advantage of datasheets is possibility of searching and filtering. In contrast to predefined reports, datasheet view gives freedom in viewing, filtering and sorting of data, so it is suitable for creation of specific “ad-hoc” reports and advanced data processing.
almost the same like in MS Excel, so everybody familiar with Excel will be familiar with these advanced options. Filter by Selection – Data is filtered by criteria of the value in selected cell. All data that satisfy the criteria will be shown. Filter Excluding Selection – All data except those that satisfy filtering criteria will be shown. Filter by Form – This option enables filtering by multiple criteria in one step. Filtering criteria can be defined separately for every column in table. Advanced Filter/Sort – This is the most advanced way of filtering data, suitable for advanced users, especially those that are familiar with making queries on databases. By choosing this option, you can use Query Builder with possibility of creating queries with different filtering criteria. This advanced tool offers vast freedom in searching and filtering sampling results. Besides filtering, you can use Searching tool by choosing Records/Find, which resembles similar tools in MS Word and Excel.
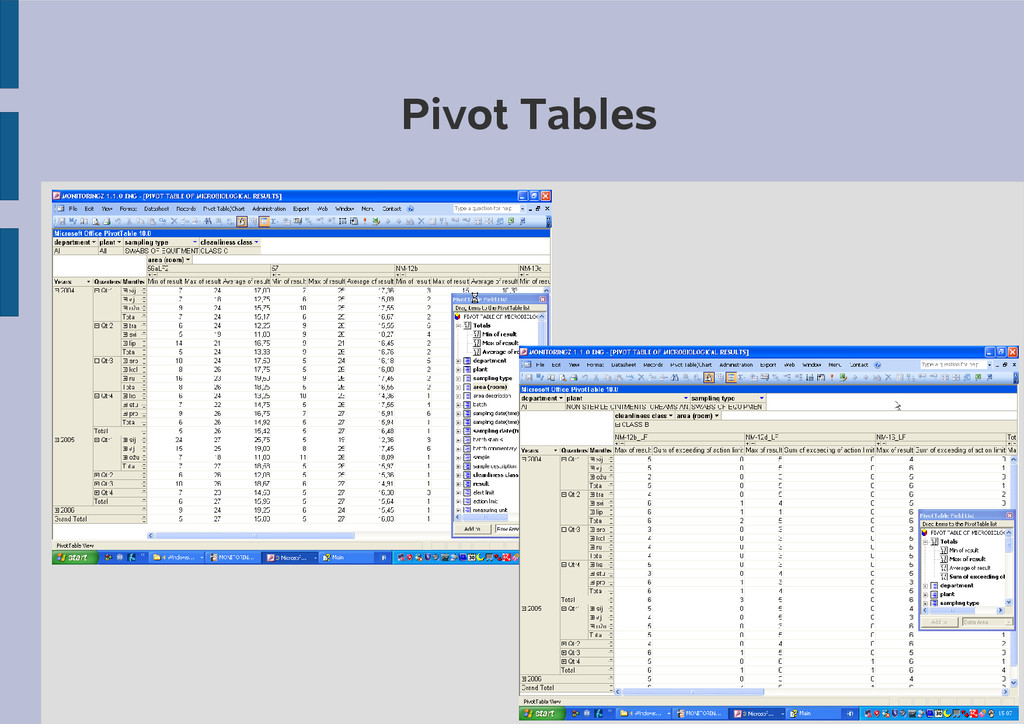
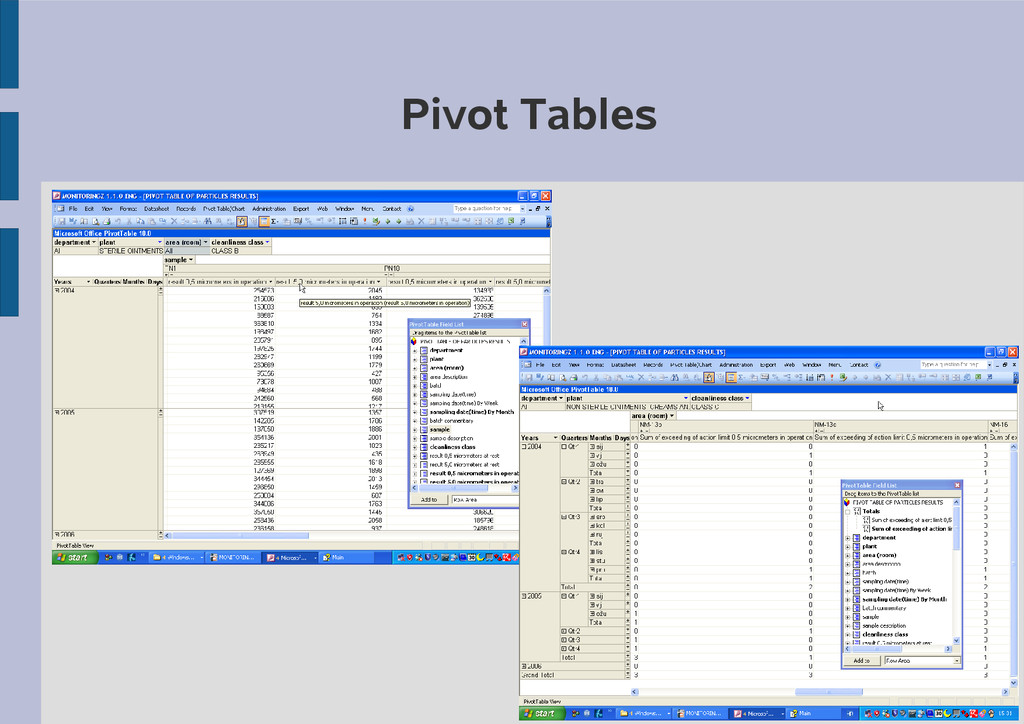
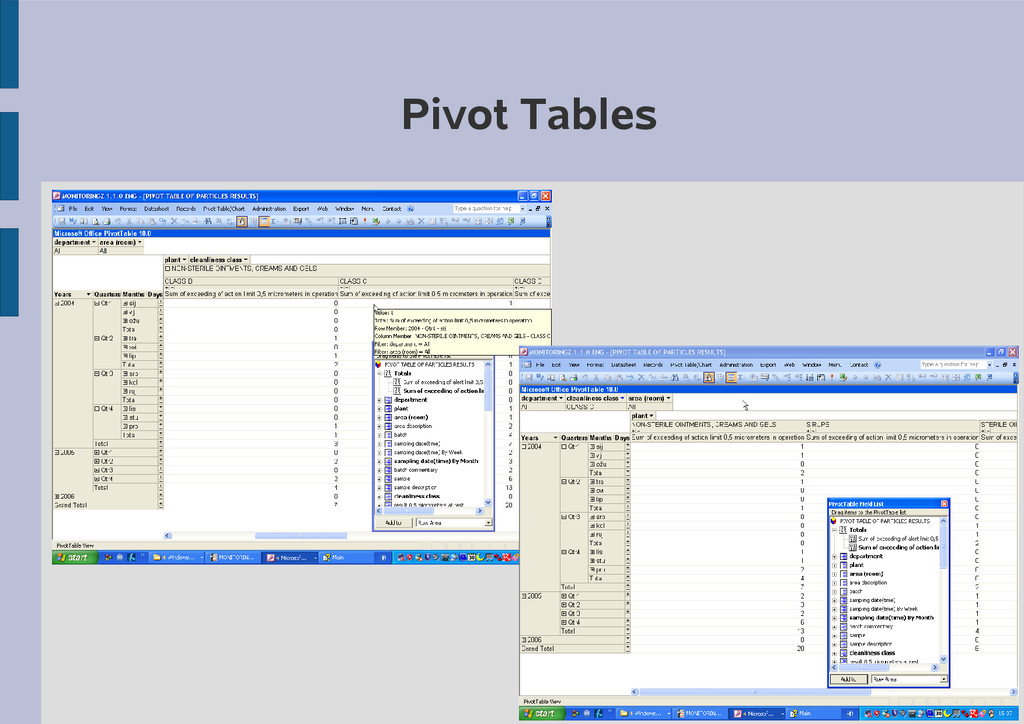
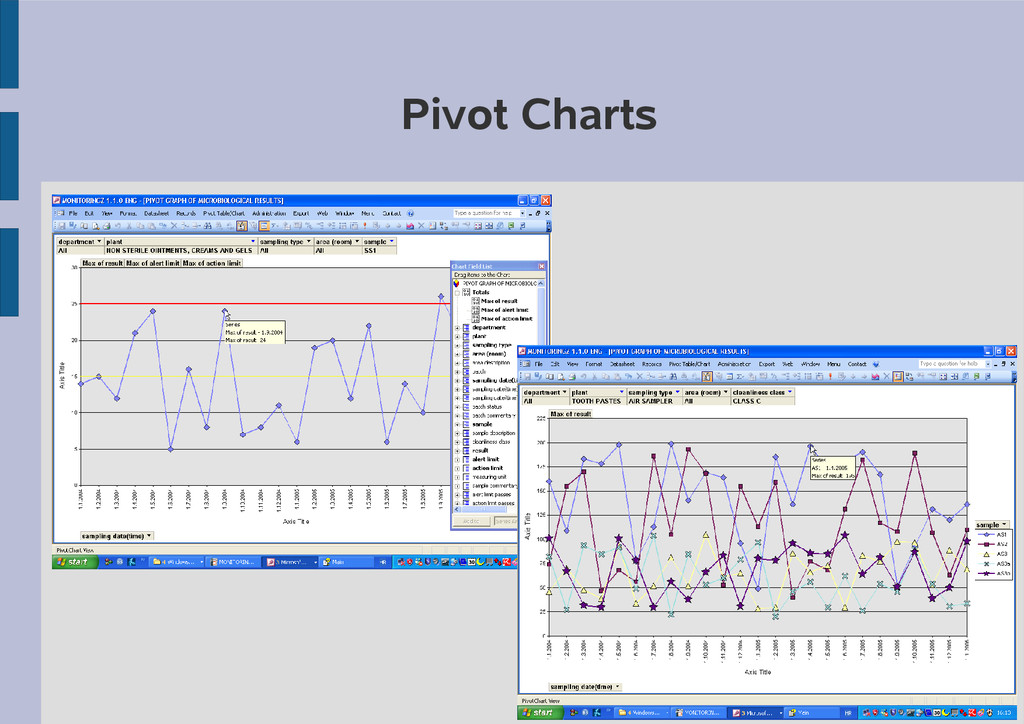
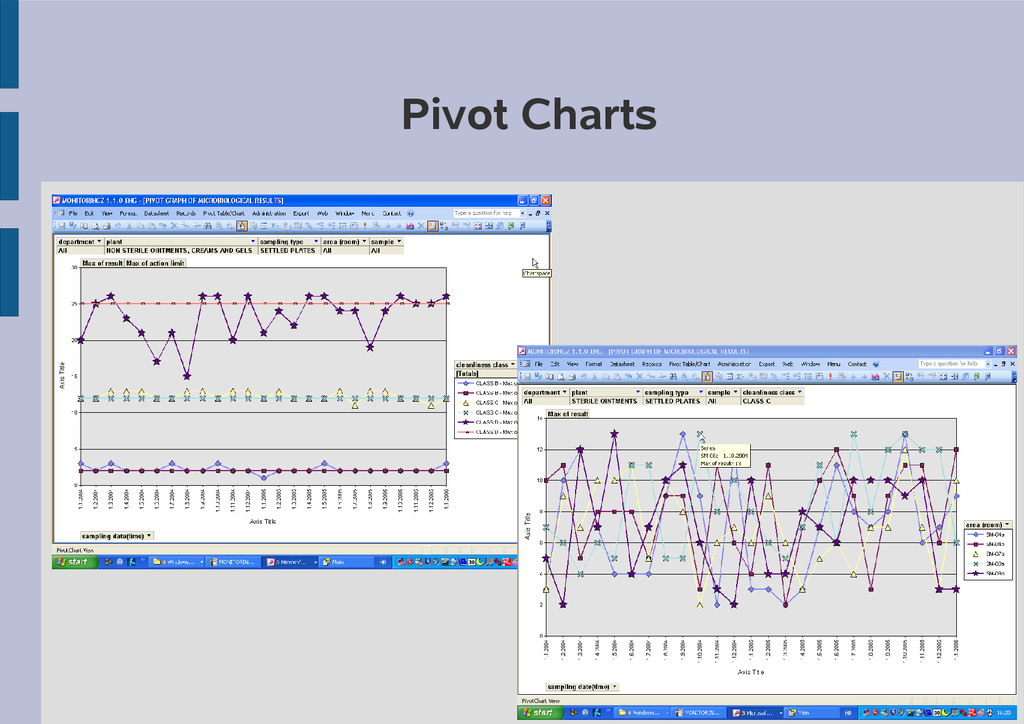
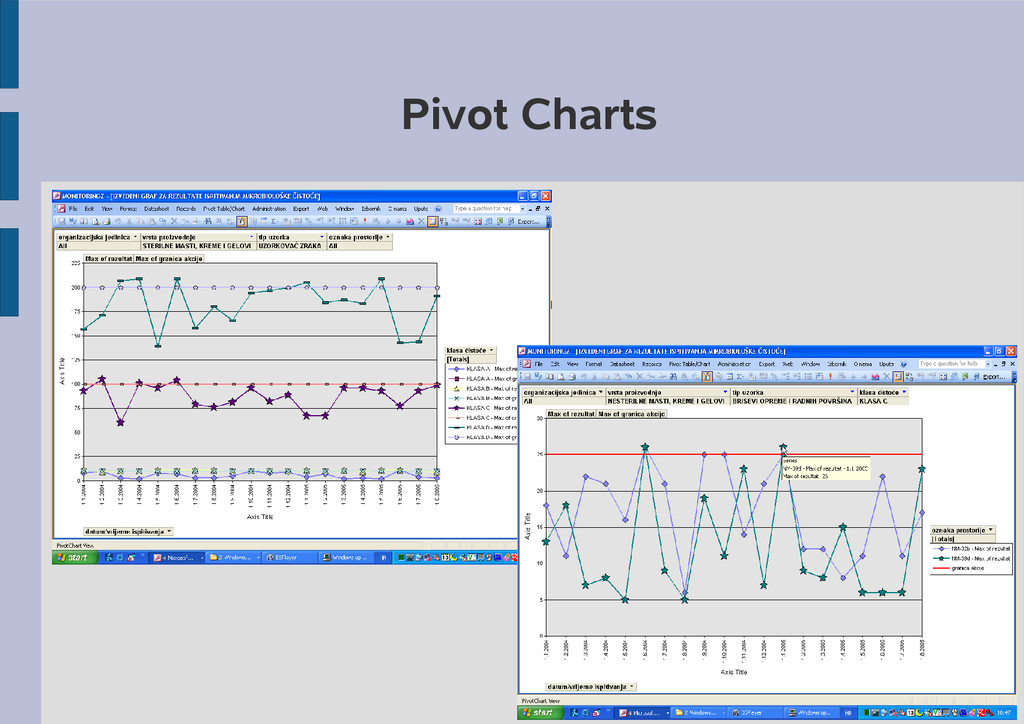
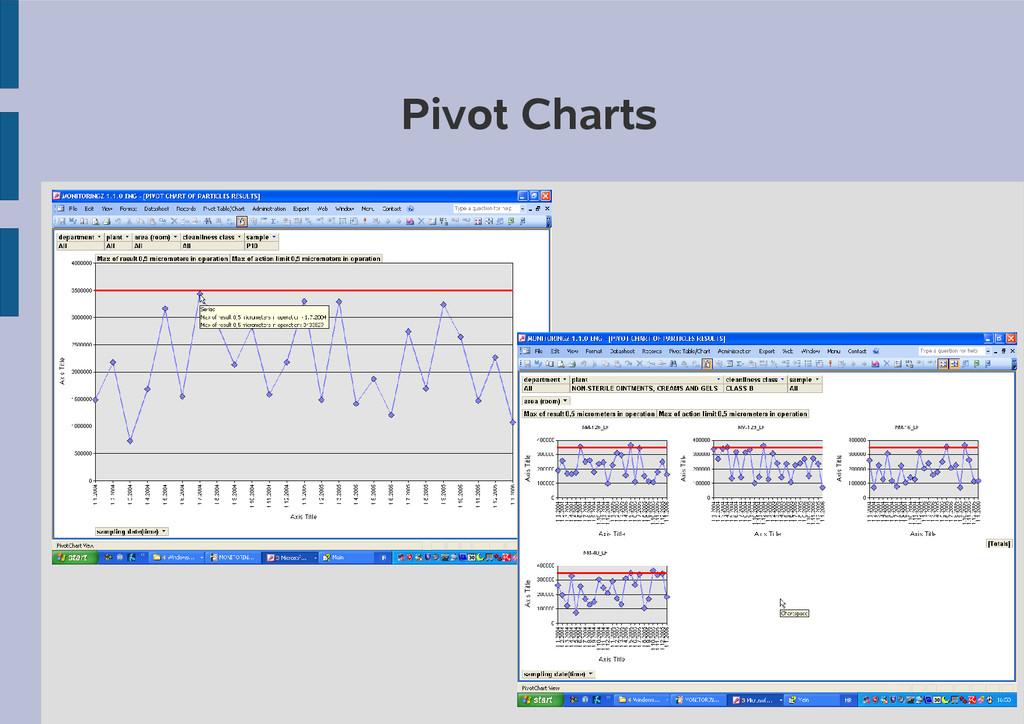
are very powerful and flexible tools, which provide advanced filtering, summarization and cross-tabulation of hierarchical data. In pivot tables you can define the data values for rows, columns, pages and summarization. The pivot table frame consists of horizontal and vertical boxes: Filter Fields, Column Fields, Row Fields, and Totals or Detail Fields, for which you provide data values by simply drag and drop appropriate fields from list. You can rotate the columns and rows to summarize the data from different points of view. Analogously, you can define fields for different sections of pivot charts: Series Fields, Category Fields, Data Fields and Filter Fields. In contrast to predefined reports, during creation of pivot tables and charts, users have absolute freedom. Pivot tables and graphs are empty frames that are populated with data by simply “drag and drop” of fields into different sections of the frame.
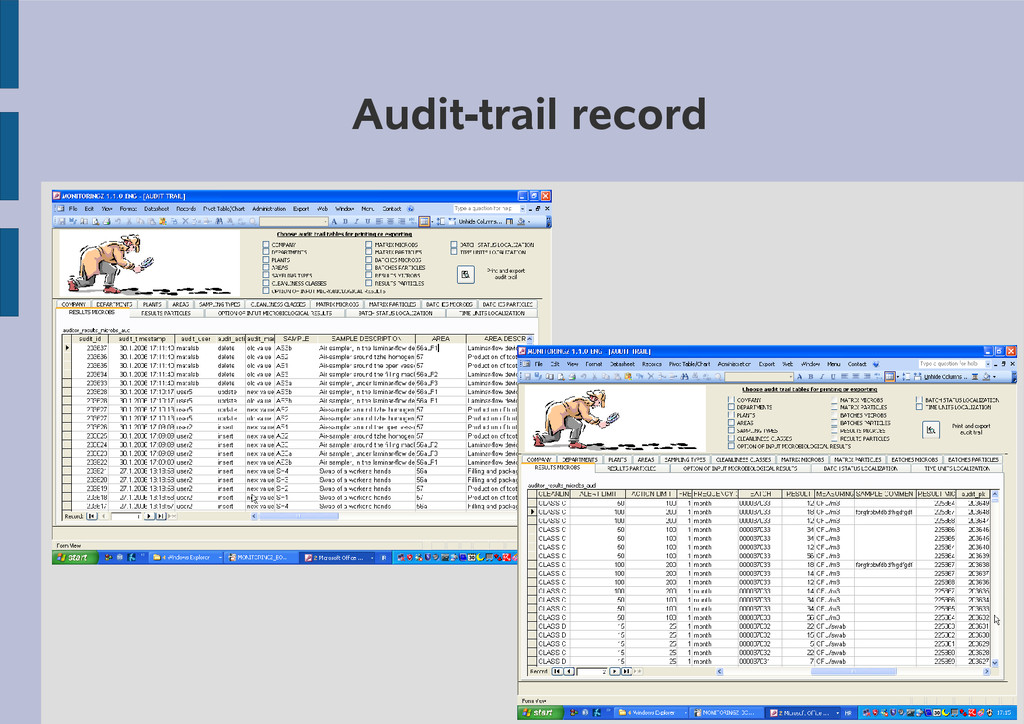
automatically generate record about all inserts, updates and deletions of data. Program MONITORINGZ automatically creates audit-trail record in the form of original tables copies, in which all originally entered data are kept permanently recorded, as well as all later updates and deletions. In audit trail, It is also marked which user entered, changed or deleted which data, as well as action type (insert, update, delete) and timestamp of action. From audit trail, It is always possible to investigate who and when changed or deleted data, as well as what was the original data. In order to prevent misuse, the content of audit-trail record can't be changed or deleted.