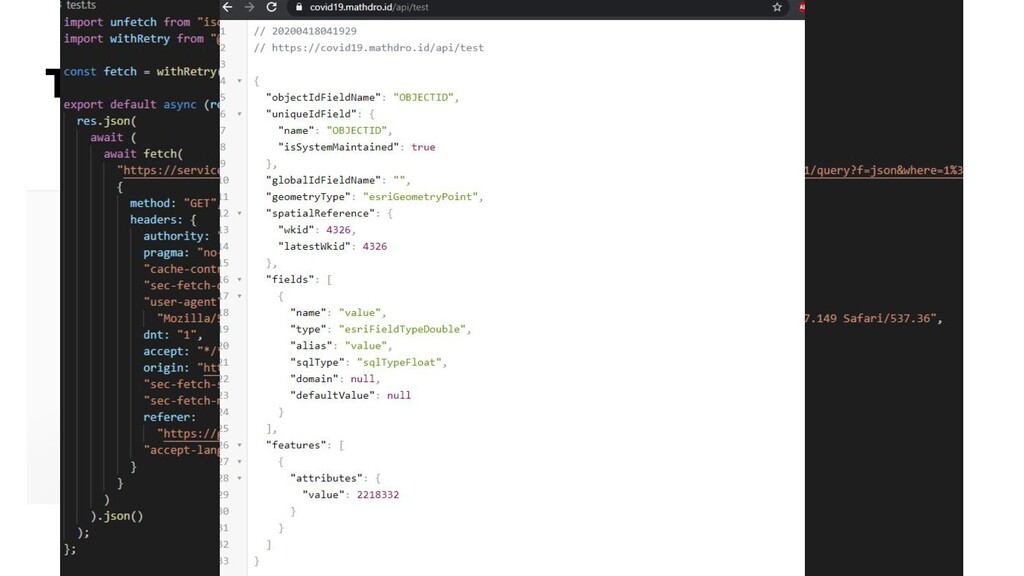
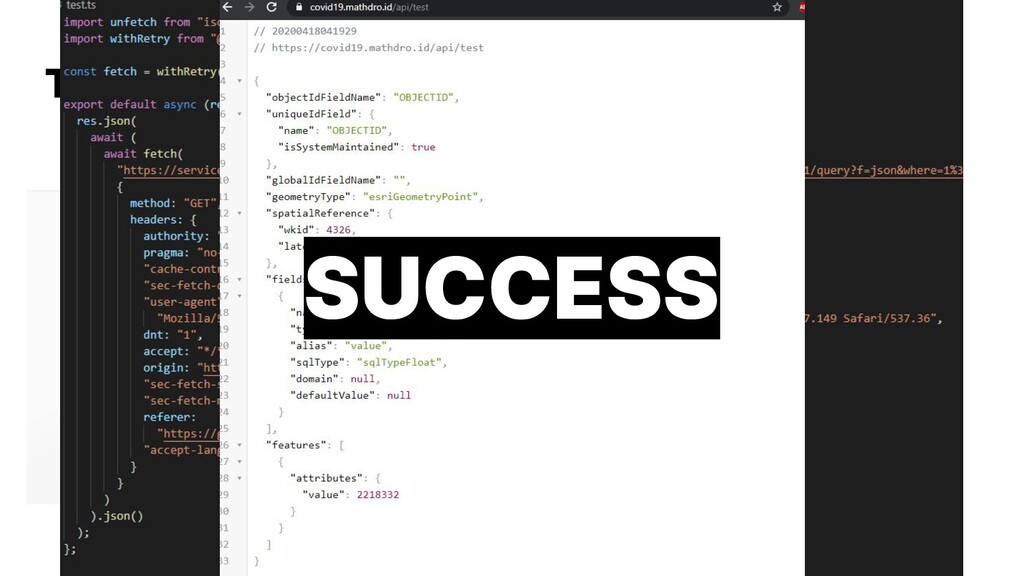
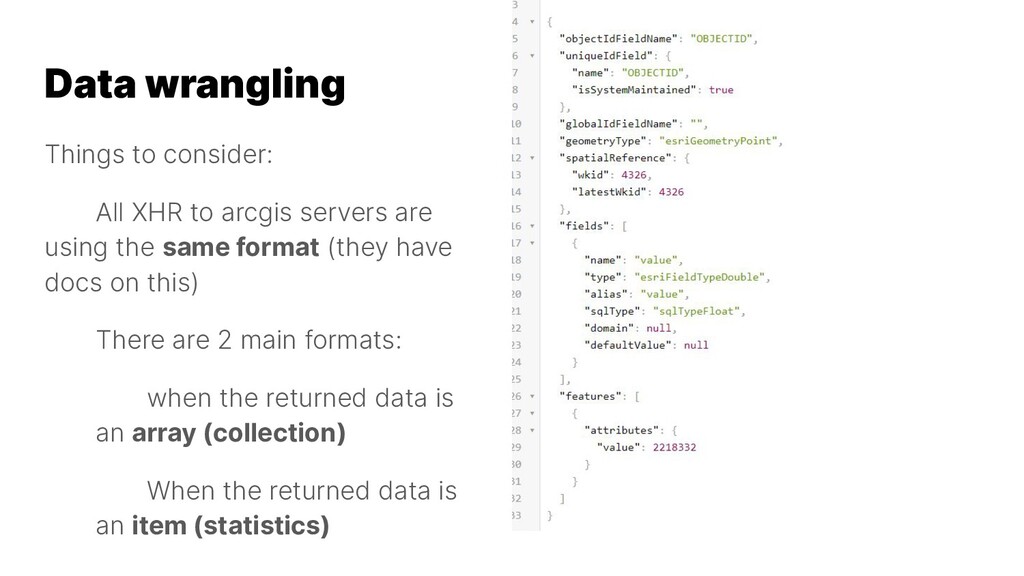
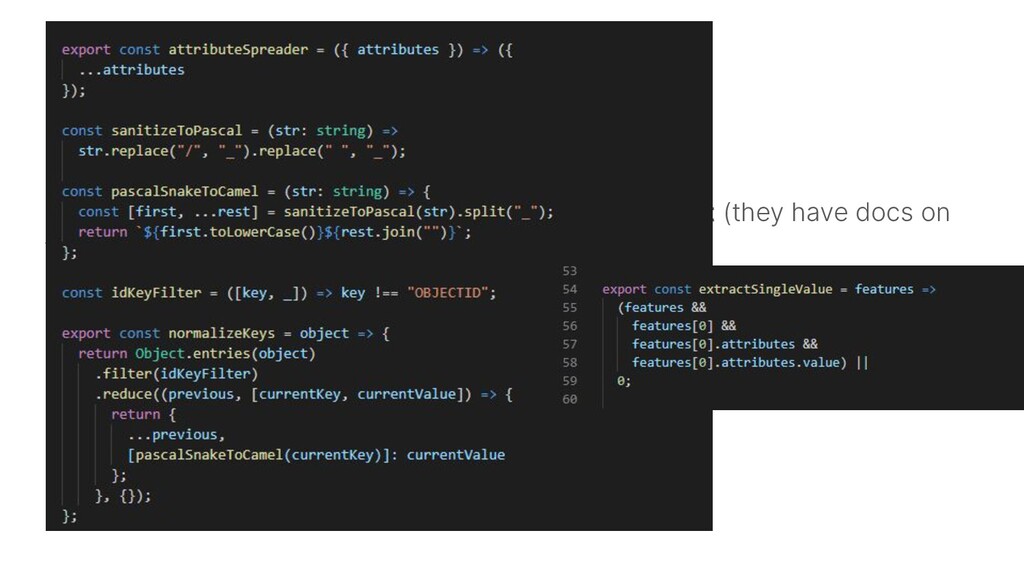
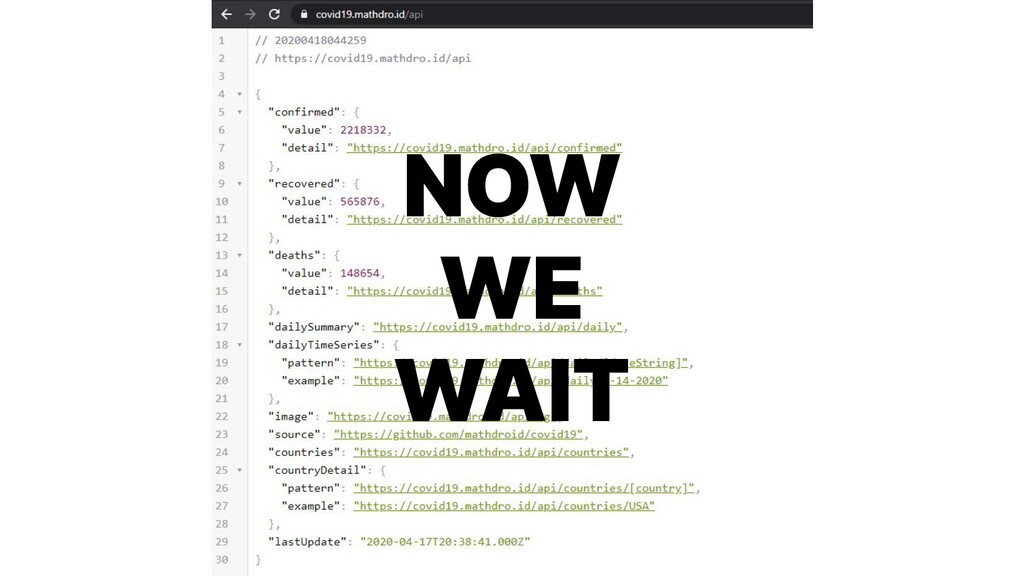
the same format (they have docs on this) There are 2 main formats: when the returned data is an array (collection) When the returned data is an item (statistics) Data wrangling
the same format (they have docs on this) There are 2 main formats: when the returned data is an array (collection) When the returned data is an item (statistics) Data wrangling
running processes (fit for lambdas), since it’s very economic and highly scalable. I would setup a persistence layer from day 1. Also set up diffing ala git from day 1. Analytics are useful but they can be EXPENSIVE. Integration tests are ESSENTIAL. Especially so when you are scraping. Just build it. Lesson learned
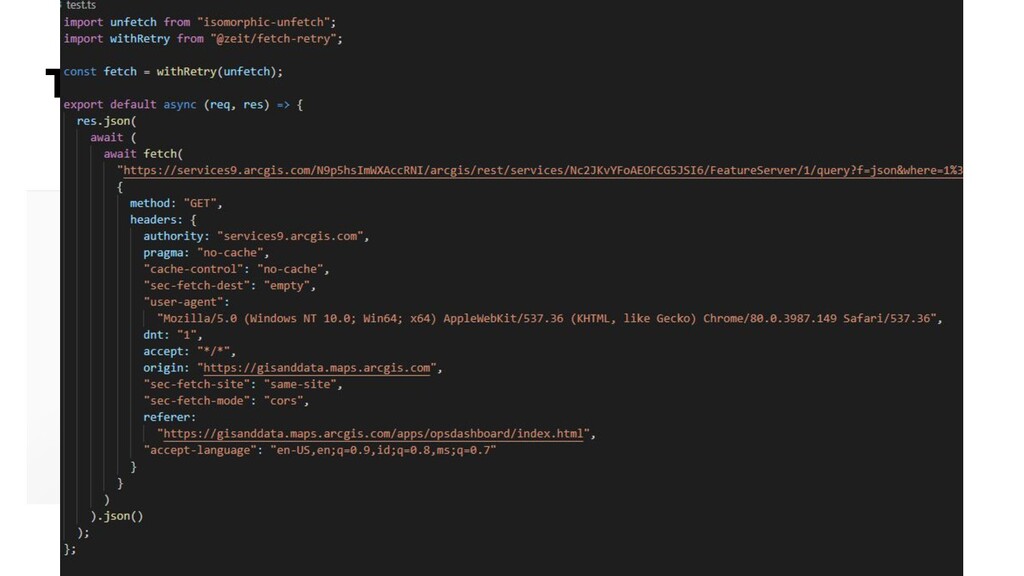
![Value in [bracket] will be available in req.query Handle exceeding](https://files.speakerdeck.com/presentations/f3c6b8a83dd34cd0a878197180baa3d4/slide_47.jpg)
![Value in [bracket] will be available in req.query Handle exceeding](https://files.speakerdeck.com/presentations/f3c6b8a83dd34cd0a878197180baa3d4/slide_48.jpg)