Upgrade to Pro — share decks privately, control downloads, hide ads and more …

A Brief Journey through Foursquare User Check-ins in Cardiff

Matt J Williams
April 06, 2011
35

A Brief Journey through Foursquare User Check-ins in Cardiff

Informal talk.
Venue: FTS Seminar, Cardiff University School of Computer Science & Informatics.

Matt J Williams

April 06, 2011
Tweet

Transcript

  1. A brief journey through Foursquare
    user check-ins in Cardiff
    FTS
    6/April/2011
    Matt Williams
    (joint project with Martin Chorley)

    View Slide

  2. Talk overview
    1. Foursquare 2. Data collection
    3. Results &
    visualisation
    4. Tools

    View Slide

  3. Foursquare
    • A “location-based online social network”
    • Founded in 
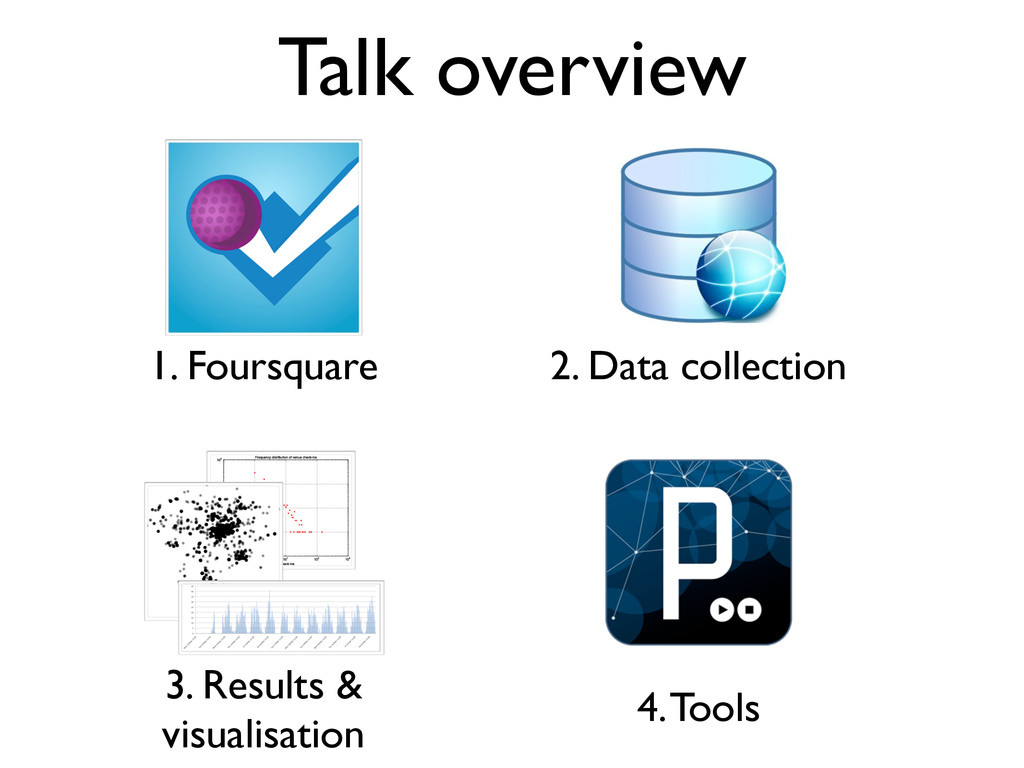
2007 in New York
    • Users ‘check-in’ to their current venue
    • Venues are user-contributed
    • ‘Mayorship’ of a venue given to the user who
    has visited the most in two months
    • Points awarded for checking in

    View Slide

  4. World Foursquare usage
    Text
    http://blog.foursquare.com/2011/01/24/2010infographic/

    View Slide

  5. Why use Foursquare?
    • To meet up with friends?
    • For deals at your favourite venues?
    • ‘Life-logging’?
    • Embedded social gaming?

    View Slide

  6. Why use Foursquare?
    • Answer: Science!
    • A rich dataset:
    • Human mobility
    • Geocoded venues
    • Social graph

    View Slide

  7. Collection method
    • Problem: user check-in histories are not public
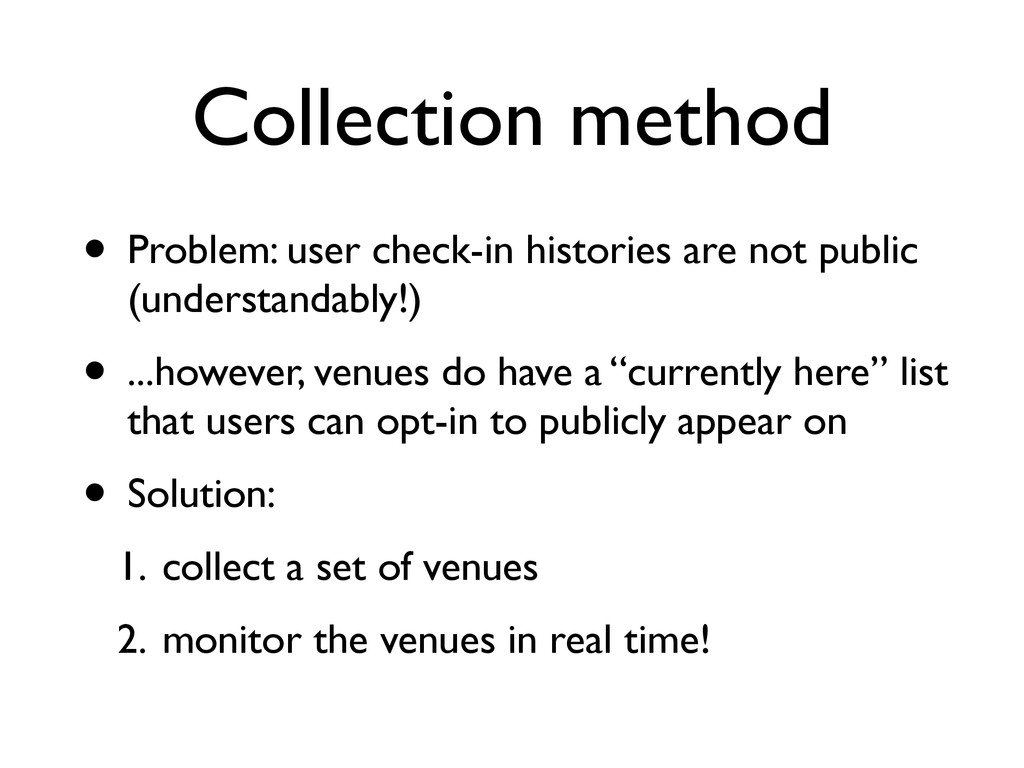
    (understandably!)
    • ...however, venues do have a “currently here” list
    that users can opt-in to publicly appear on
    • Solution:
    1. collect a set of venues
    2. monitor the venues in real time!

    View Slide

  8. Data collection
    • Collected 4,314 venues in a
    9km x 7km region
    • Restricted monitoring to
    about 2,000 venues
    • Began monitoring on
    Monday 21st March

    View Slide

  9. Dataset summary
    • Collected Mon 21st March - Sat 2nd April
    (13 days)
    • 3,394 check-ins
    • 767 venues visited
    • 4.4 check-ins per venue
    • 716 users with check-ins
    • Friends per user: average 126, median 19

    View Slide

  10. When do people check in?

    View Slide

  11. Check-ins over time

    View Slide

  12. How does the popularity of venues vary?

    View Slide

  13. Top 20 venues

    View Slide

  14. Venue popularity
    linear-linear plot

    View Slide

  15. Venue popularity
    log-log plot

    View Slide

  16. Where in Cardiff do check-ins occur?

    View Slide

  17. Check-in heatmap

    View Slide

  18. How does check-in activity vary between
    users?

    View Slide

  19. Top 20 users

    View Slide

  20. User check-ins

    View Slide

  21. How many friends does a user have?

    View Slide

  22. Friendships

    View Slide

  23. Friendships among Cardiff visitors

    View Slide

  24. [An animation of checkins!]

    View Slide

  25. Tools
    • Python (important! :))
    • matplotlib
    • Microsoft Excel
    • Processing
    • Google Earth
    • ffmpeg
    • heatmap.py (by jjguy)
    • www.getlatlon.com

    View Slide

  26. Thanks!
    Any questions?
    Twitter & 4sq: @voxmjw

    View Slide