With the increase in the available computational power, the Nathan Myhrvold's Laws of Software continue to apply: New opportunities enable new applications with increased needs, which subsequently become constrained by the hardware that used to be "modern" at adoption time. C++ itself opens the access to high-quality optimizing compilers and a wide ecosystem of high-performance tooling and libraries. At the same time, simply turning on the highest optimization flags and hoping for the best is not going to automagically yield the highest performance -- i.e., the lowest execution time. The reasons are twofold: Algorithms' performance can differ in theory -- and that of their implementations can differ even more so in practice.
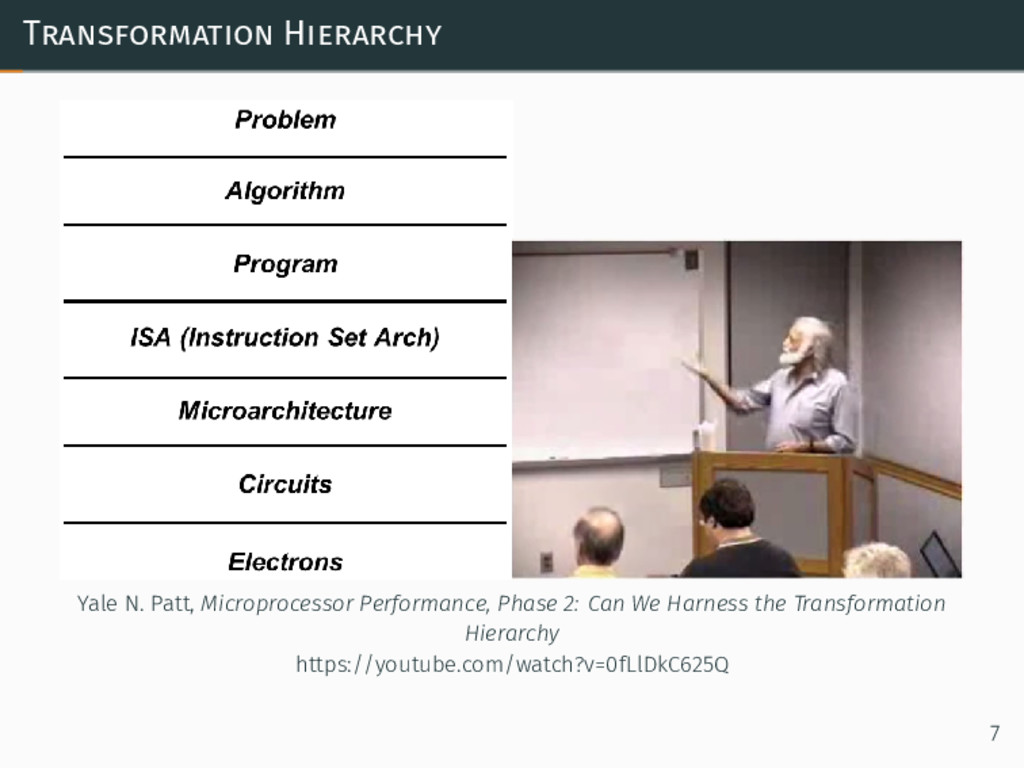
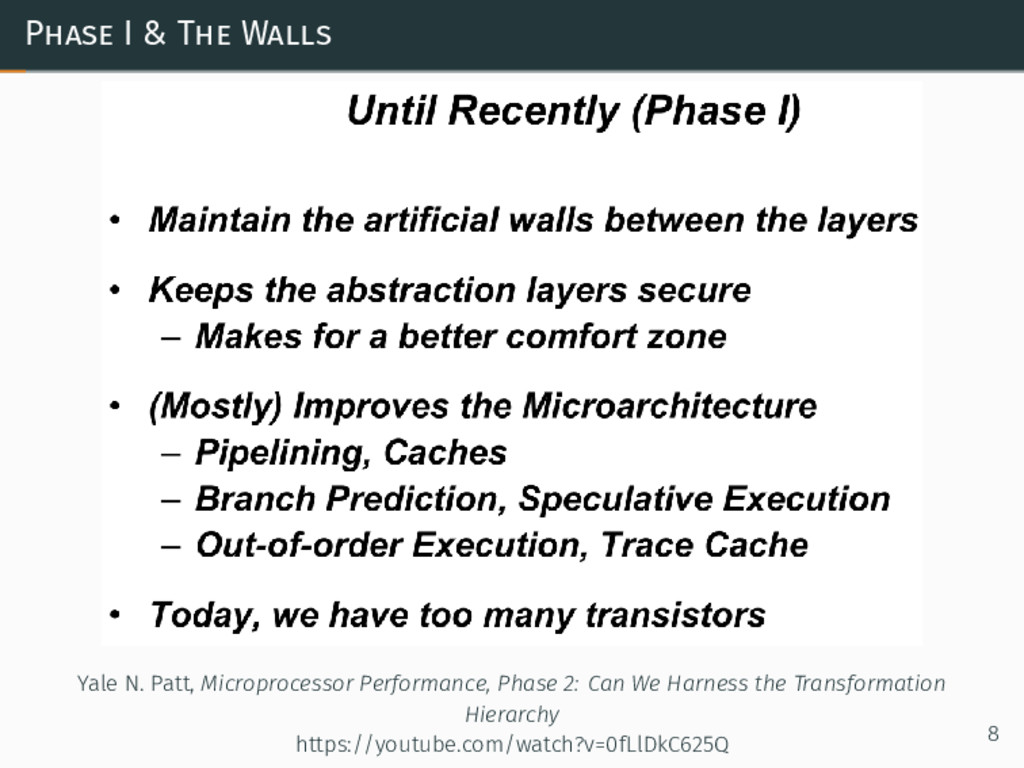
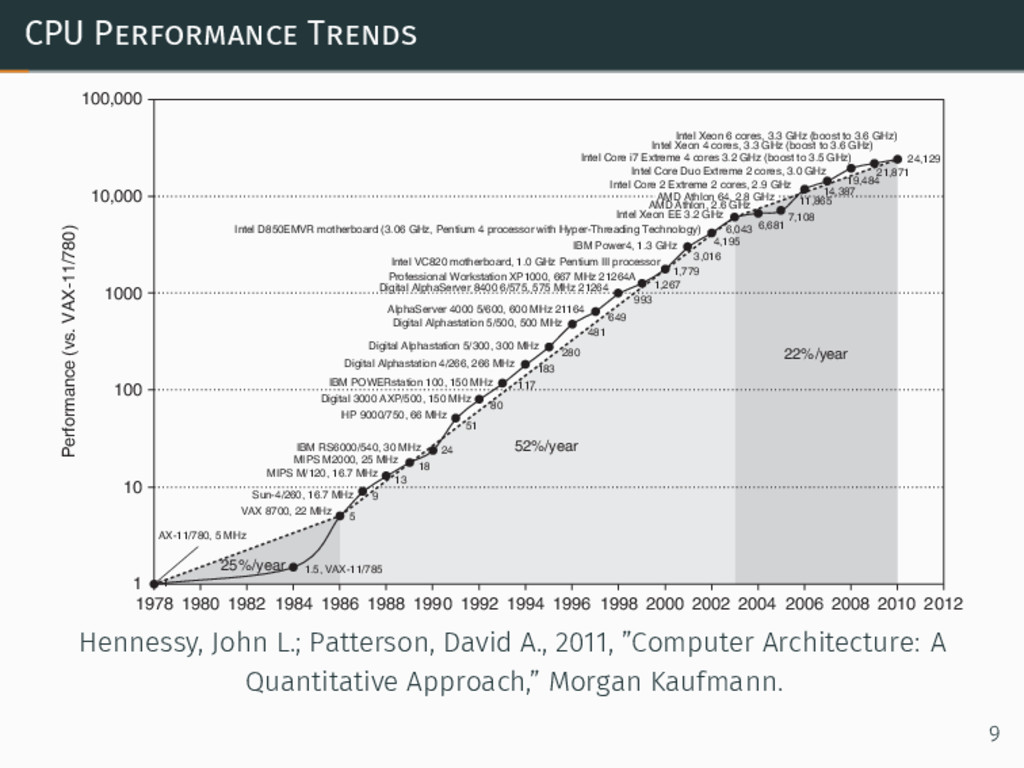
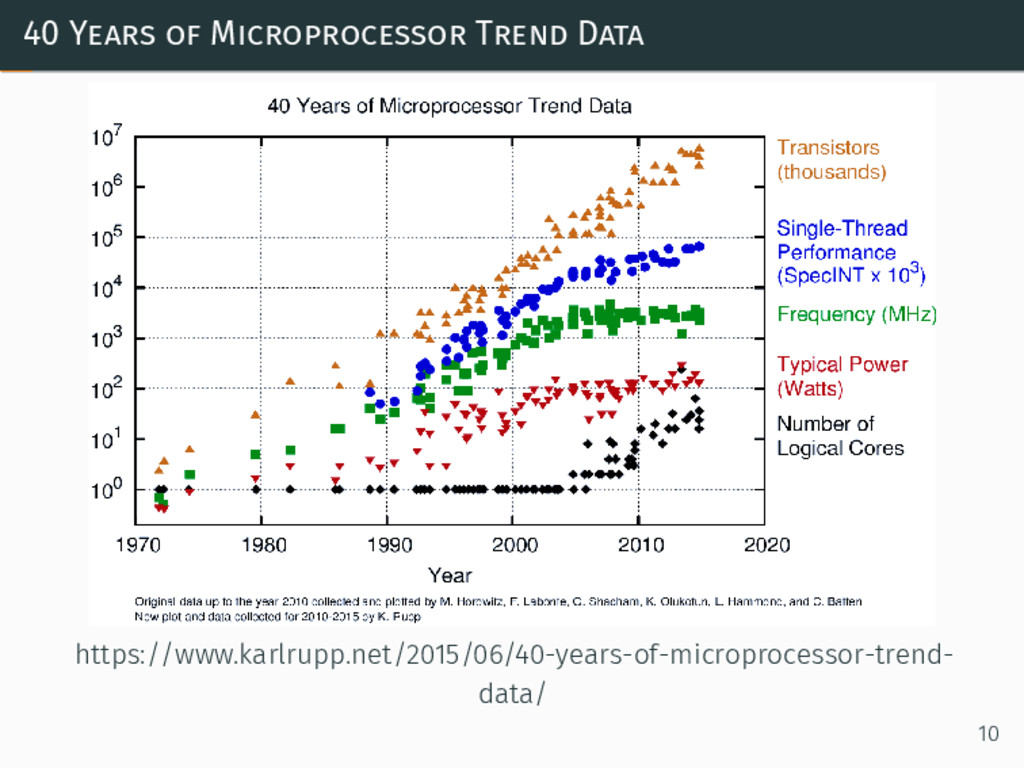
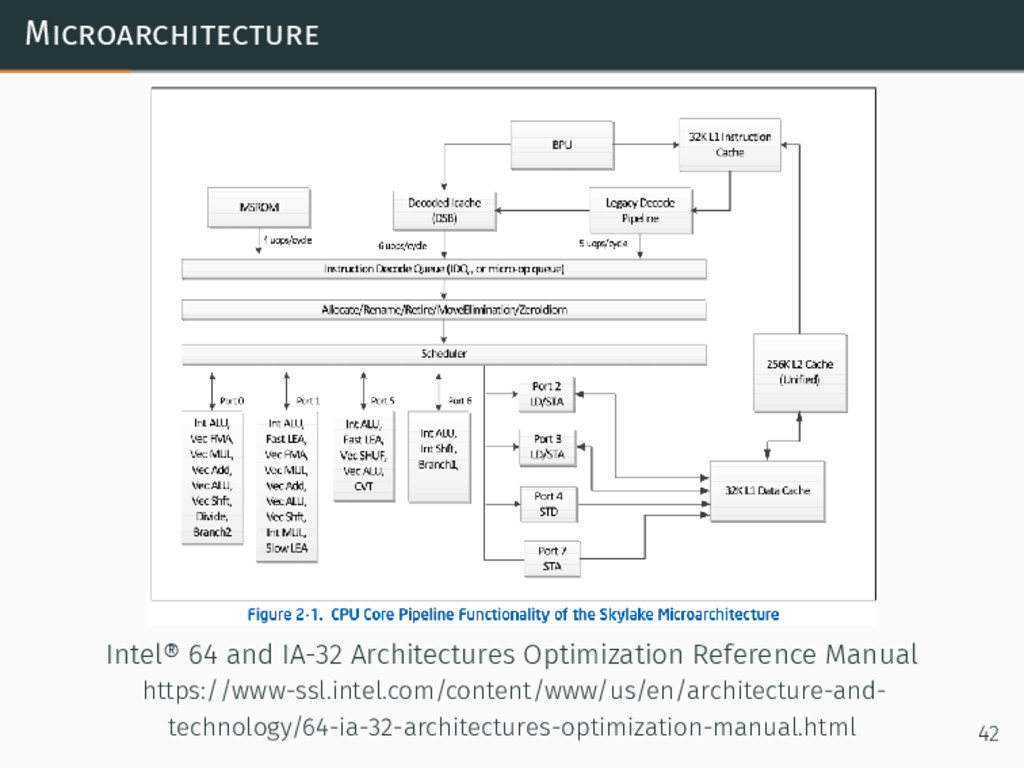
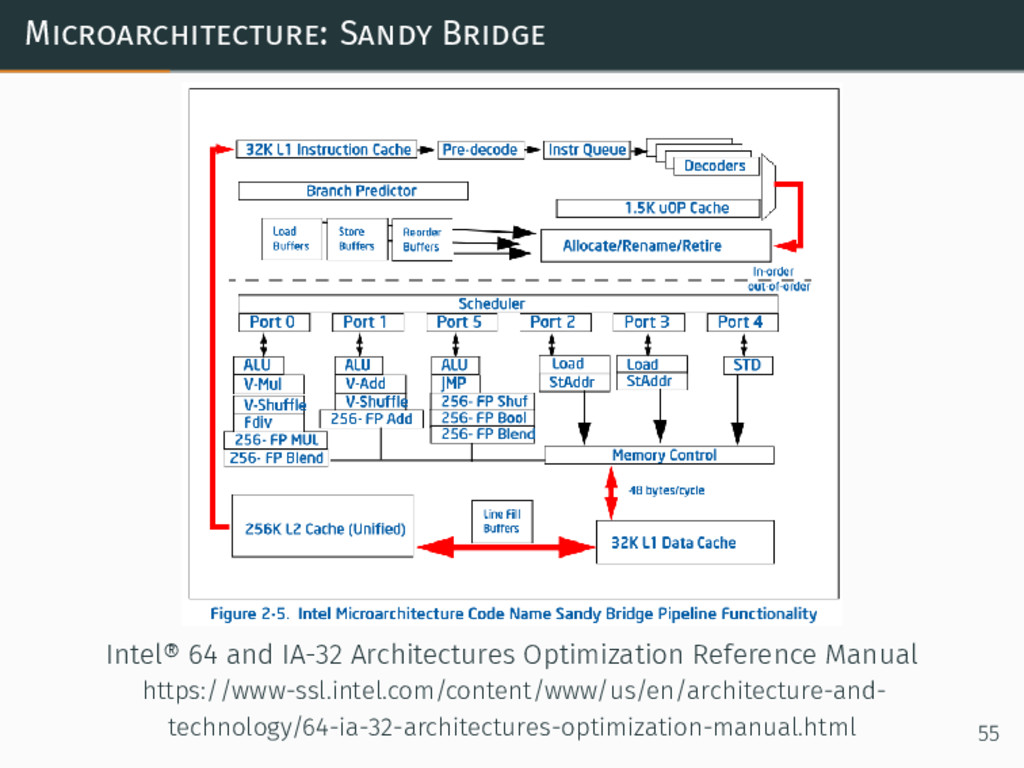
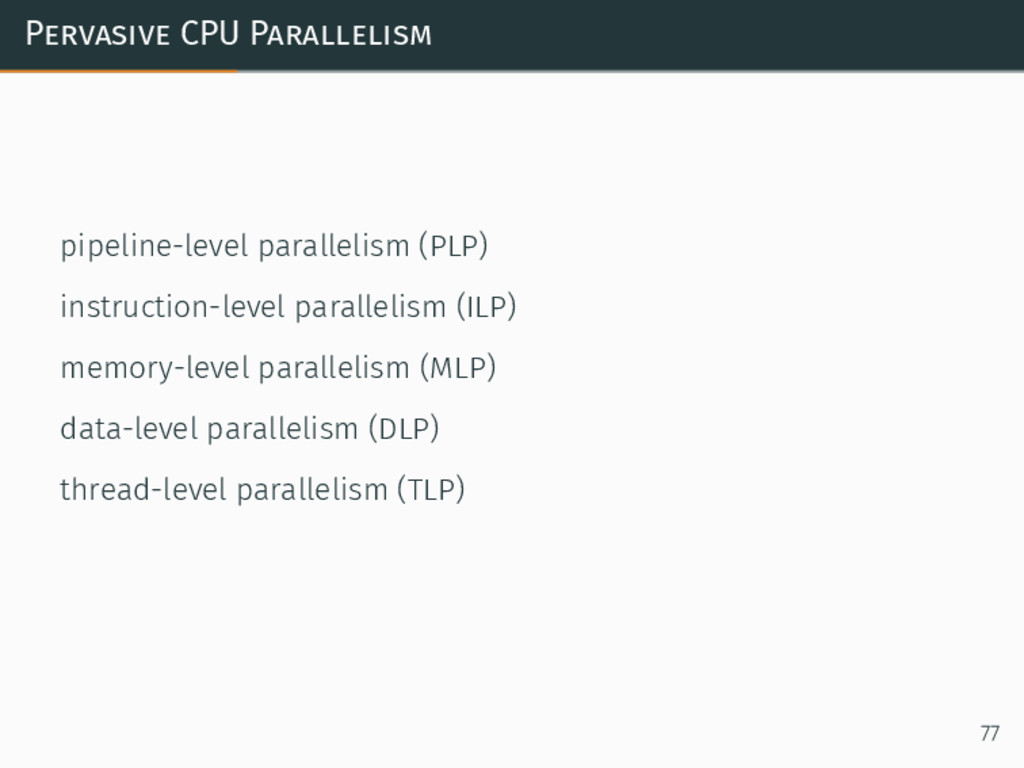
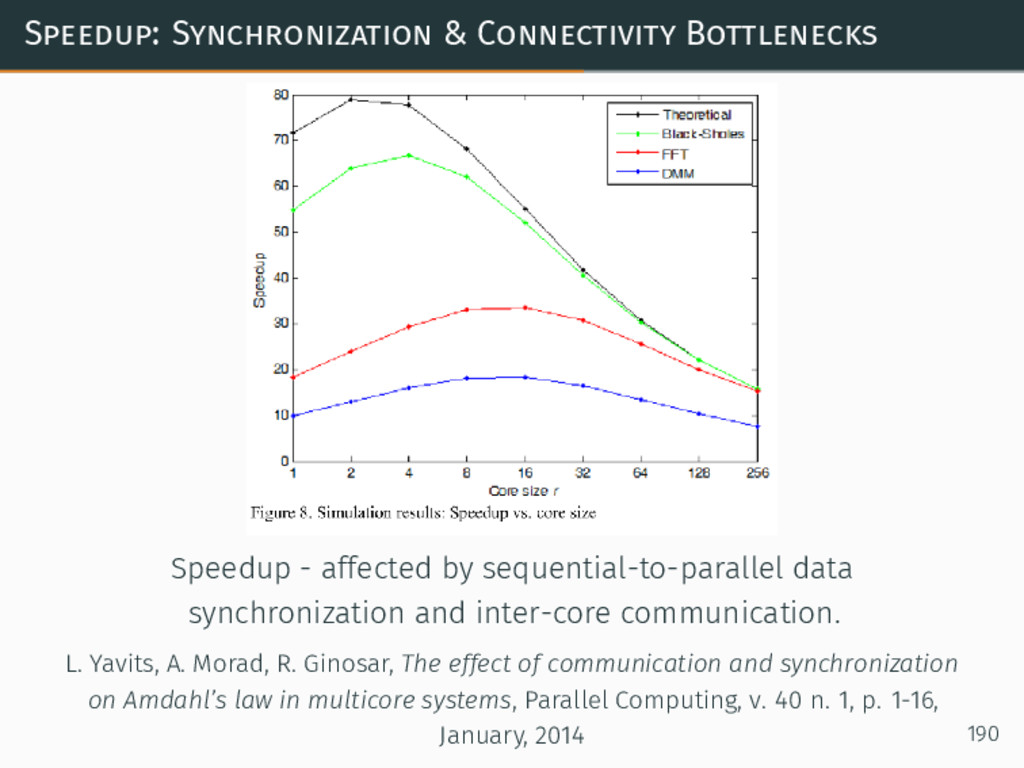
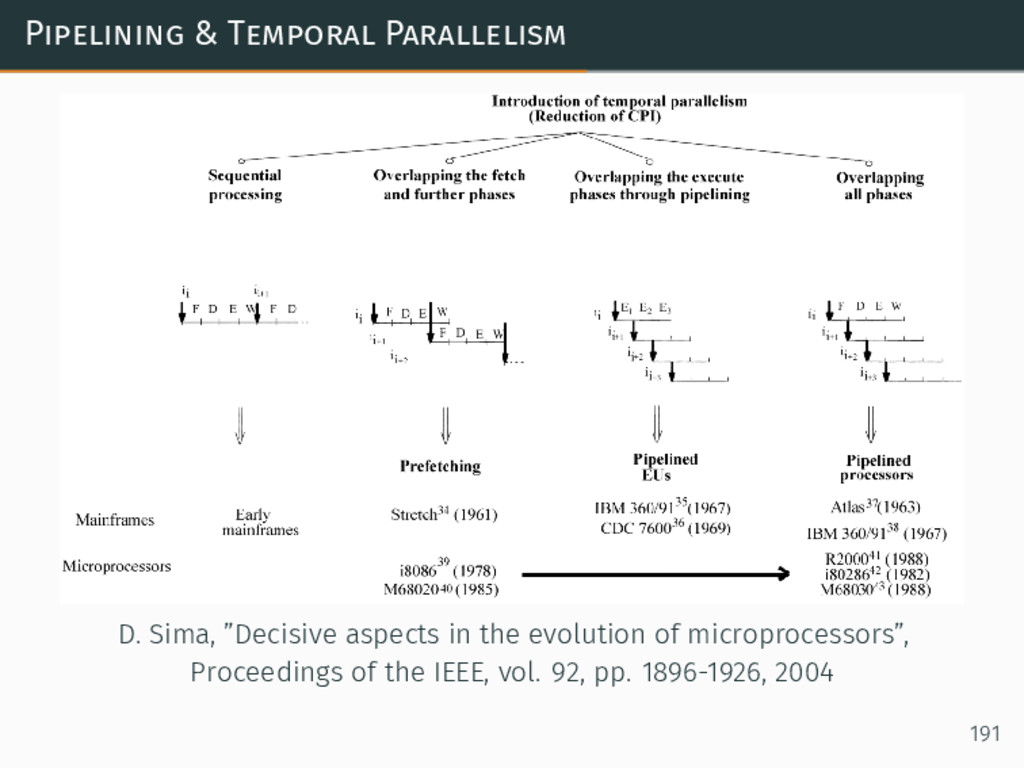
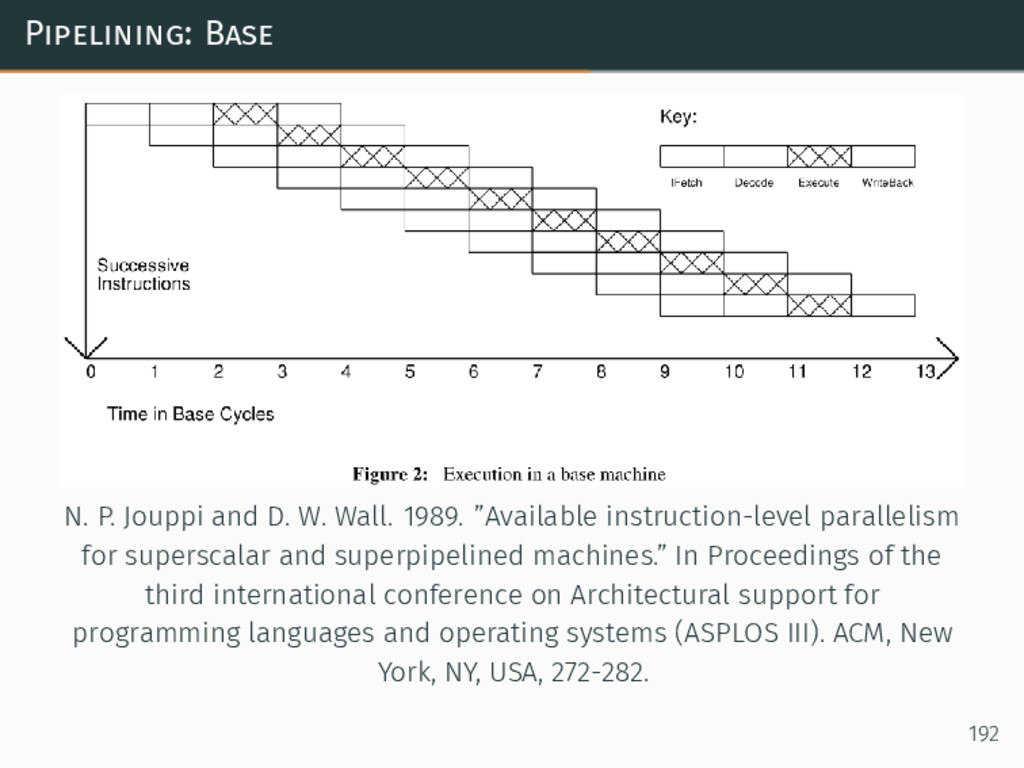
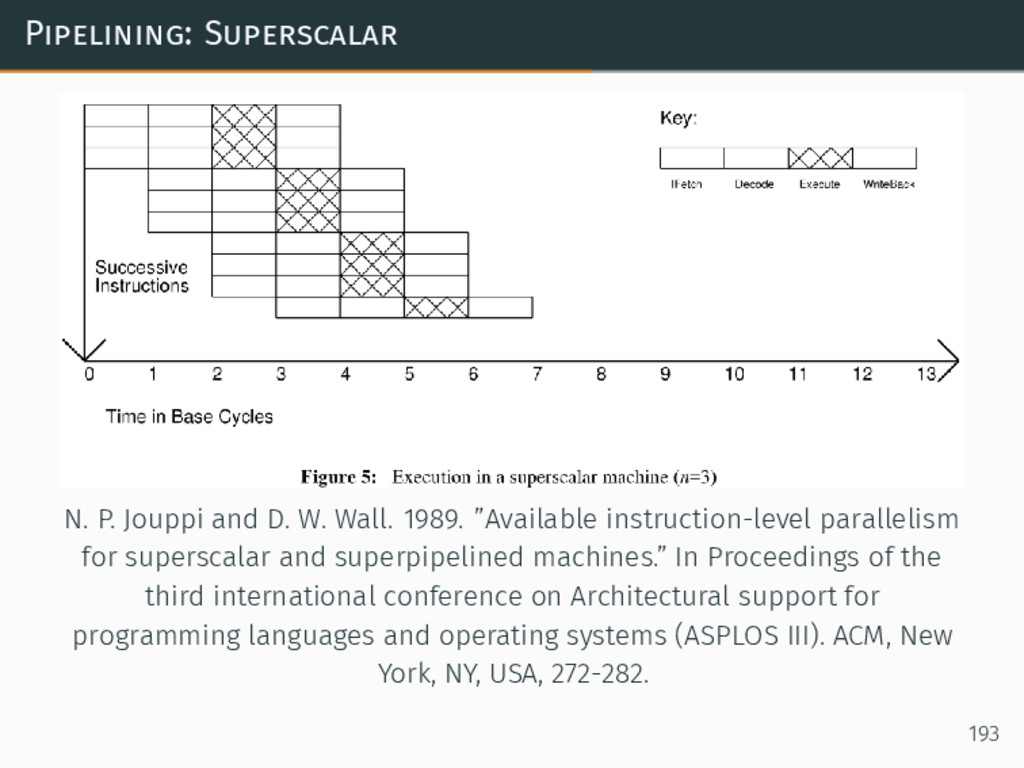
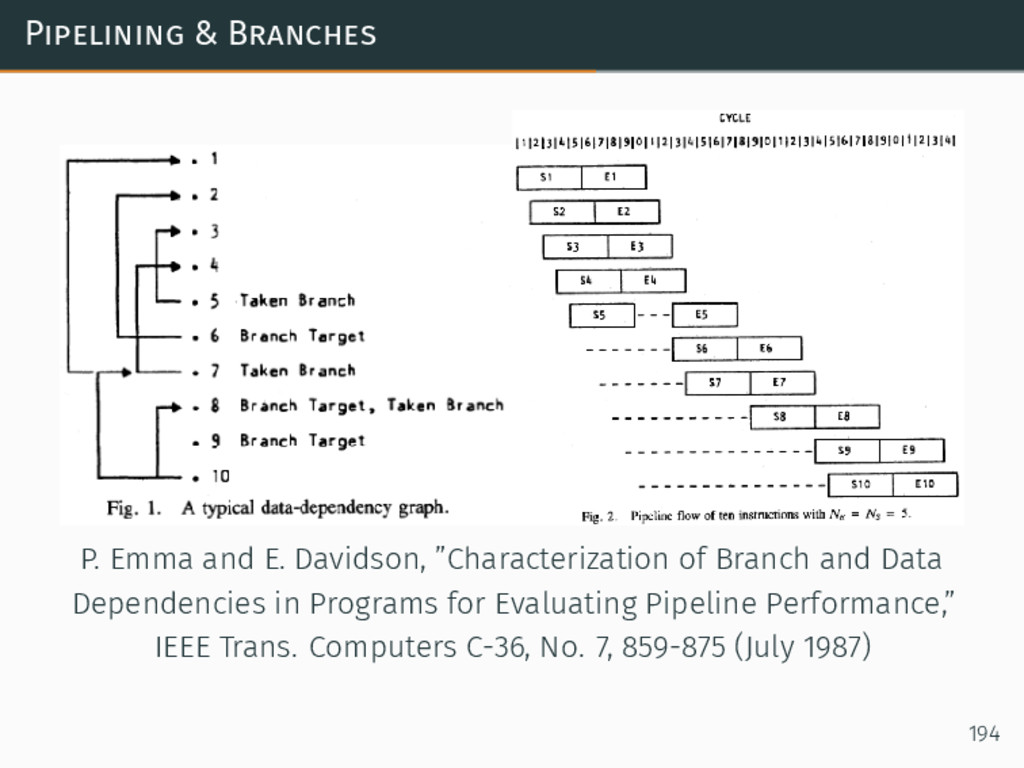
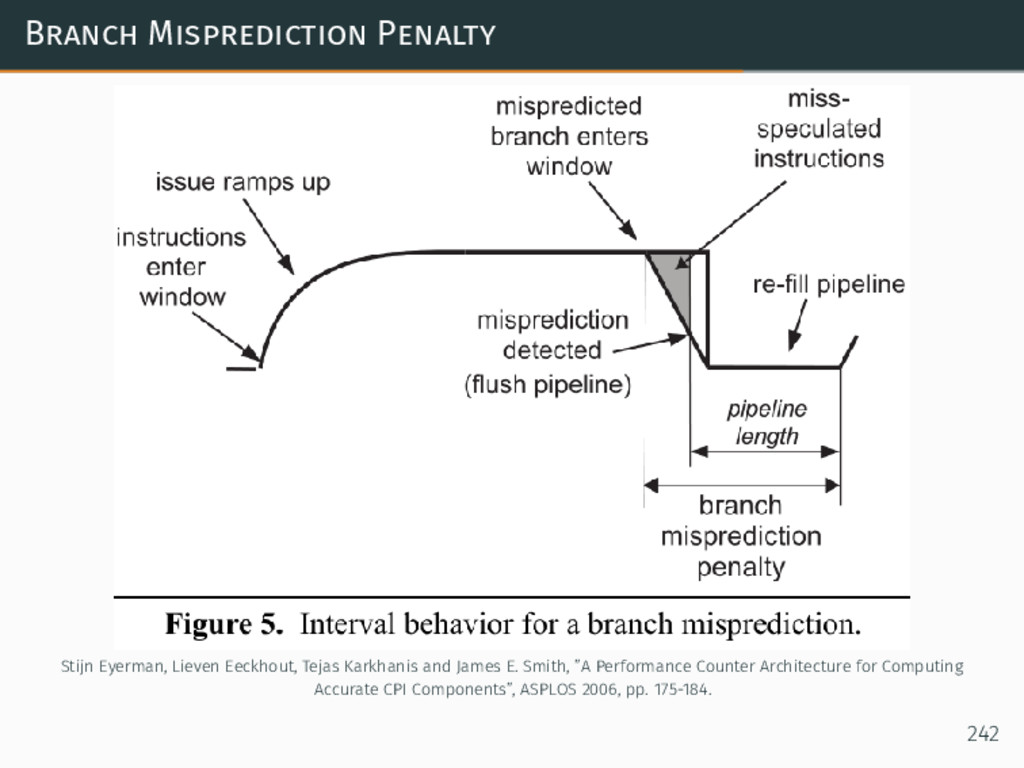
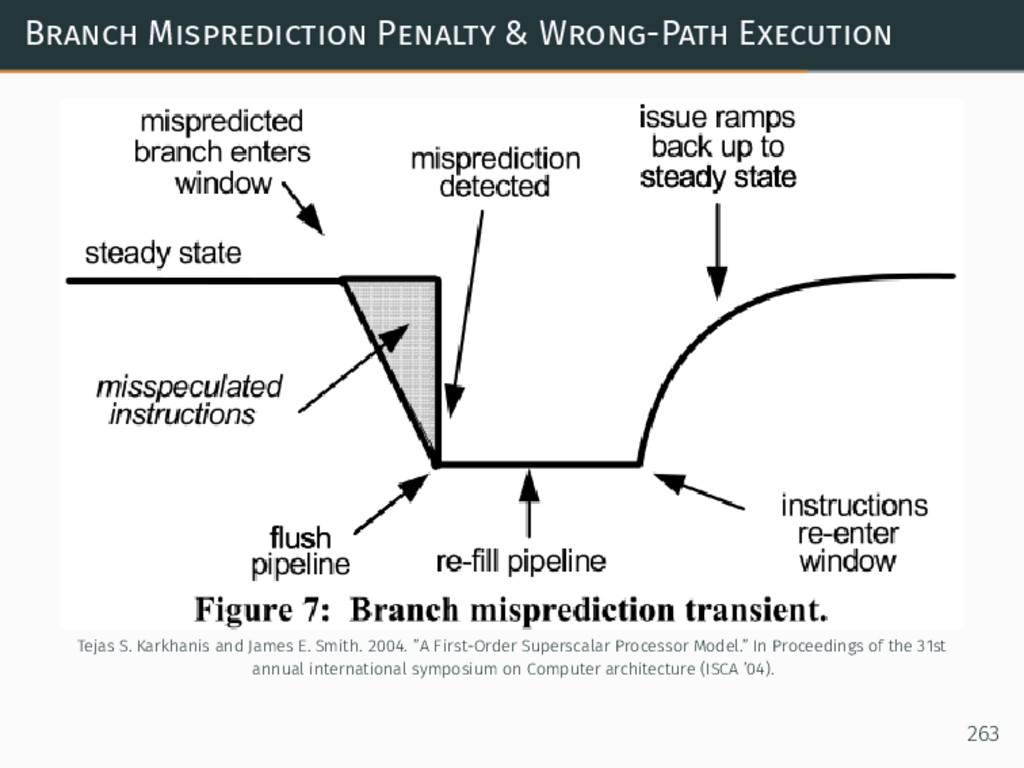
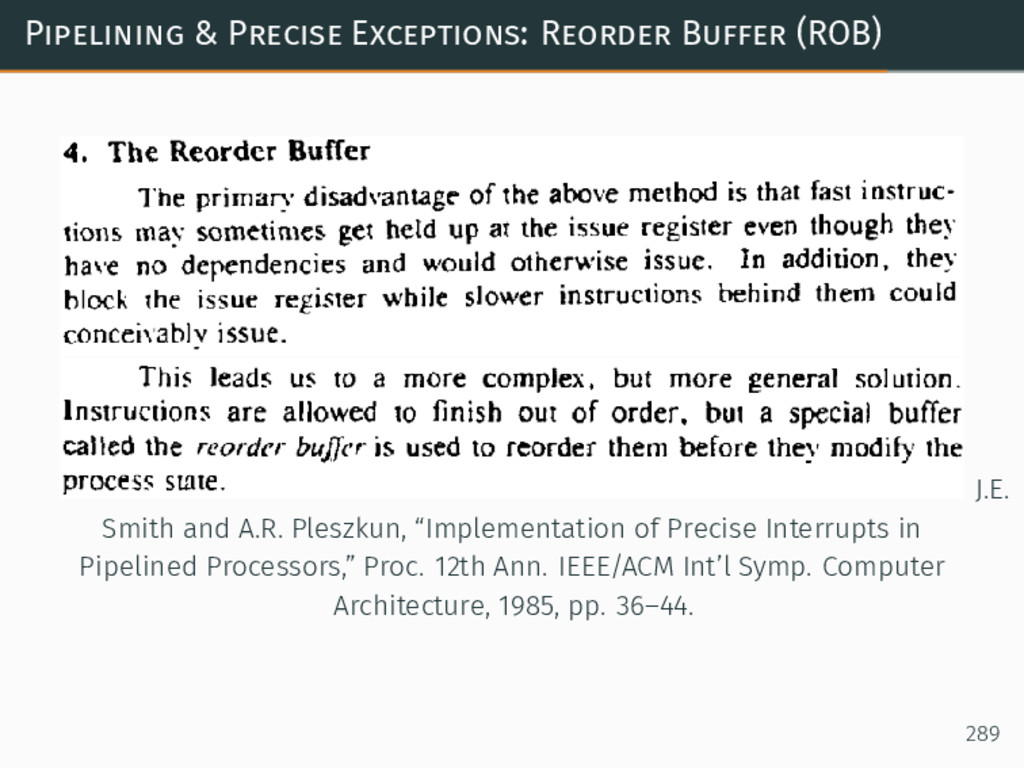
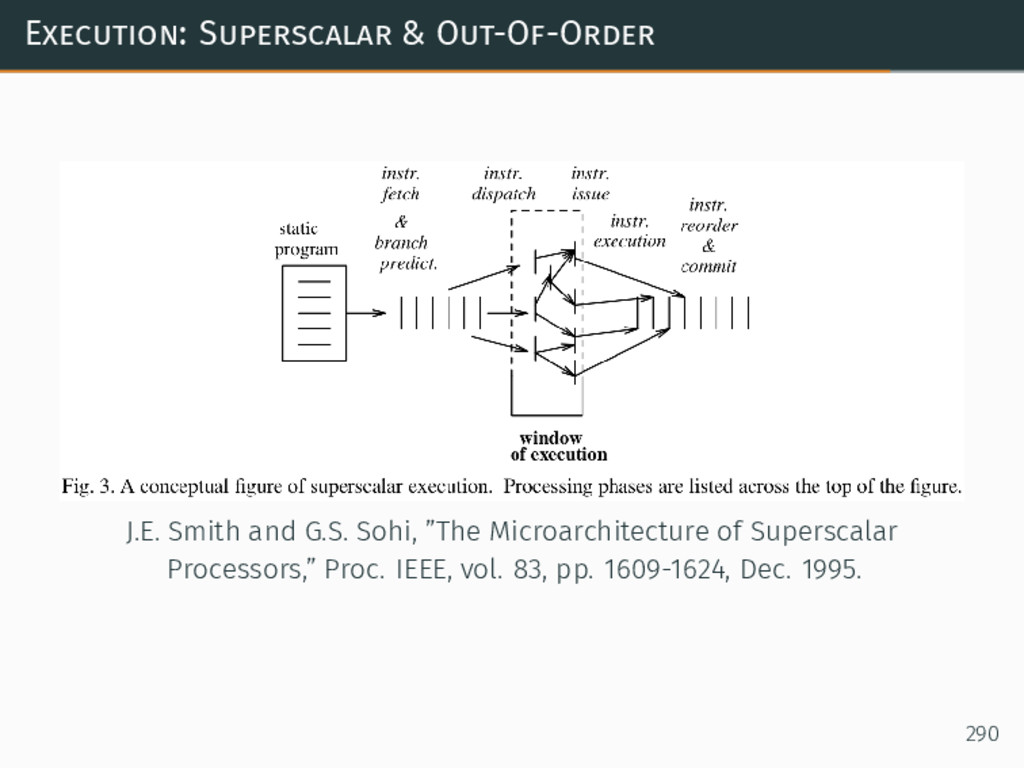
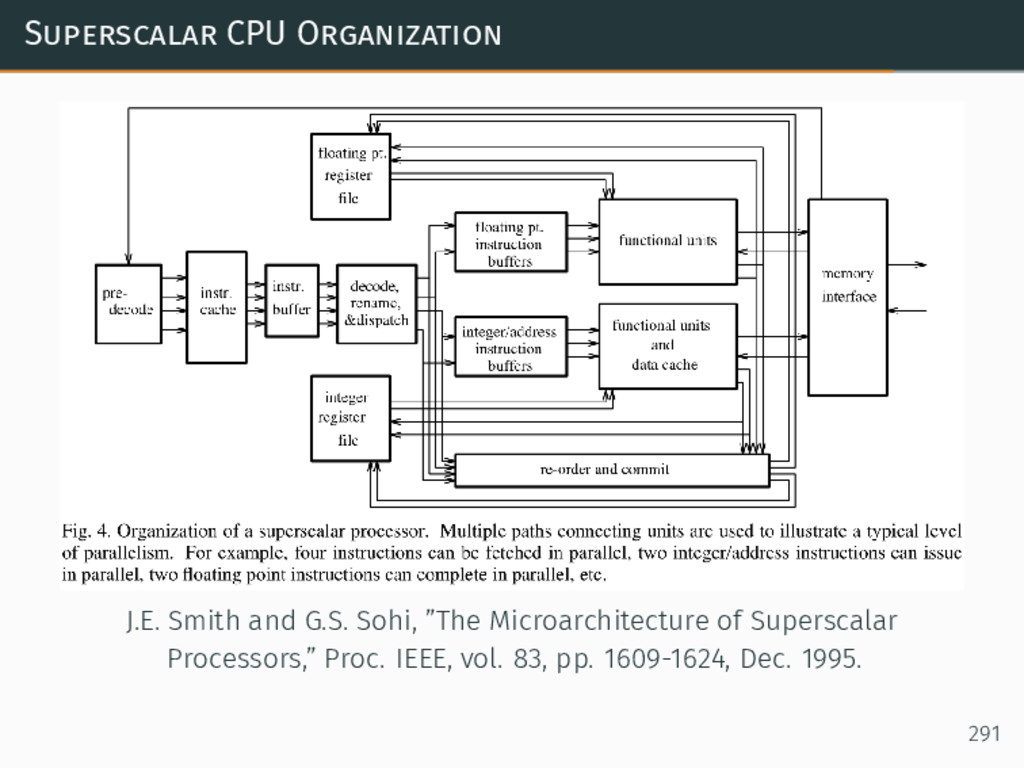
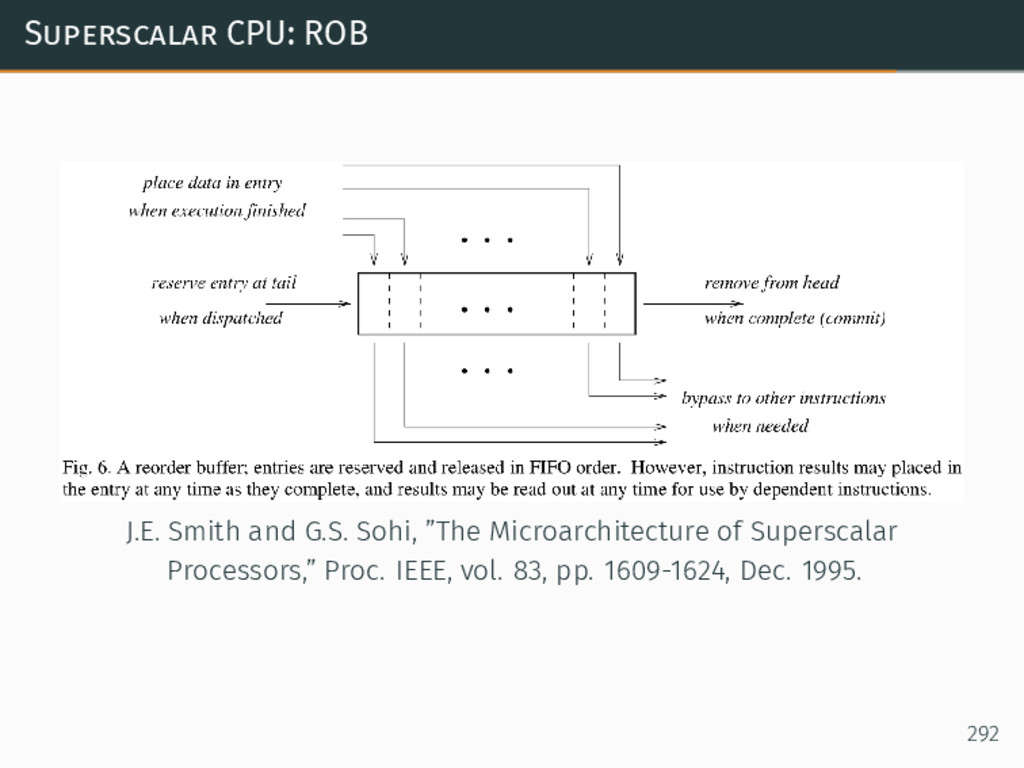
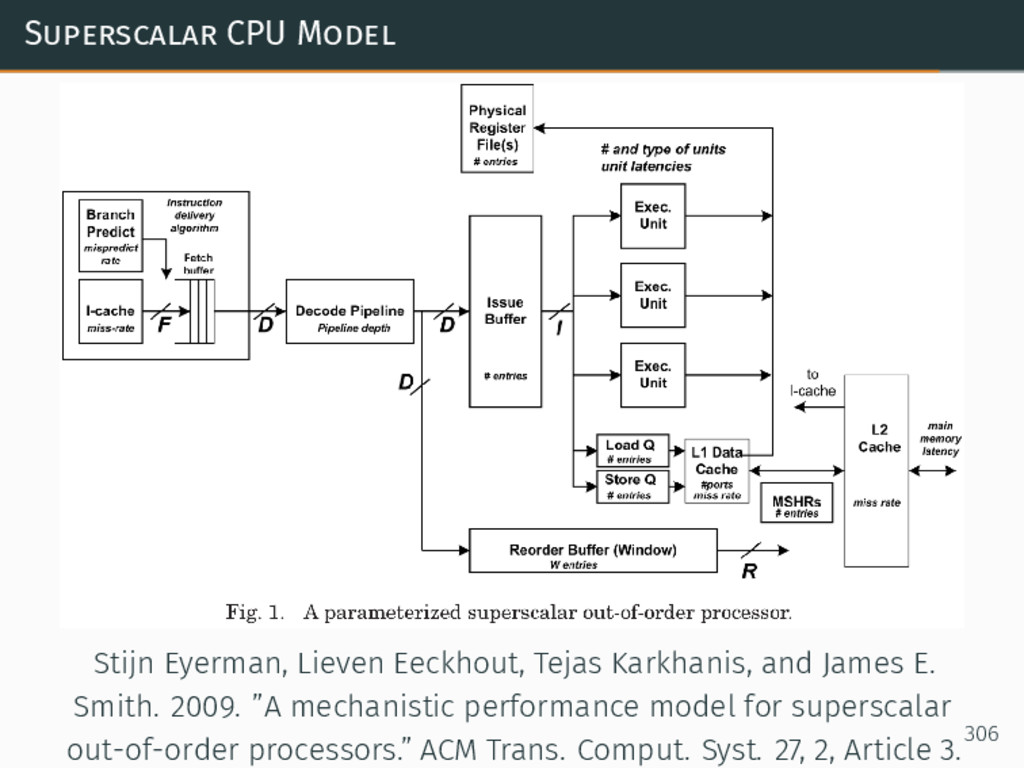
Modern CPU architecture has continued to yield increases in performance through the advances in microarchitecture, such as pipelining, multiple issue (superscalar) out-of-order execution, branch prediction, SIMD-within-a-register (SWAR) vector units, and chip multi-processor (CMP, also known as multi-core) architecture. All of these developments have provided us with the opportunities associated with a higher peak performance -- while at the same time raising new optimization challenges when actually trying to reach that peak.
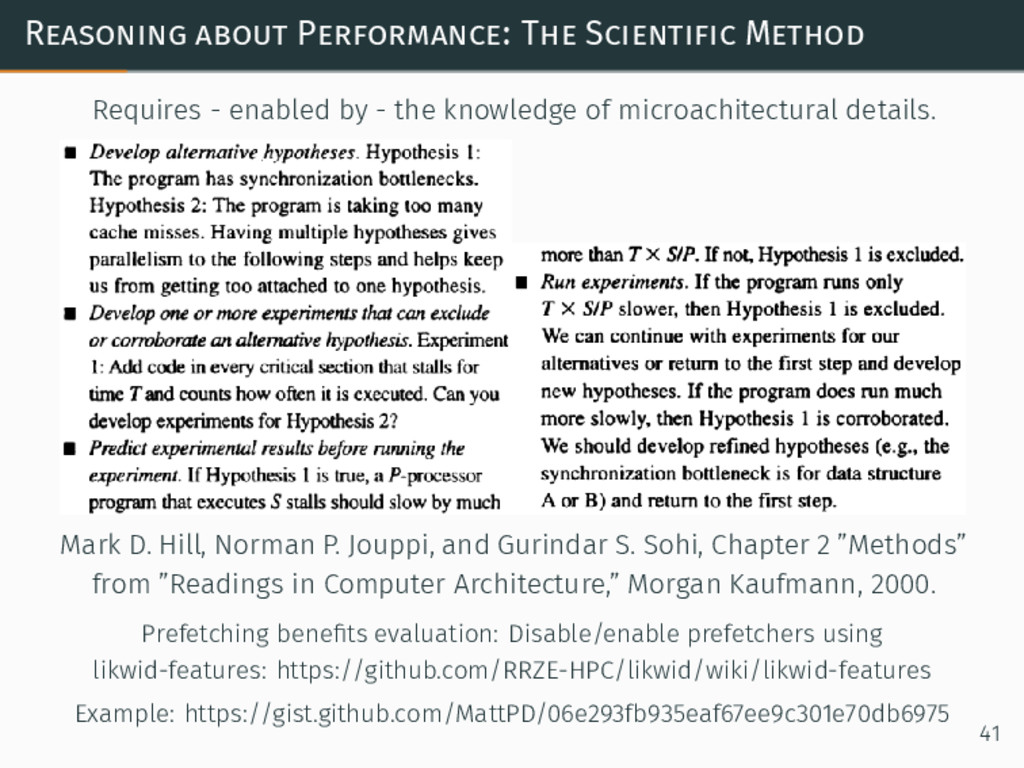
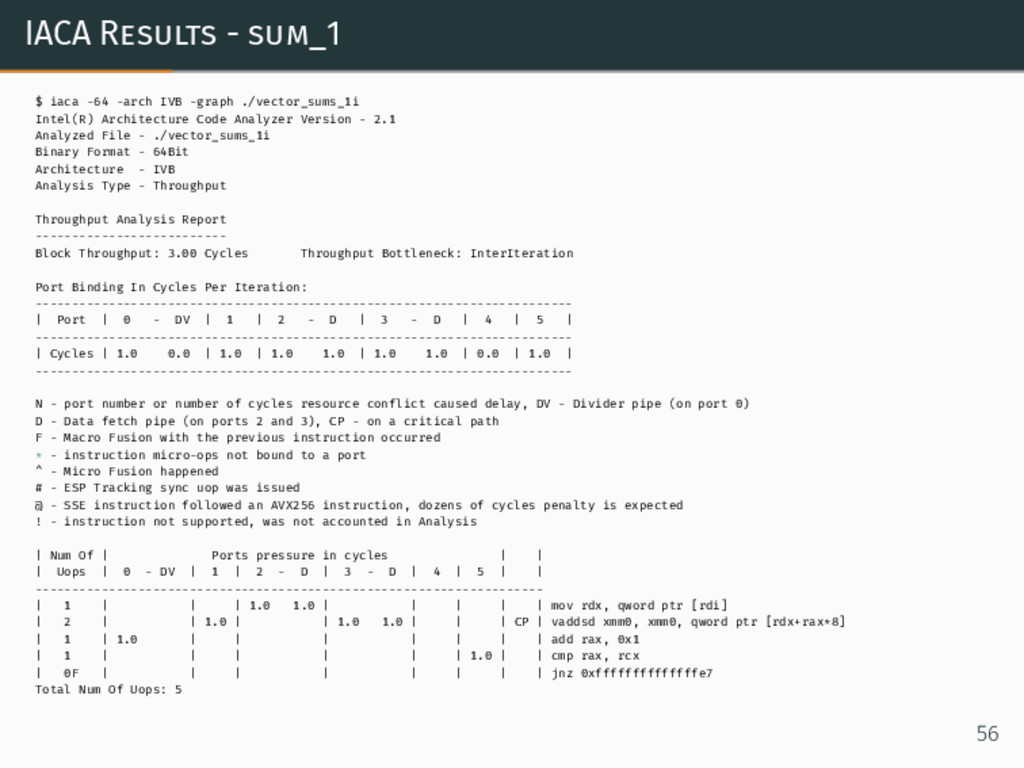
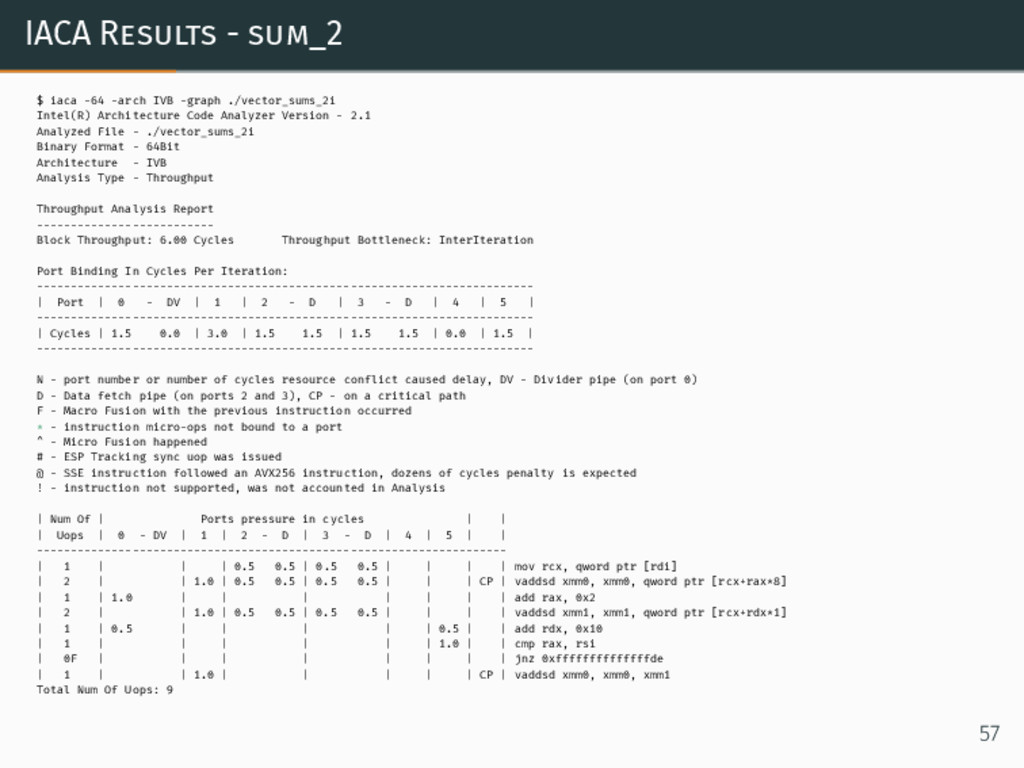
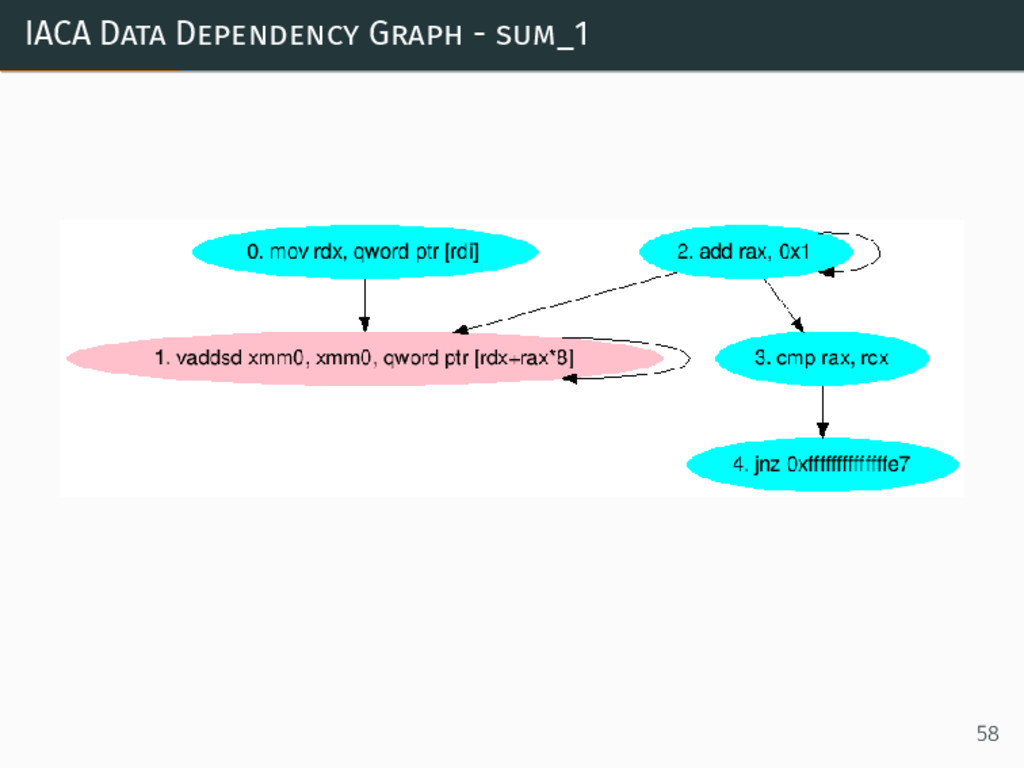
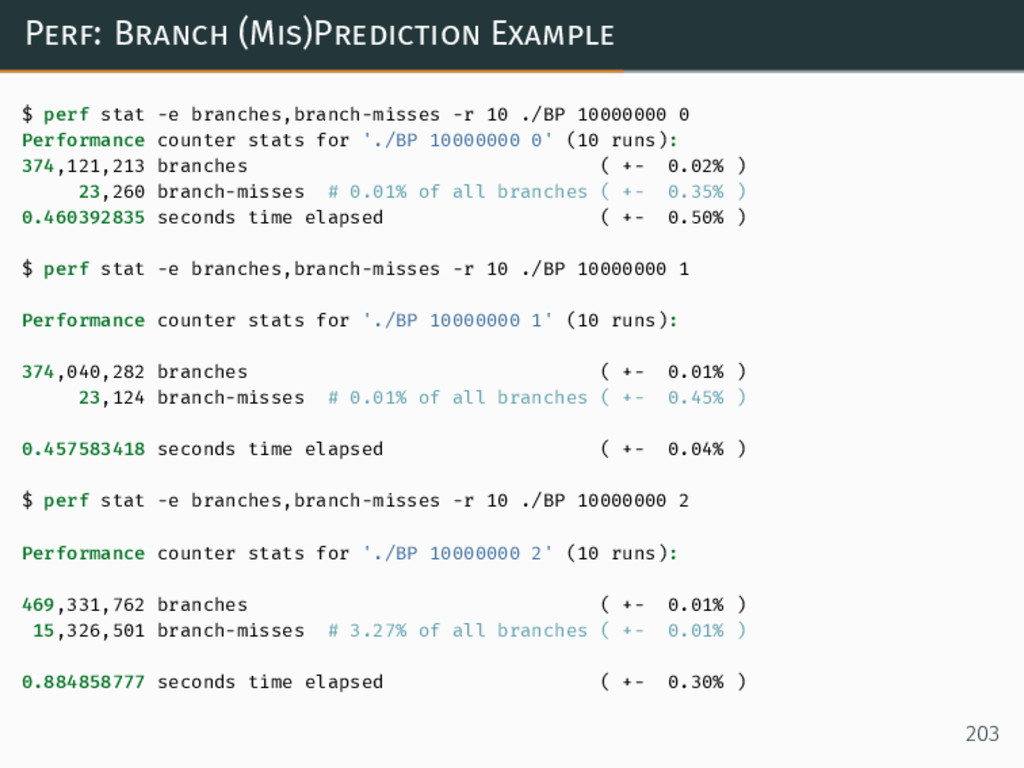
In this talk we'll consider the properties of code which can make it either friendly -- or hostile -- to a modern microprocessor. We will offer advice on achieving higher performance, from the ways of analyzing it beyond algorithmic complexity, recognizing the aspects we can entrust to the compiler, to practical optimization of the existing code. Instead of stopping at the "you should measure it" advice (which is correct, but incomplete), the talk will be focused on providing practical, hands-on examples on _how_ to actually perform the measurements (presenting tools -- including perf and likwid -- simplifying the access to CPU performance monitoring counters) and how to reason about the resulting measurements (informed by the understanding of the modern CPU architecture, generated assembly code, as well as an in-depth look at how the CPU cycles are spent using modern microarchitectural simulation tools) to improve the performance of C++ applications.
Resources:
https://github.com/MattPD/cpplinks/
• https://github.com/MattPD/cpplinks/blob/master/assembly.x86.md
• https://github.com/MattPD/cpplinks/blob/master/comparch.md
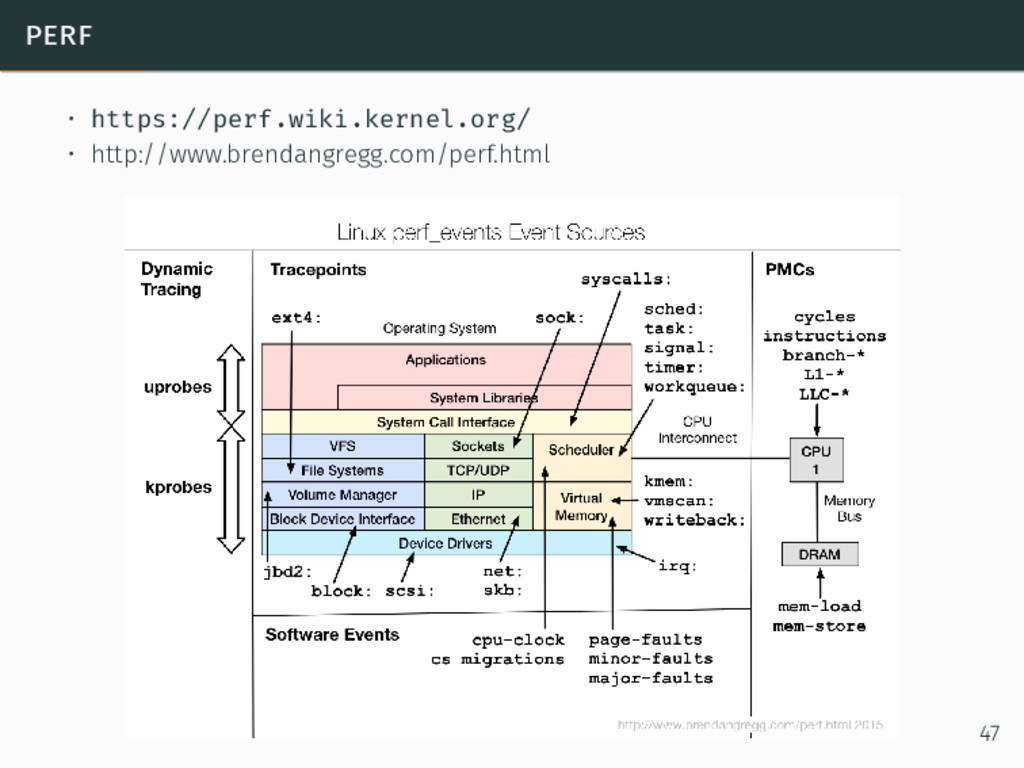
• https://github.com/MattPD/cpplinks/blob/master/performance.tools.md
References:
http://www.agner.org/optimize/
https://users.ece.cmu.edu/~omutlu/lecture-videos.html
](https://files.speakerdeck.com/presentations/63e59e243b224acab518f0259305eae0/slide_29.jpg)
![Performance: [YMMV]PI - Power Grochowski, E., Ronen, R., Shen, J.,](https://files.speakerdeck.com/presentations/63e59e243b224acab518f0259305eae0/slide_74.jpg)
![Performance: [YMMV]PI - Graphs Scott Beamer, Krste Asanović, and David](https://files.speakerdeck.com/presentations/63e59e243b224acab518f0259305eae0/slide_75.jpg)
![Performance: [YMMV]PI - Packets packet_processing_times = seconds/packet = instructions/packet *](https://files.speakerdeck.com/presentations/63e59e243b224acab518f0259305eae0/slide_76.jpg)
![malloc & free - new, new[], delete, delete[] int main()](https://files.speakerdeck.com/presentations/63e59e243b224acab518f0259305eae0/slide_126.jpg)
![new[] & delete[] - dmhg 1/6 126](https://files.speakerdeck.com/presentations/63e59e243b224acab518f0259305eae0/slide_127.jpg)
![new[] & delete[] - dmhg 2/6 127](https://files.speakerdeck.com/presentations/63e59e243b224acab518f0259305eae0/slide_128.jpg)
![new[] & delete[] - dmhg 3/6 128](https://files.speakerdeck.com/presentations/63e59e243b224acab518f0259305eae0/slide_129.jpg)
![new[] & delete[] - dmhg 4/6 129](https://files.speakerdeck.com/presentations/63e59e243b224acab518f0259305eae0/slide_130.jpg)
![new[] & delete[] - dmhg 5/6 130](https://files.speakerdeck.com/presentations/63e59e243b224acab518f0259305eae0/slide_131.jpg)
![new[] & delete[] - dmhg 6/6 131](https://files.speakerdeck.com/presentations/63e59e243b224acab518f0259305eae0/slide_132.jpg)
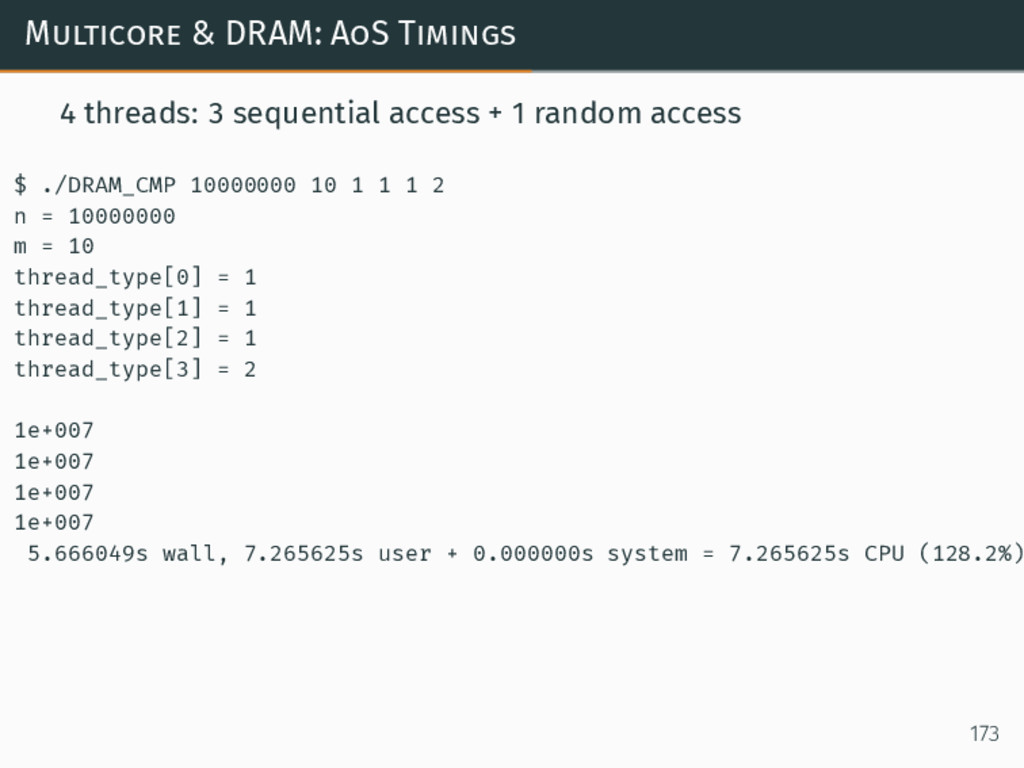
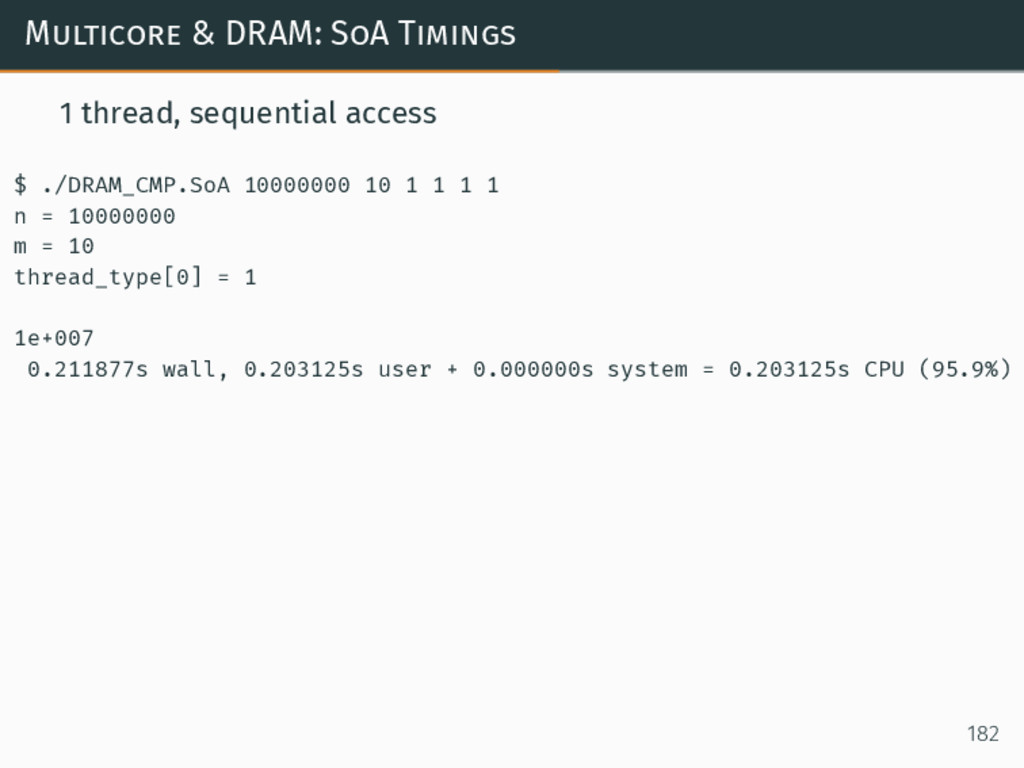
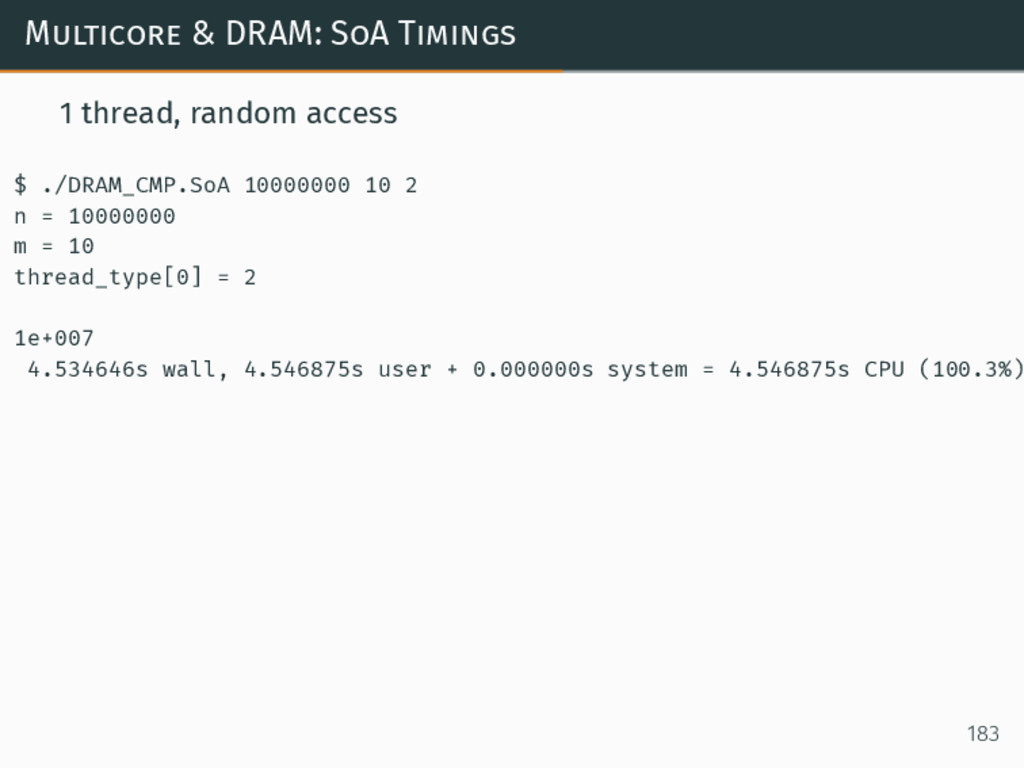
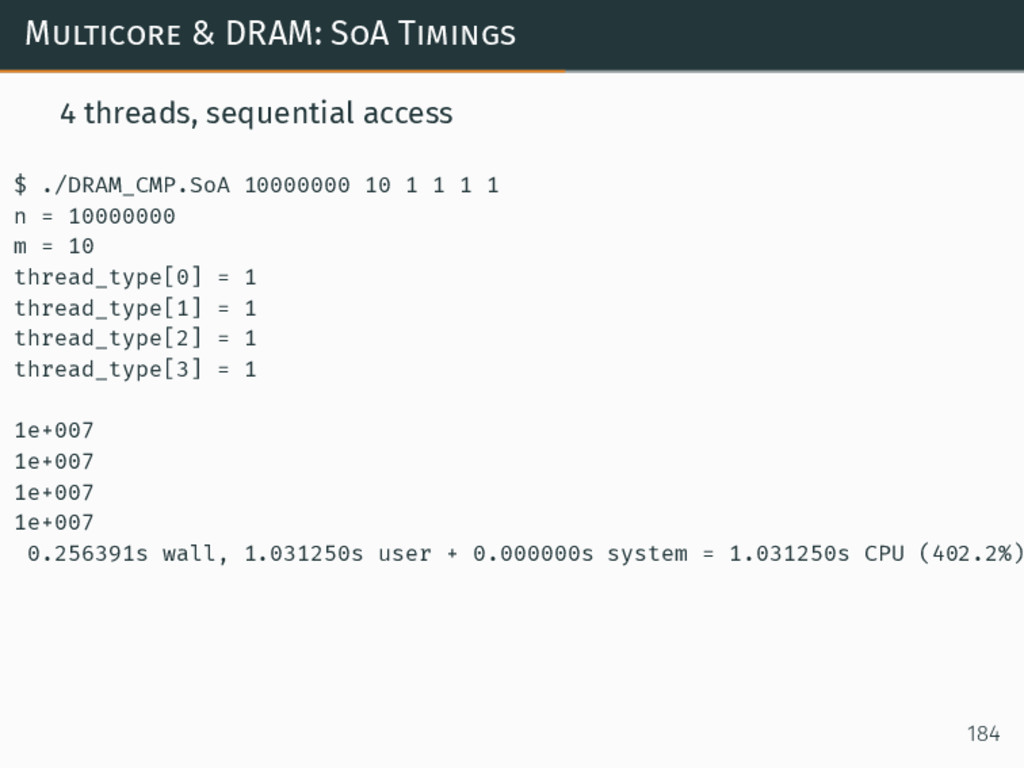
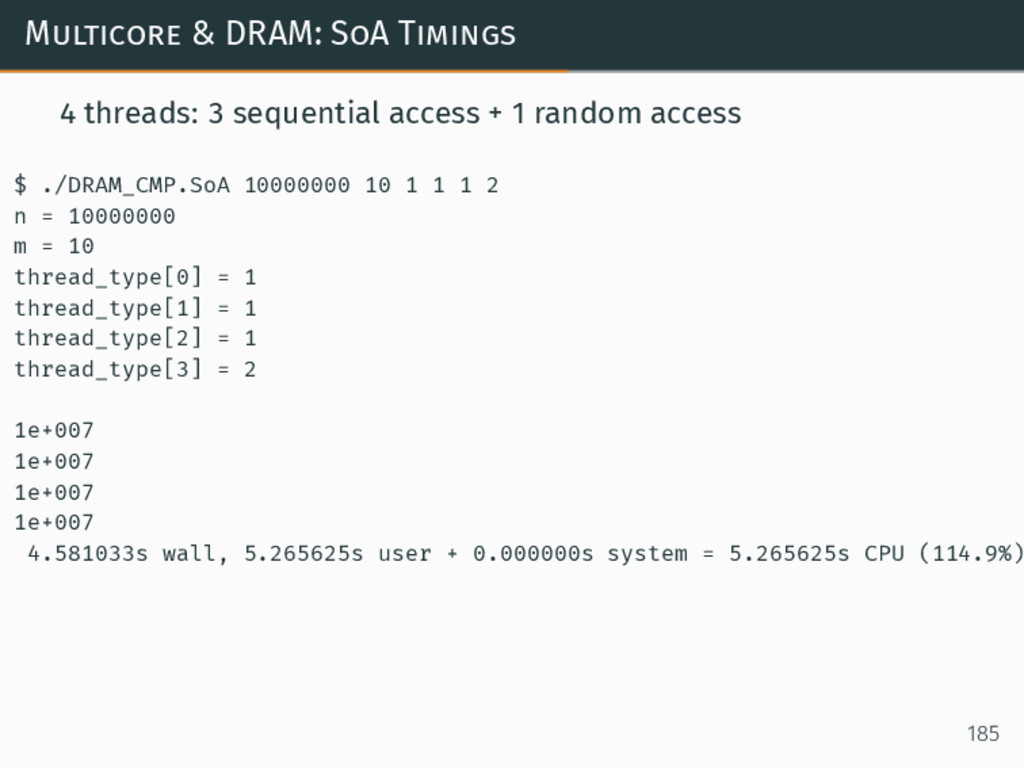
![Multicore & DRAM: SoA V thread_type[thread] = (argc > 3](https://files.speakerdeck.com/presentations/63e59e243b224acab518f0259305eae0/slide_180.jpg)