Upgrade to Pro — share decks privately, control downloads, hide ads and more …

uWestFest 2016

uWestFest 2016

Slides from uWestFest 2016 in San Diego for Umbraco and the Need for Speed.

Matt Shull

March 04, 2016
Tweet

More Decks by Matt Shull

Other Decks in Programming

Transcript

  1. Umbraco and the
    Need for Speed
    uWestFest 2016 – San Diego, CA

    View Slide

  2. Matt Shull
    Director of Labs
    Aristotle Interactive
    aristotle.net
    aristotleinteractive.com
    mattshull.com
    @themattshull
    [email protected]

    View Slide

  3. mattshull.com/umbraco

    View Slide

  4. Why Performance Matters
    First and foremost, we believe that
    speed is more than a feature. Speed
    is the most important feature.
    -Fred Wilson

    View Slide

  5. Why Performance Matters

    View Slide

  6. Why Performance Matters

    View Slide

  7. Why Performance Matters
    Up to 40% of users will abandon 
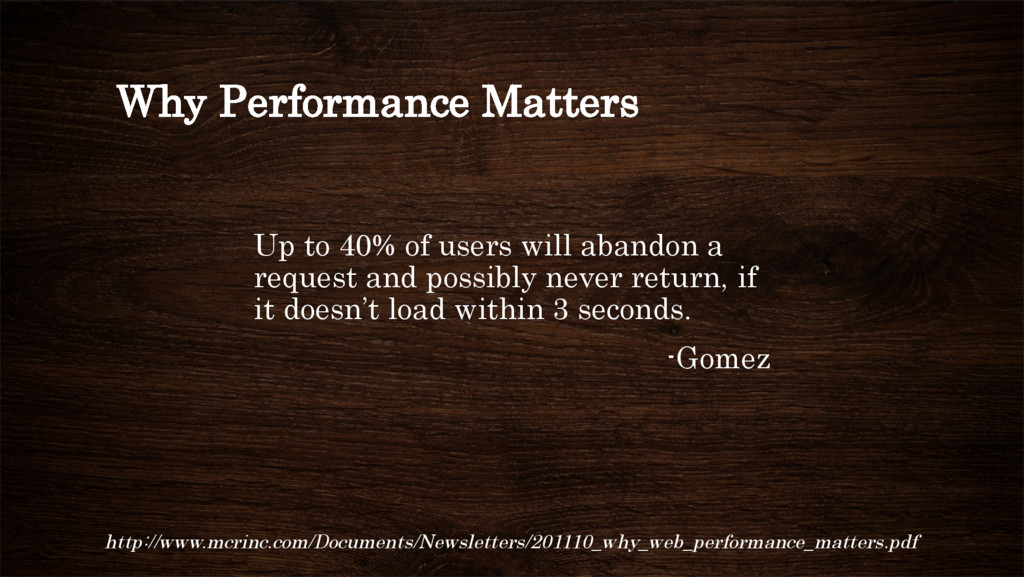
a
    request and possibly never return, if
    it doesn’t load within 3 seconds.
    -Gomez
    http://www.mcrinc.com/Documents/Newsletters/201110_why_web_performance_matters.pdf

    View Slide

  8. View Slide

  9. Why Performance Matters
    Walmart saw up to a 2% increase 
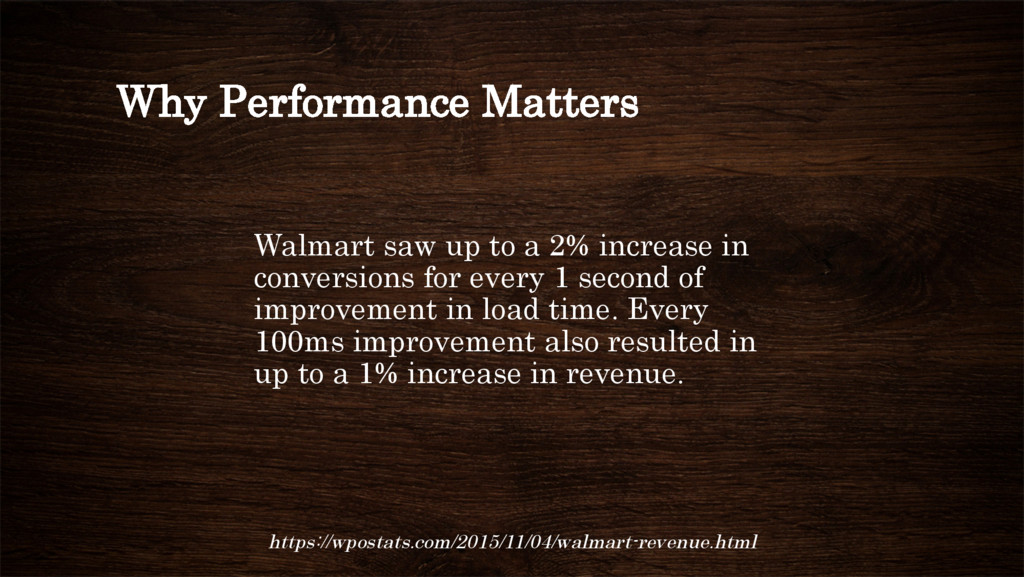
in
    conversions for every 1 second of
    improvement in load time. Every
    100ms improvement also resulted in
    up to a 1% increase in revenue.
    https://wpostats.com/2015/11/04/walmart-revenue.html

    View Slide

  10. Why Performance Matters
    The Aberdeen Group discovered a 1-
    second 
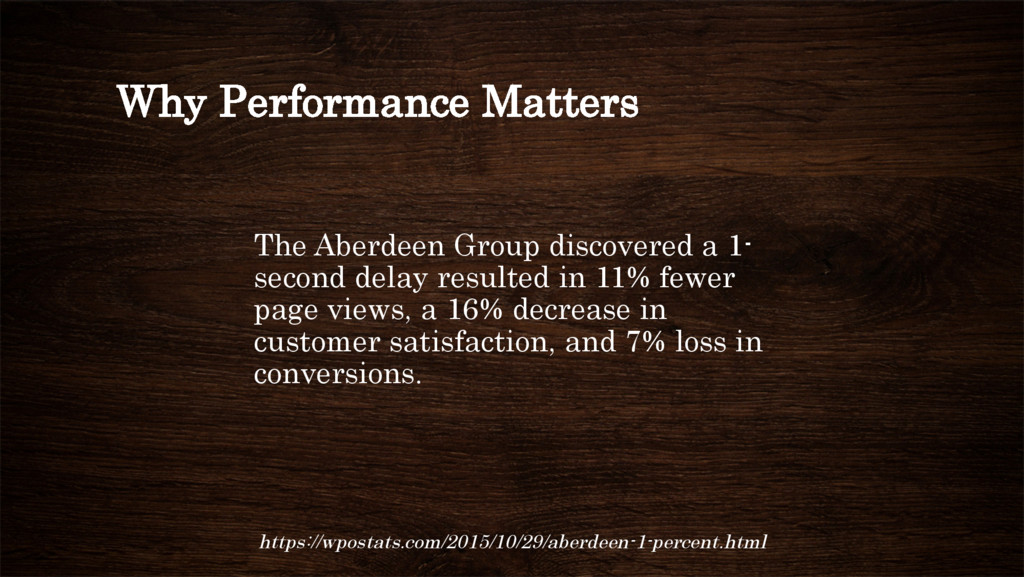
delay resulted in 11% fewer
    page views, a 16% decrease in
    customer satisfaction, and 7% loss in
    conversions.
    https://wpostats.com/2015/10/29/aberdeen-1-percent.html

    View Slide

  11. Why Performance Matters
    Mozilla cut load time by 2.2 seconds
    and saw download conversions
    increase by 15.4%
    https://wpostats.com/2015/10/29/mozilla-2point2.html

    View Slide

  12. Total Load Time

    View Slide

  13. Time to First Byte
    TTFB measures the duration from
    the user or client making an HTTP
    request to the first byte of the page
    being received by the client's
    browser.

    View Slide

  14. View Slide

  15. View Slide

  16. View Slide

  17. Time to First Byte
    •  Rendering of server side code
    –  API calls
    –  Slow SQL queries
    •  Connection to the server
    –  Memory leaks
    –  Poor server resources

    View Slide

  18. Speed Index
    Speed Index is the average time at
    which visible parts of the page are
    displayed. It is expressed in
    milliseconds and dependent on size
    of the view port.

    View Slide

  19. Page Size
    Page size measures the number of
    kilobytes the site downloads to the
    user’s device.

    View Slide

  20. The Good Stuff

    View Slide

  21. Images
    ~63%
    http://httparchive.org/interesting.php

    View Slide

  22. Image File Types
    WebP
    •  Uses transparency
    •  Animation
    •  Photographs
    •  50%-75% smaller
    •  Android and Chrome

    View Slide

  23. Image File Types

    View Slide

  24. Image File Types
    JPEG2000
    •  Uses transparency
    •  Photographs
    •  Sometimes smaller

    View Slide

  25. Image File Types

    View Slide

  26. Responsive Images

    View Slide

  27. Responsive Images


    View Slide

  28. Responsive Images
    https://github.com/scottjehl/picturefill

    View Slide

  29. Responsive Images
    https://modernizr.com/
     
           .webp  .container  {  
     background-­‐image:  url(‘image.webp’);  
           }  
     
           .no-­‐webp  .container  {  
     background-­‐image:  url(‘image.jpeg’);  
           }  
     

    View Slide

  30. CSS
    ~3.5%
    http://httparchive.org/interesting.php

    View Slide

  31. CSS
    •  Minify files
    •  Split into 3 files
    – Above the fold main page
    – Below the fold main page
    – Interior
    •  Use LoadCSS to load in below the fold css
    – Use as a fallback

    View Slide

  32. Fonts
    ~5.5%
    http://httparchive.org/interesting.php

    View Slide

  33. Fonts
    •  Reduce font weights
    •  Strip out characters not needed using Font Squirrel
    •  Use default fonts if possible

    View Slide

  34. Fonts
    •  Font loading event built into browsers soon
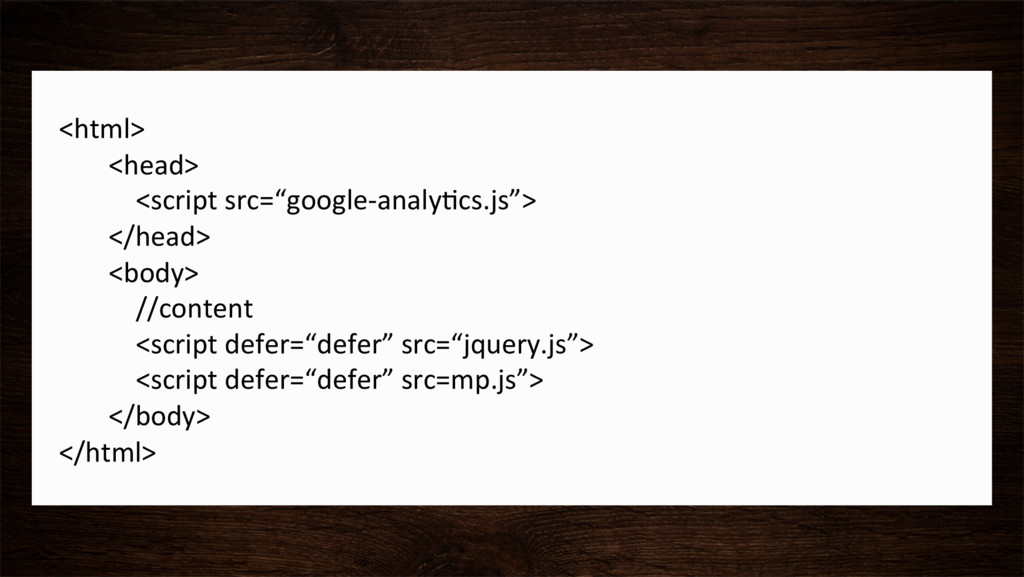
    •  Use current tools for best browser support
    – Font face observer
    – Google Web Font Loader
    – LoadCSS
    •  Decide whether you want FOIT (Flash of Invisible
    Text) or FOUT (Flash of Unstyled Text)

    View Slide

  35. Javascript
    ~16%
    http://httparchive.org/interesting.php

    View Slide

  36. Javascript
    •  Minify files
    •  Use HTML/CSS alternatives
    – Image rotators
    – Tabs
    – Responsive Navigation
    •  Split into mainpage.js and interior.js

    View Slide

  37. Javascript

    View Slide

  38. Javascript


               <br/>  </head>  <br/>  <body>  <br/>          //content  <br/>          <script  defer=“defer”  src=“jquery.js”>  <br/>          <script  defer=“defer”  src=mp.js”>  <br/>  </body>  <br/>        </html>  <br/>  <br/>

    View Slide

  39. Javascript: Lessons Learned
    •  Umbraco Forms
    •  AJAX all the things!

    View Slide

  40. Browser Hints
    •  DNS Prefetch
    •  Preconnect
    •  Prefetch
    •  Prerender

    View Slide

  41. Browser Hints: Prefetch
    •  Download and cache specific files once the browser is
    idle.


    View Slide

  42. Browser Hints: Prerender
    •  Download and cache an entire page


    View Slide

  43. https://www.youtube.com/watch?v=_Jn93FDx9oI

    View Slide

  44. Measuring
    Performance

    View Slide

  45. Measuring Performance
    •  RUM
    – Real User Data
    – Measured using browser APIs
    •  Synthetic
    – Simulated User Testing
    – Simulated using real devices and browsers

    View Slide

  46. Median vs Average

    View Slide

  47. Measuring Performance: RUM
    •  Navigation Timing API
    •  Resource Timing API
    •  User Timing API

    View Slide

  48. View Slide

  49. Navigation Timing API
    •  Backend Time = responseEnd – requestStart
    •  Time to First Byte = responseStart – connectEnd
    •  Frontend Time = now – domLoading
    •  Total Time = now – navigationStart

    View Slide

  50. Navigation Timing API

    View Slide

  51. Resource Timing API
    •  Measure the performance of each resource being
    downloaded by the user.
    •  TTFB = responseStart – startTime
    •  DNS Lookup = domainLookupEnd – domain
    LookupStart
    •  TCP = connectEnd – connectStart

    View Slide

  52. Resource Timing API

    View Slide

  53. User Timing API
    •  Measure performance of web applications with high
    precision timing.
    •  mark()
    •  measure()

    View Slide

  54. User Timing API
     
           window.performance.mark(‘start_req’);  
     
           $.get(‘./example.json’,  funcNon(data)  {  
     //do  something  with  data  
     window.performance.mark(‘end_req’);  
     
     window.performance.measure(‘measure_req’,  ‘start_req’,  ‘end_req’);  
           });  
     

    View Slide

  55. User Timing API
     
           window.performance.getEntriesByName(‘start_req’);  
     
           window.performance.getEntriesByName(‘end_req’);  
     
           window.performance.getEntriesByName(‘measure_req’);  
     

    View Slide

  56. User Timing API

    View Slide

  57. Measuring Performance: Synthetic
    •  WebPageTest.org
    •  Soasta
    •  Speed Curve

    View Slide

  58. Beware of False Performance Prophets
    •  Google AMP
    •  Facebook Instant Articles
    •  Apple News

    View Slide

  59. Creating a Culture of Performance
    •  Has to come from 
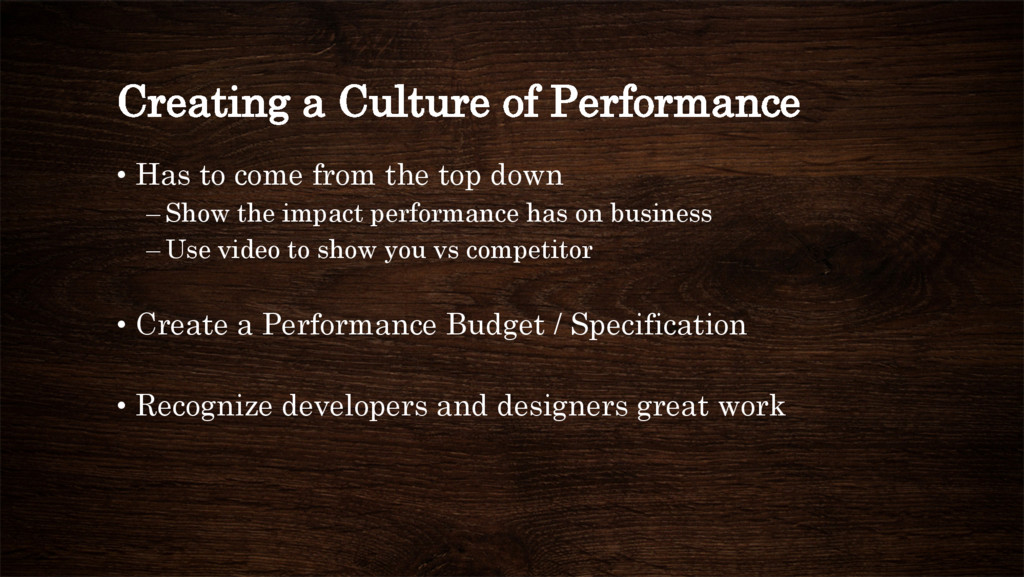
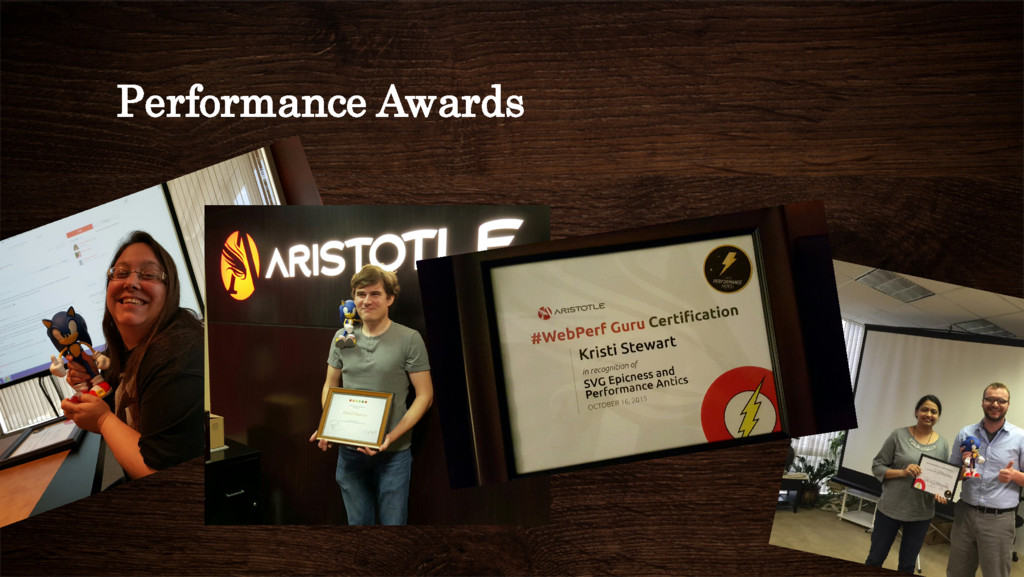
the top down
    – Show the impact performance has on business
    – Use video to show you vs competitor
    •  Create a Performance Budget / Specification
    •  Recognize developers and designers great work

    View Slide

  60. Performance Budget
    •  HTML: 5%
    •  CSS: 10%
    •  Javascript: 10%
    •  Images: 65%
    •  Fonts: 5%
    •  Other: 5%
    •  Page Size Goal: 1500 kb (+/- 500 kb)

    View Slide

  61. Performance Awards

    View Slide

  62. What’s Next?
    •  Javascript API for detecting connection speed
    •  Measuring speed index in RUM
    •  Changes to stylesheets

    View Slide

  63. We’re Just Scratching the Surface
    •  Designing for Performance by Lara Hogan
    •  Follow Tammy Everts on Twitter and Blog
    •  Follow Steve Souders Twitter and Blog
    •  More resources at mattshull.com/umbraco

    View Slide

  64. Thank you!
    mattshull.com/umbraco
    aristotleinteractive.com

    View Slide