Web Performance: Forget Everything I Said Last Time
An updated version of my web performance talk from a few years ago. Here we explain what's changed, what's the same, and how to dive deeper into user centric performance metrics.
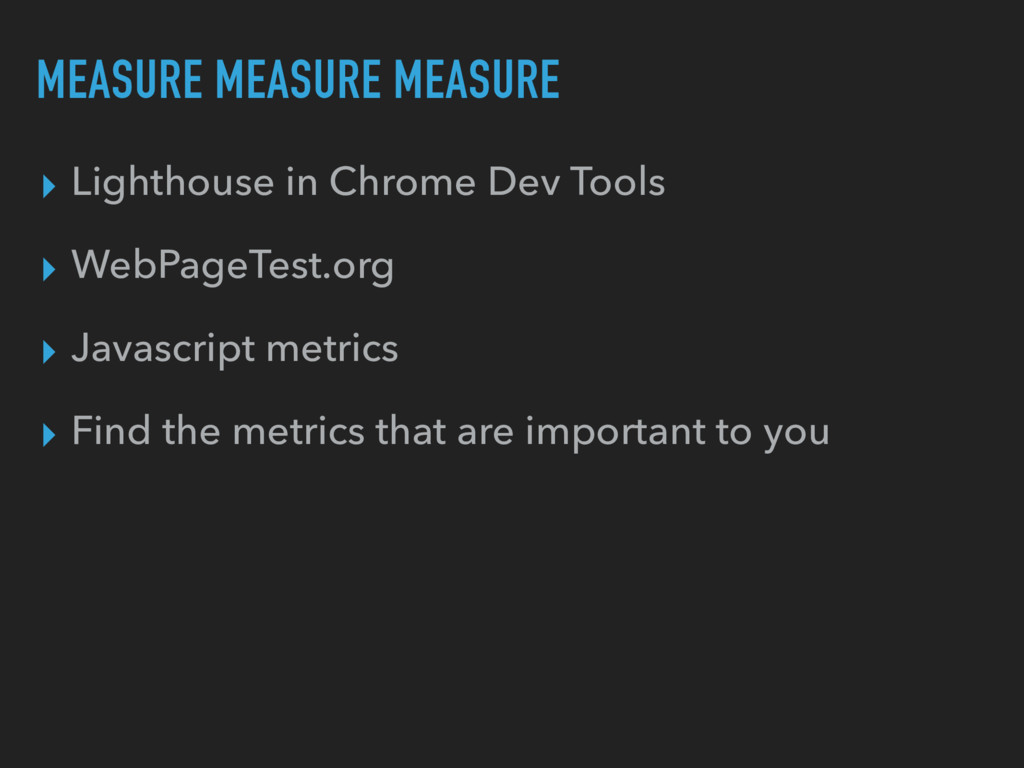
▸ Use the right type of images ▸ PNGs can be better than JPEGs ▸ Sometimes all you need is an SVG ▸ WebP All The Things (when it helps) ▸ Measure Measure Measure!!!
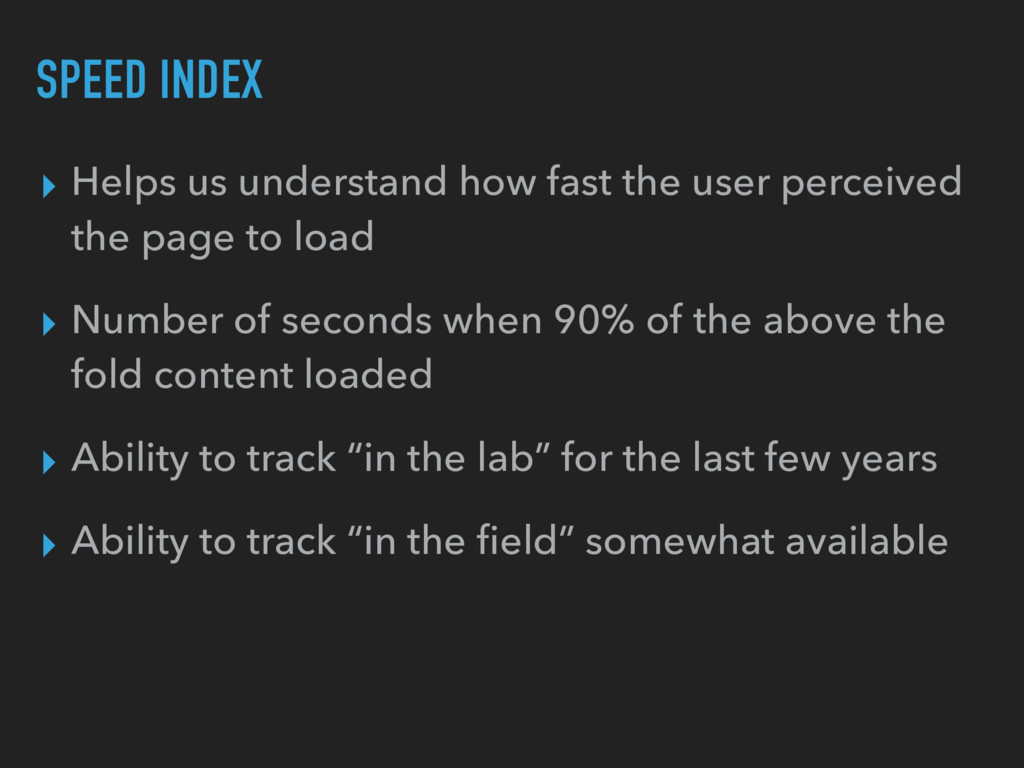
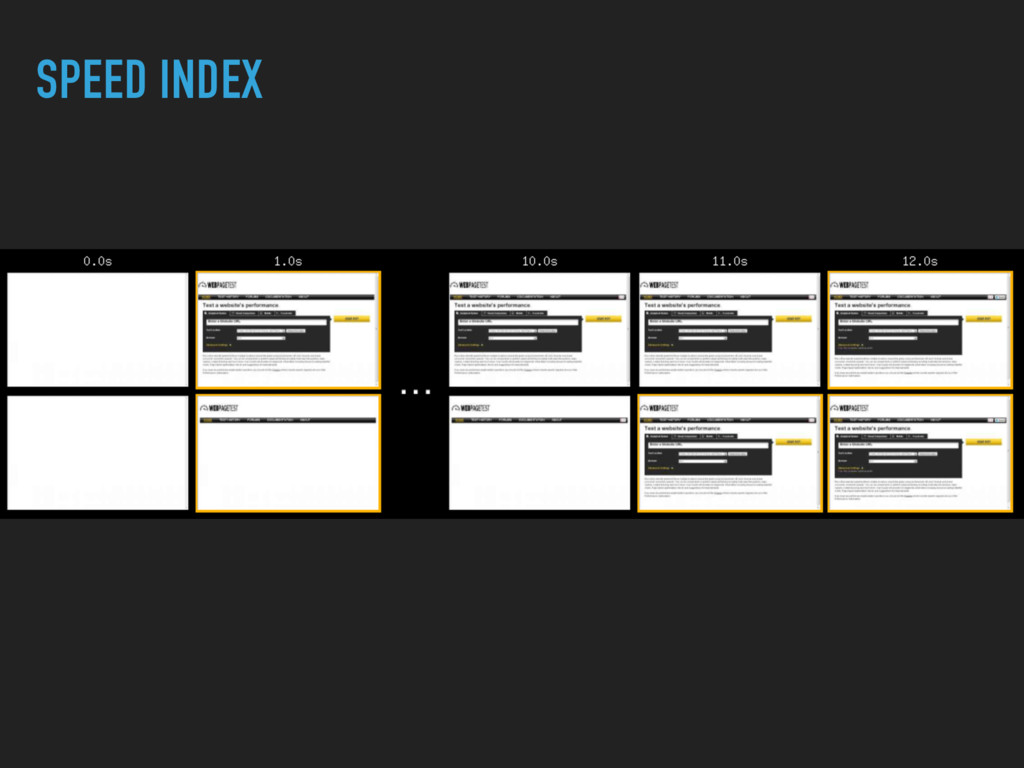
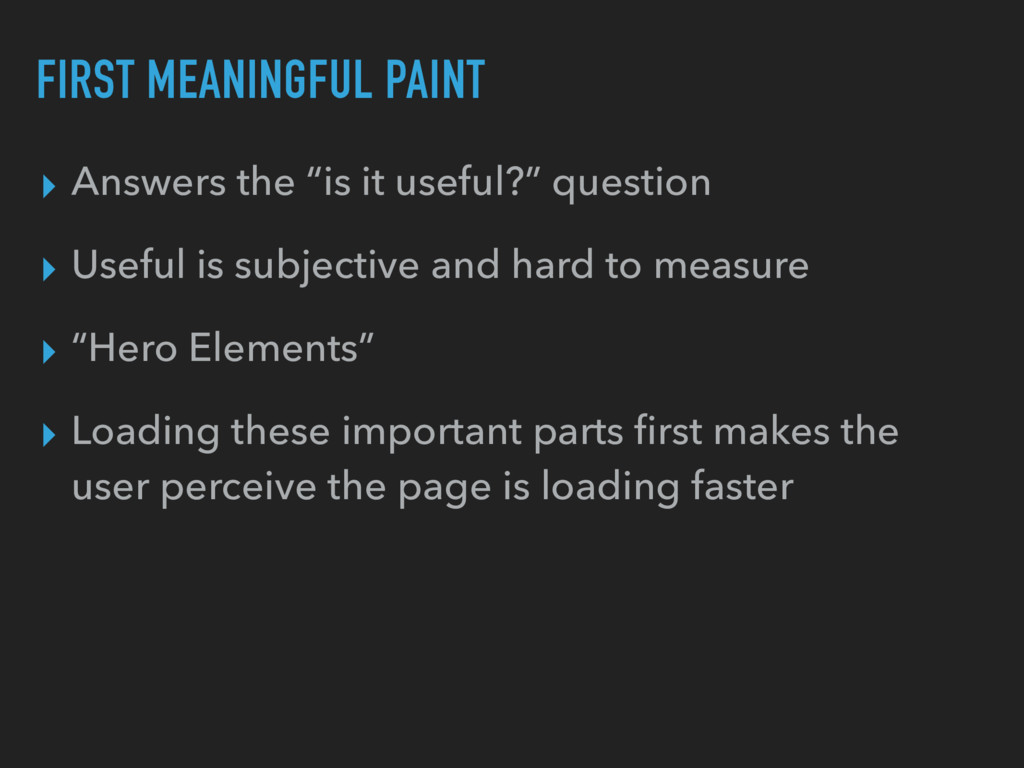
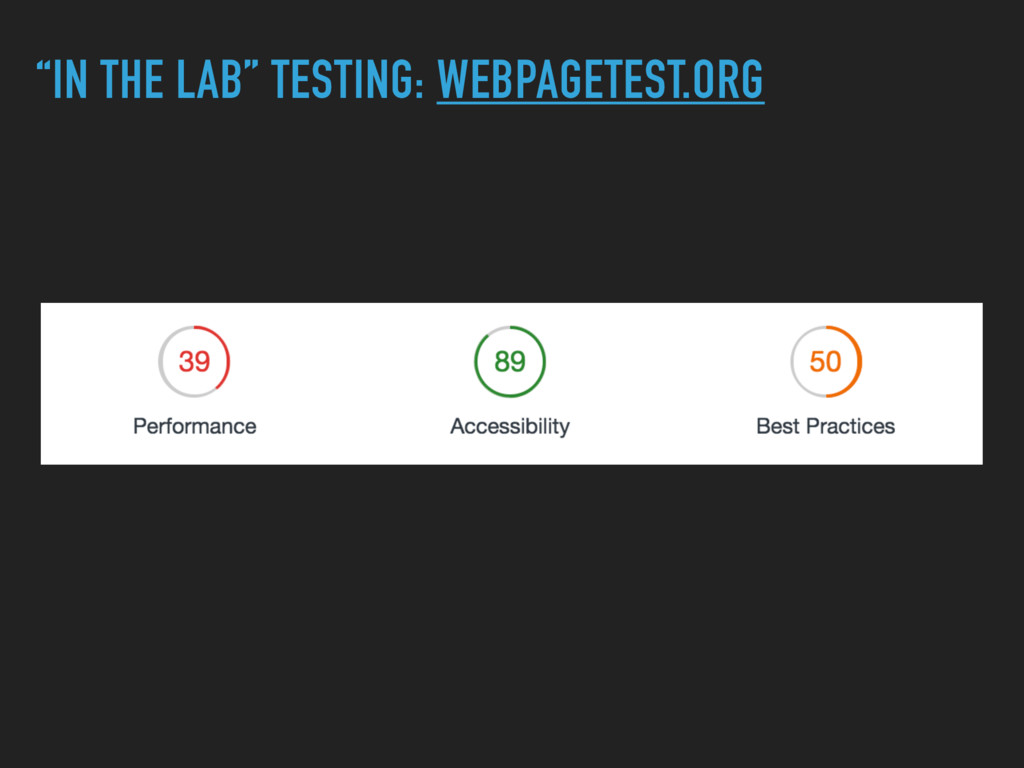
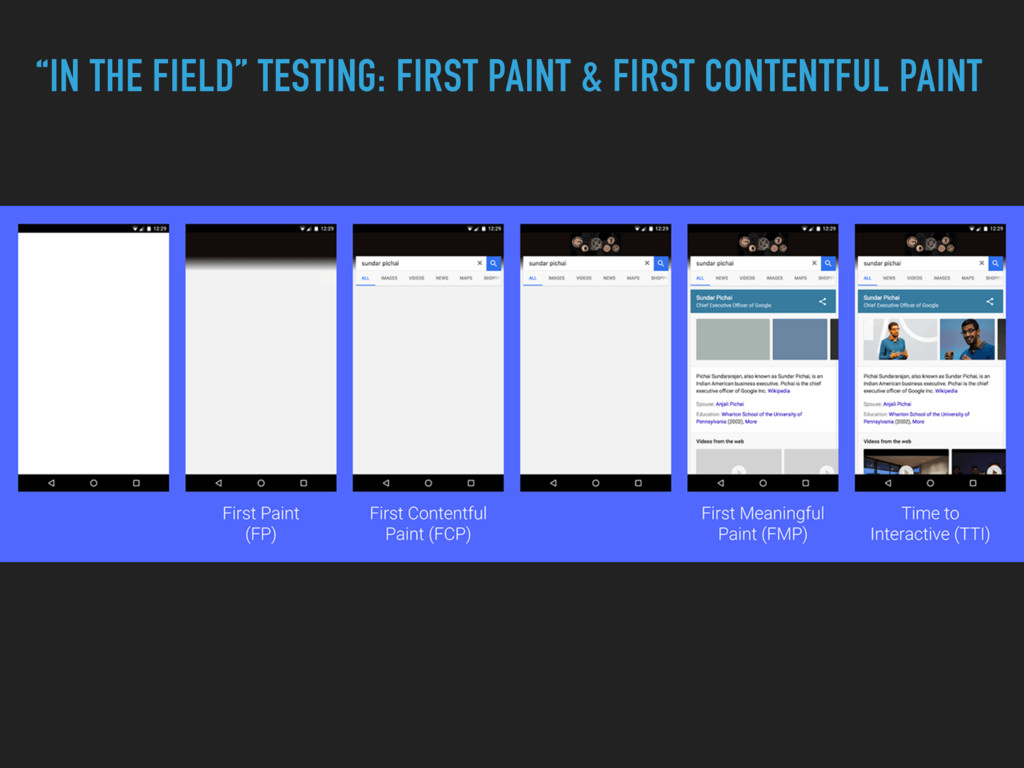
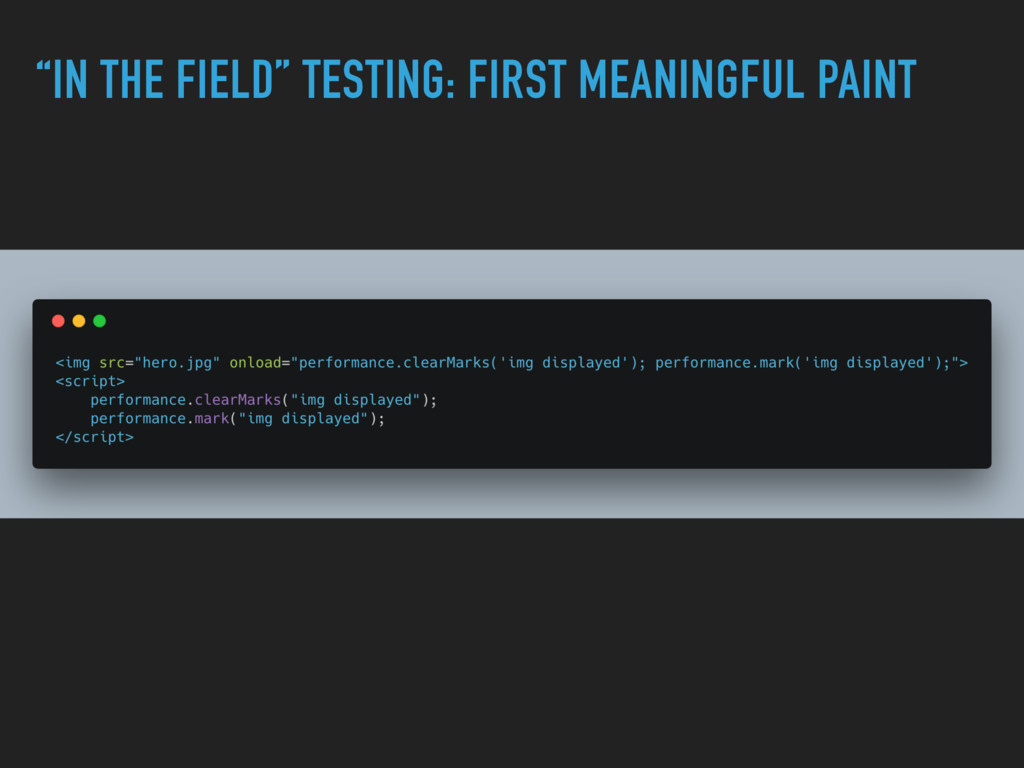
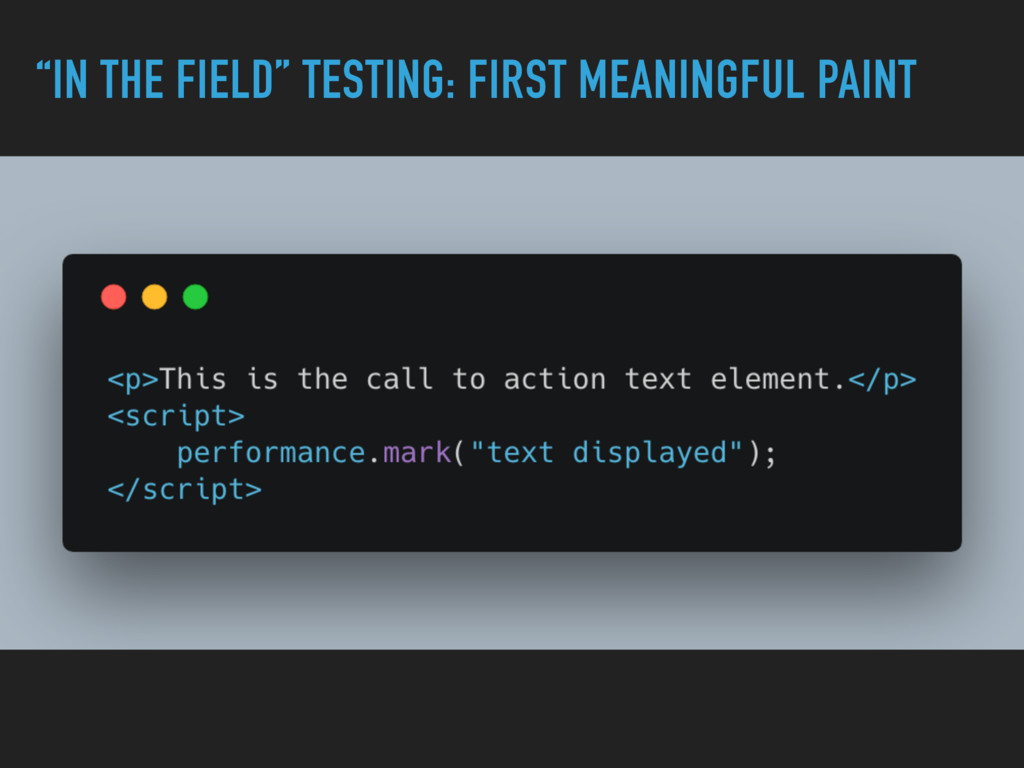
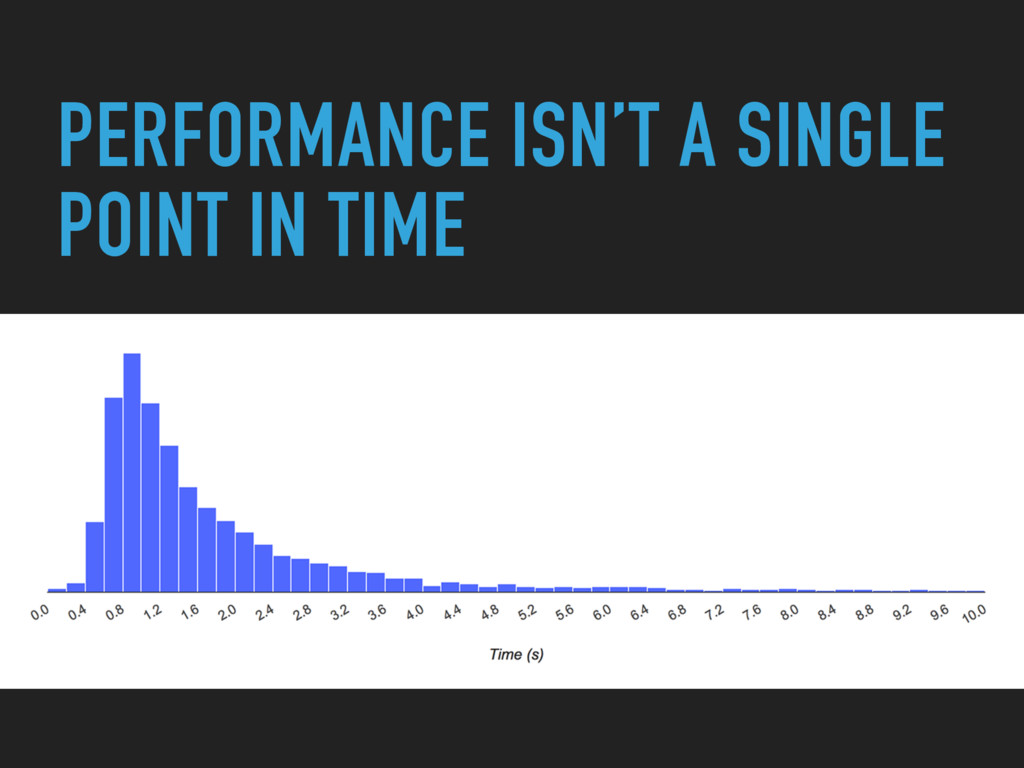
perceived the page to load ▸ Number of seconds when 90% of the above the fold content loaded ▸ Ability to track “in the lab” for the last few years ▸ Ability to track “in the field” somewhat available
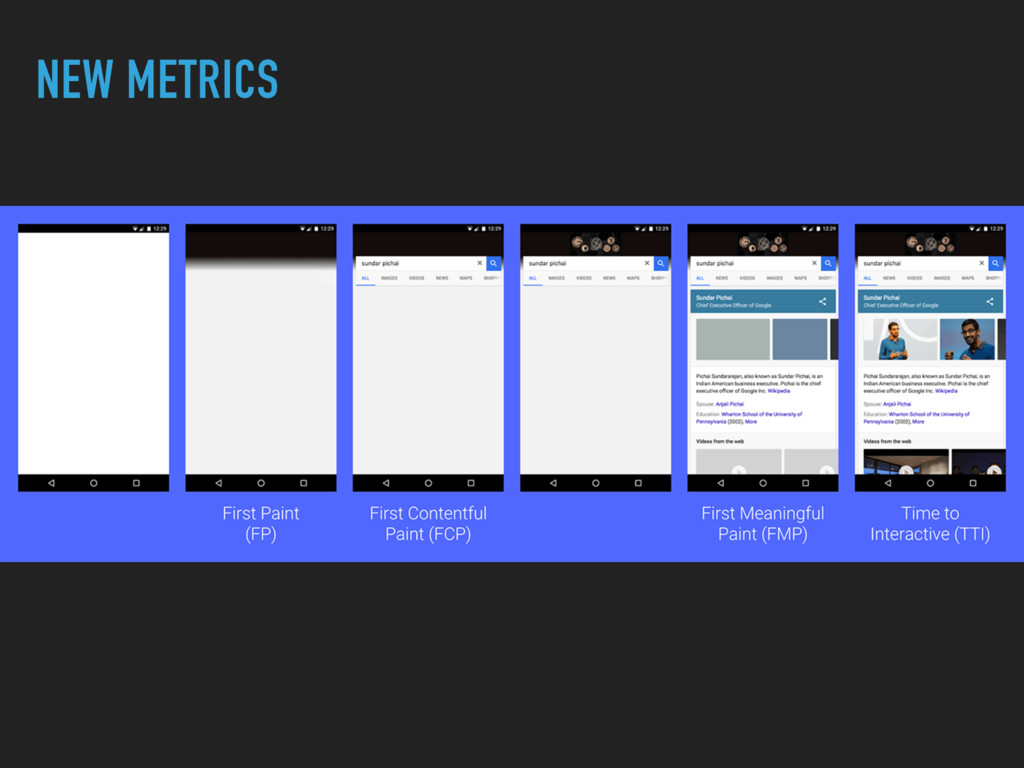
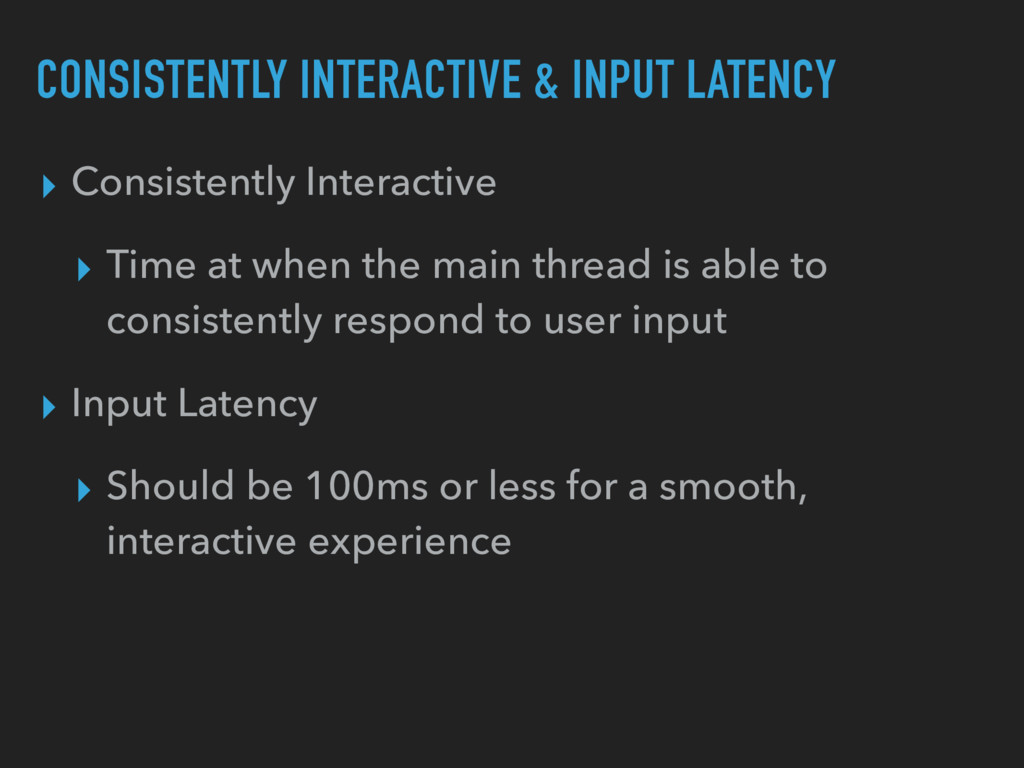
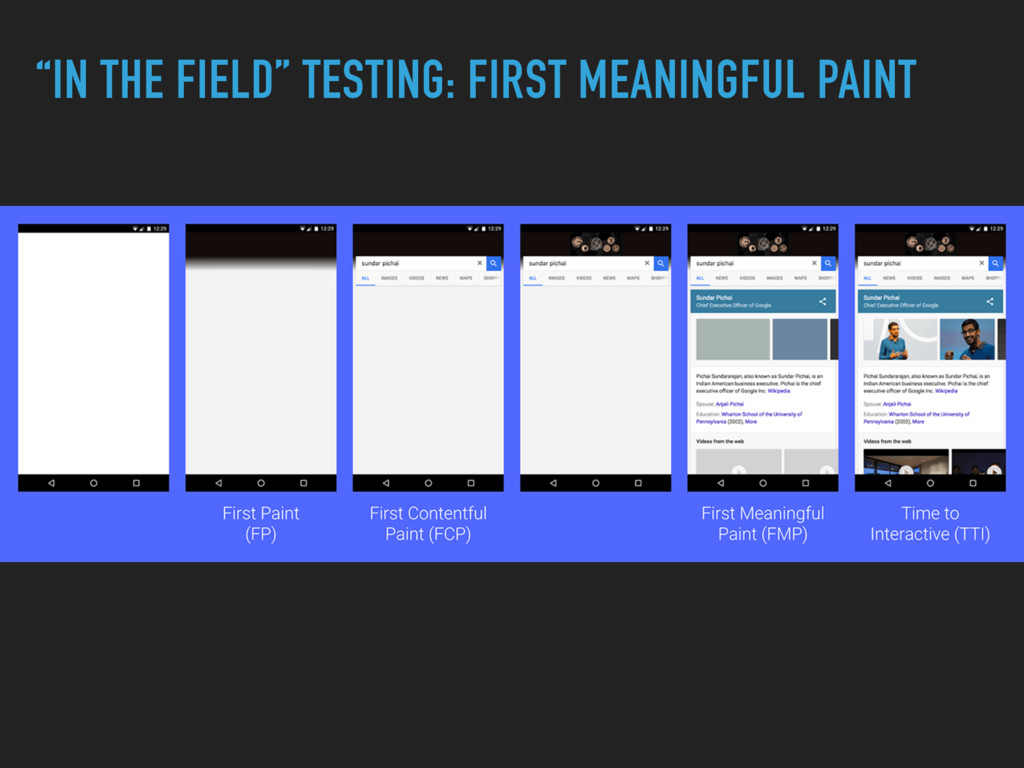
rendered and capable of reliably responding to user input ▸ Reasons for long FI: ▸ JavaScript needed to make components on the page work hasn’t loaded ▸ There are long tasks blocking the main thread
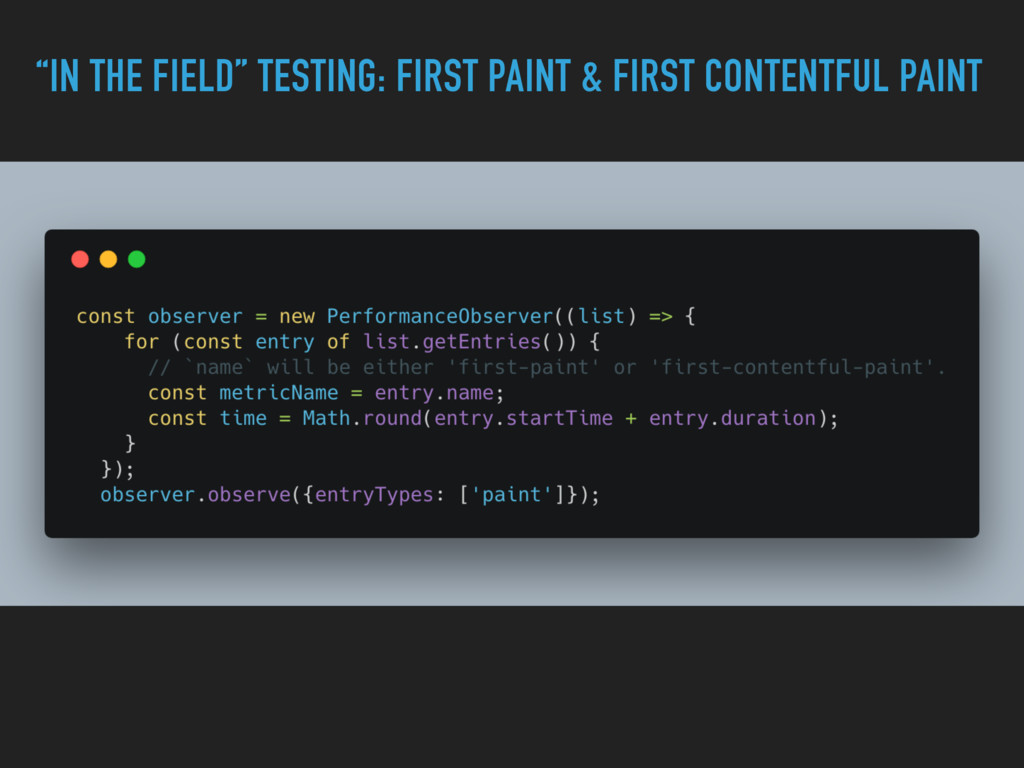
Allows you to measure performance and other important features/analytics ▸ Takes measurements from Javascript and other tools (such as ffmpeg for screen captures)