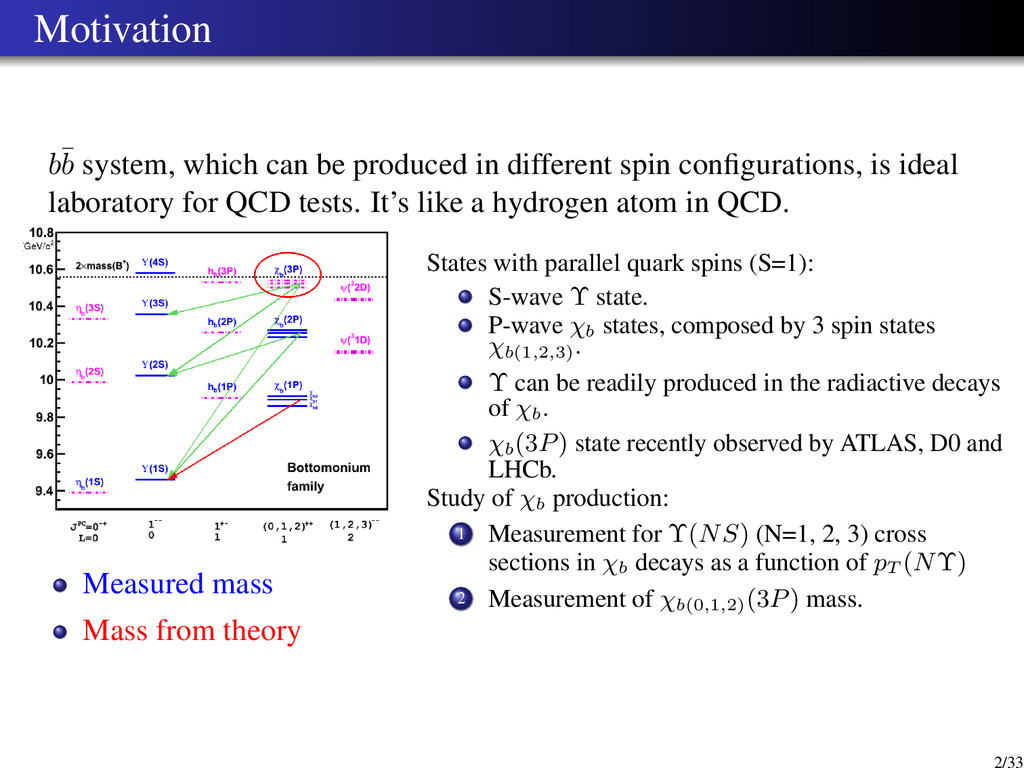
spin configurations, is ideal laboratory for QCD tests. It’s like a hydrogen atom in QCD. Measured mass Mass from theory States with parallel quark spins (S=1): S-wave Υ state. P-wave χb states, composed by 3 spin states χb(1,2,3) . Υ can be readily produced in the radiactive decays of χb. χb (3P) state recently observed by ATLAS, D0 and LHCb. Study of χb production: 1 Measurement for Υ(NS) (N=1, 2, 3) cross sections in χb decays as a function of pT (NΥ) 2 Measurement of χb(0,1,2) (3P) mass. 2/33
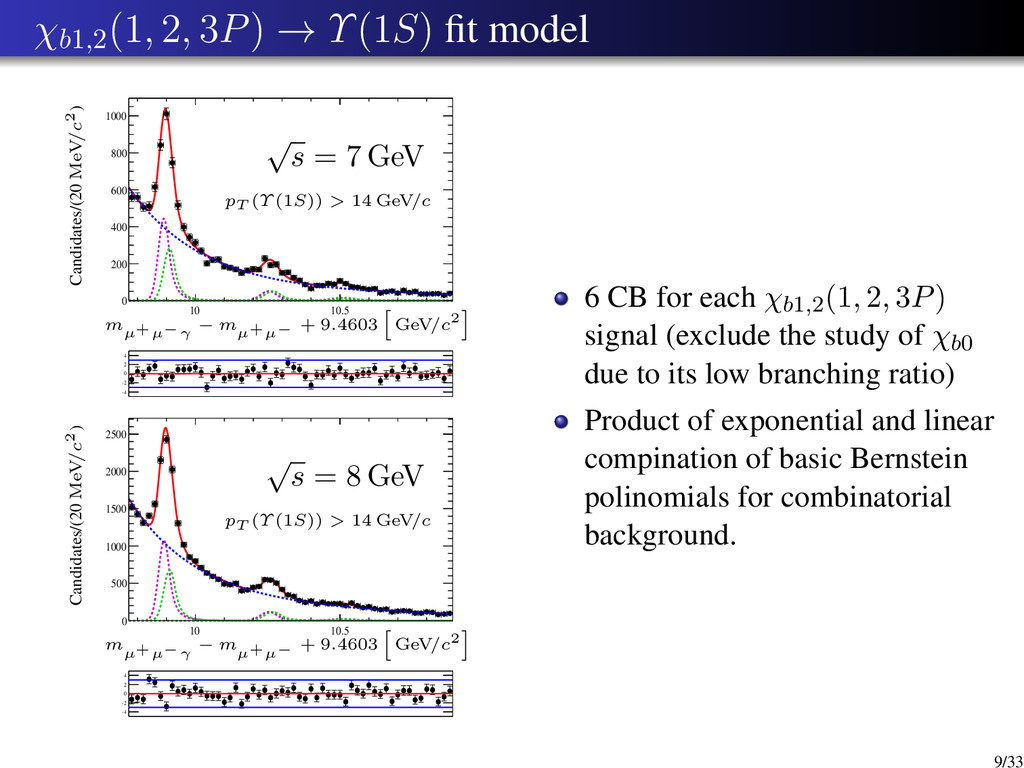
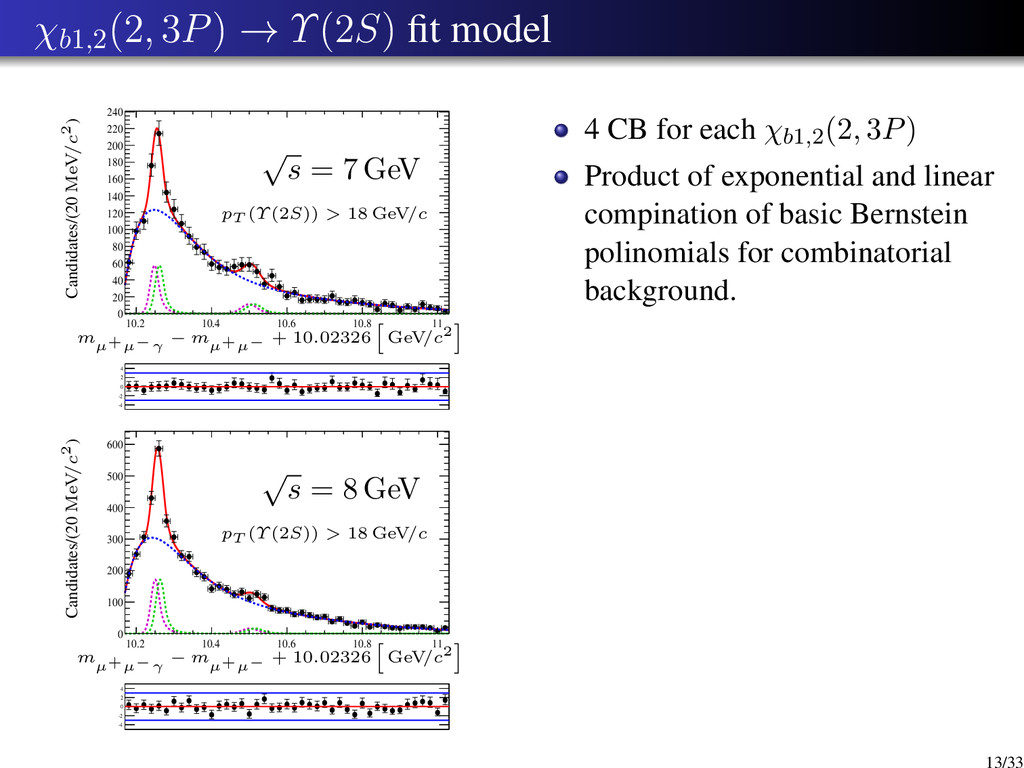
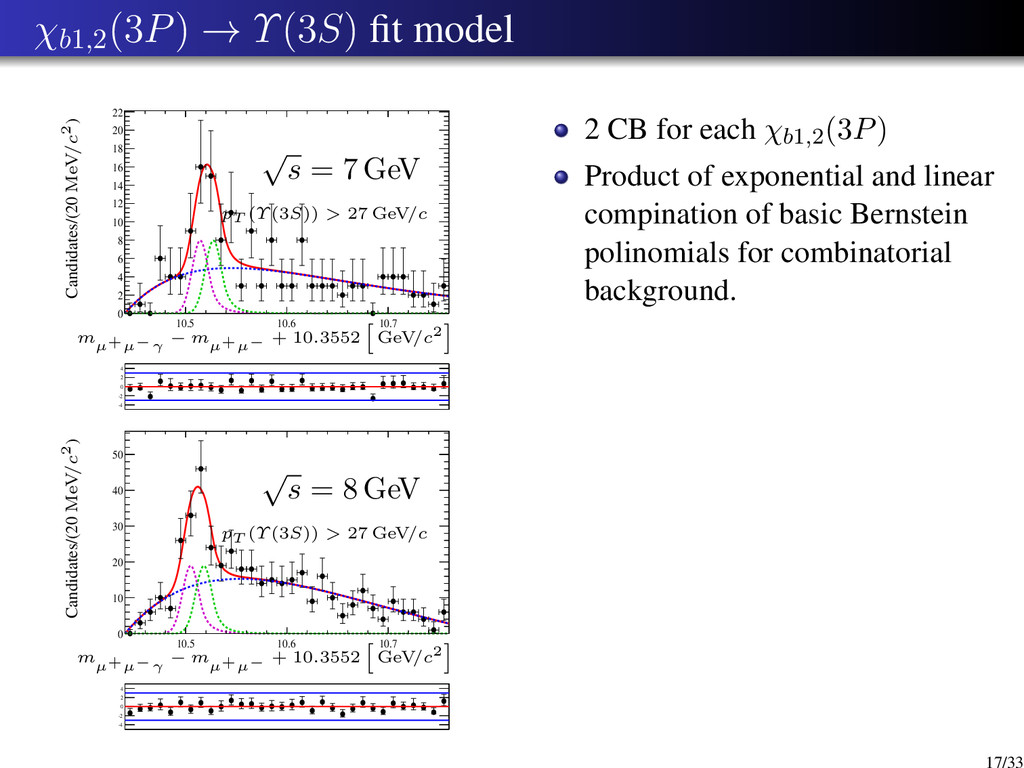
0 500 1000 1500 2000 2500 -4 -2 0 2 4 10 10.5 0 200 400 600 800 1000 -4 -2 0 2 4 Candidates/(20 MeV/c2) m µ+µ−γ − m µ+µ− + 9.4603 GeV/c2 √ s = 8 GeV pT (Υ (1S)) > 14 GeV/c Candidates/(20 MeV/c2) m µ+µ−γ − m µ+µ− + 9.4603 GeV/c2 √ s = 7 GeV pT (Υ (1S)) > 14 GeV/c 6 CB for each χb1,2(1, 2, 3P) signal (exclude the study of χb0 due to its low branching ratio) Product of exponential and linear compination of basic Bernstein polinomials for combinatorial background. 9/33
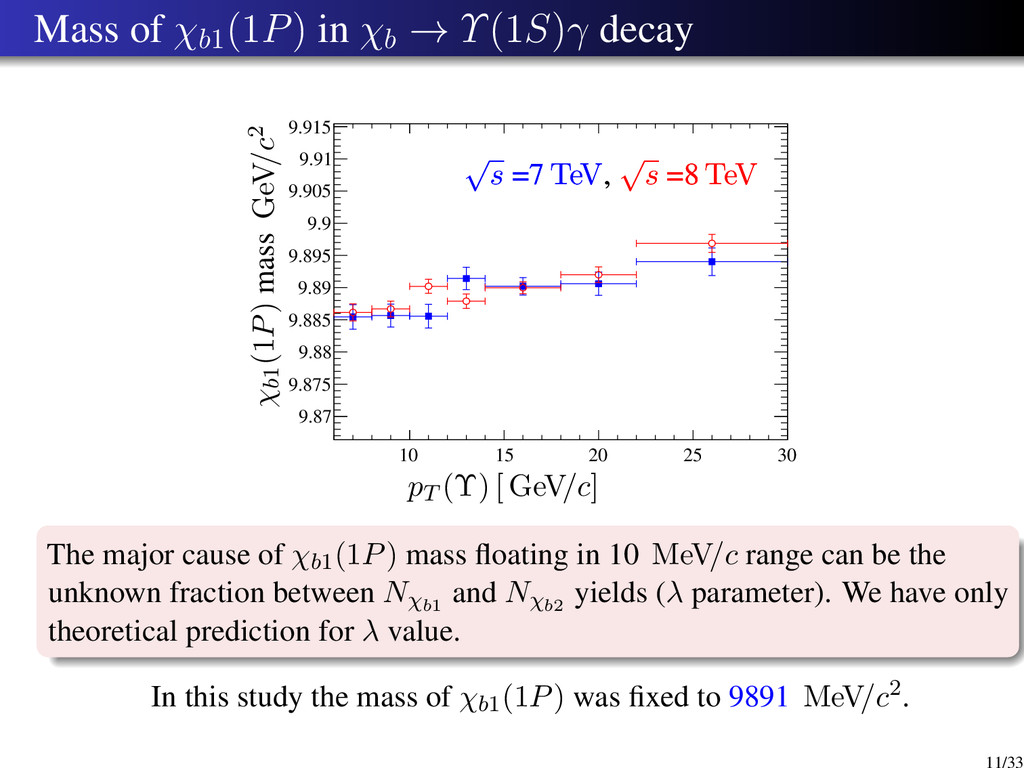
15 20 25 30 9.87 9.875 9.88 9.885 9.89 9.895 9.9 9.905 9.91 9.915 √ s =7 TeV, √ s =8 TeV √ s =7 TeV, √ s =8 TeV χb1(1P) mass GeV/c2 pT (Υ) [ GeV/c] The major cause of χb1(1P) mass floating in 10 MeV/c range can be the unknown fraction between Nχb1 and Nχb2 yields (λ parameter). We have only theoretical prediction for λ value. In this study the mass of χb1(1P) was fixed to 9891 MeV/c2. 11/33
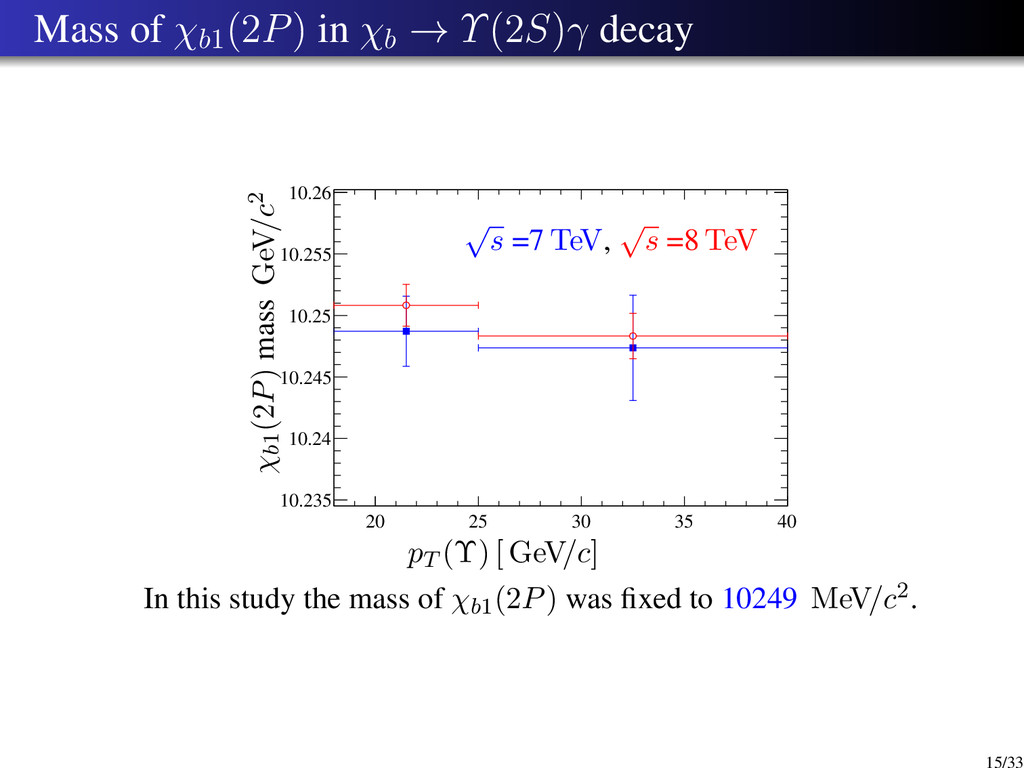
25 30 35 40 10.235 10.24 10.245 10.25 10.255 10.26 √ s =7 TeV, √ s =8 TeV χb1(2P) mass GeV/c2 pT (Υ) [ GeV/c] In this study the mass of χb1(2P) was fixed to 10249 MeV/c2. 15/33
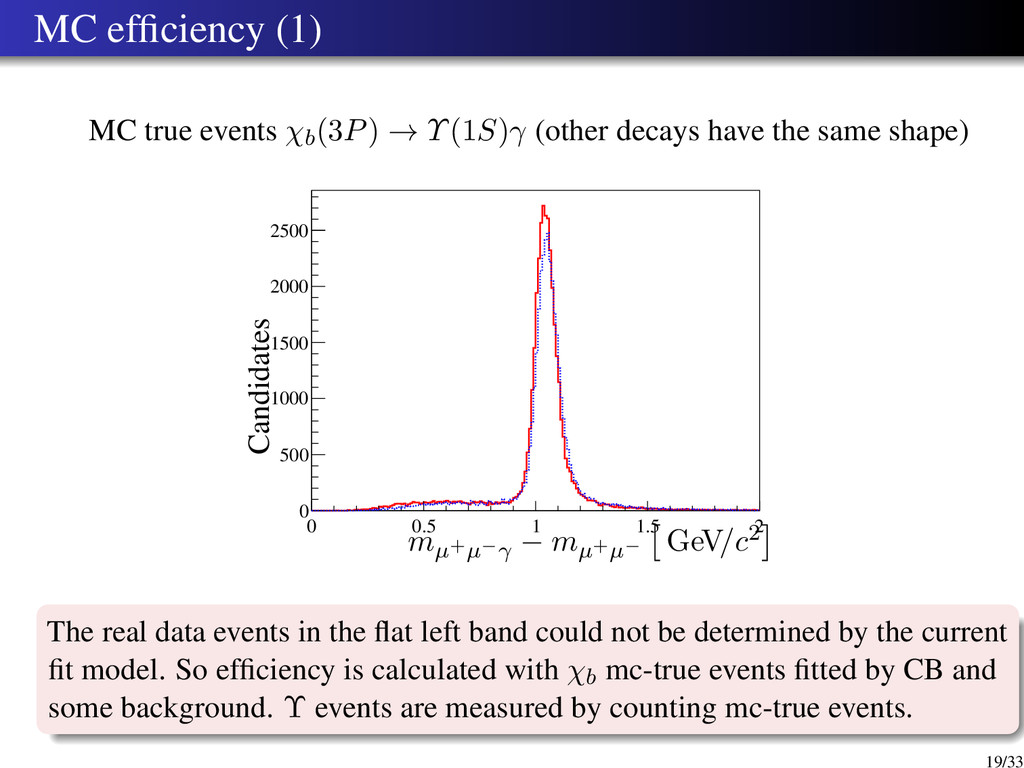
decays have the same shape) 0 0.5 1 1.5 2 0 500 1000 1500 2000 2500 Candidates mµ+µ−γ − mµ+µ− GeV/c2 The real data events in the flat left band could not be determined by the current fit model. So efficiency is calculated with χb mc-true events fitted by CB and some background. Υ events are measured by counting mc-true events. 19/33
decays Measured mass of χb(3P) TODO Analysis note almost ready (next week will be ready for review). Measure systematic uncertainties due to Υ polarization. Measure systematic due to fit model (almost done). Analysis note draft: https://twiki.cern.ch/twiki/bin/viewauth/LHCbPhysics/ChiB2fb (not ready for review yet) 24/33
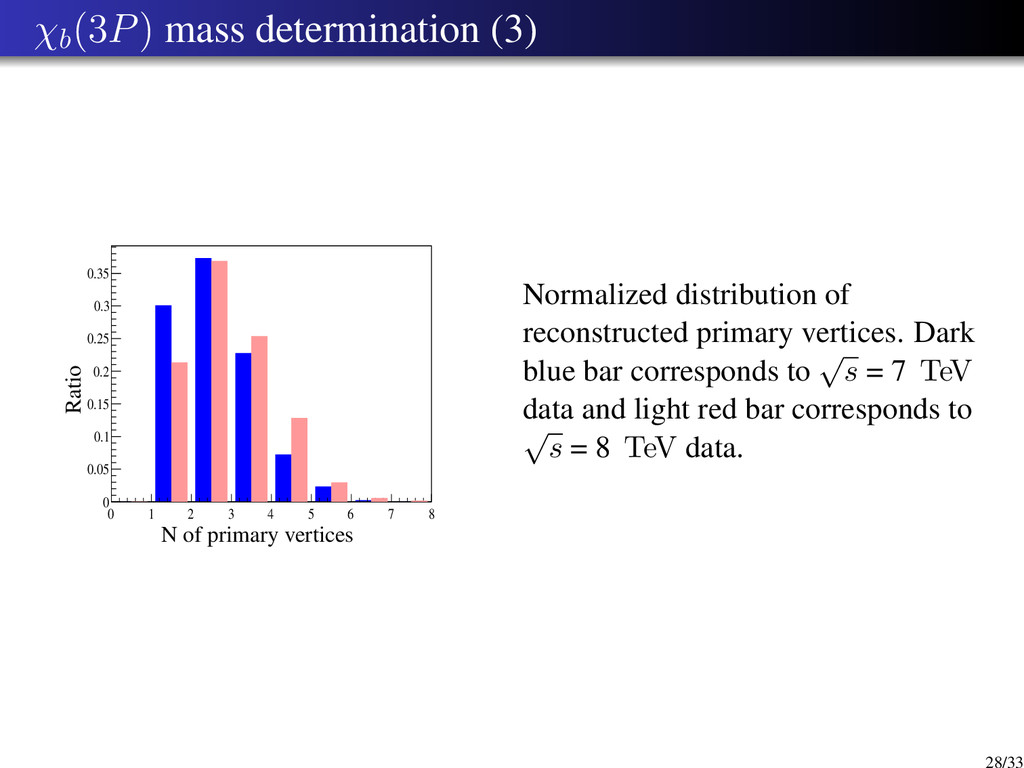
5 6 7 8 0 0.05 0.1 0.15 0.2 0.25 0.3 0.35 Ratio N of primary vertices Normalized distribution of reconstructed primary vertices. Dark blue bar corresponds to √ s = 7 TeV data and light red bar corresponds to √ s = 8 TeV data. 28/33