Upgrade to Pro — share decks privately, control downloads, hide ads and more …

Why we recommend PMM to our clients

Why we recommend PMM to our clients

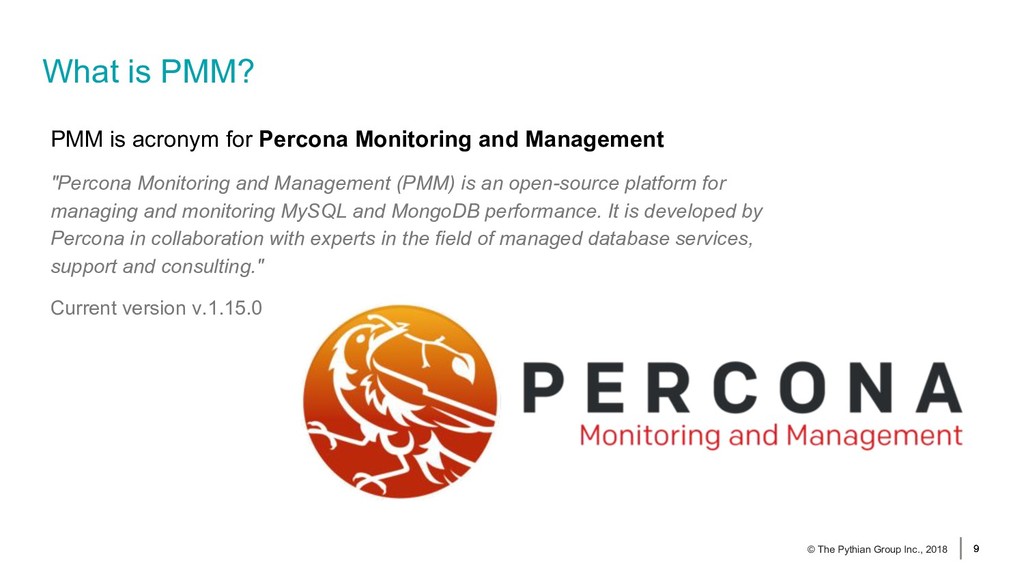
As service providers, one of our responsibilities is helping clients understand what causes contributed to a production downtime incident, and how to avoid (as much as possible) them from happening again. We do this with Incident Reports, and one common recommendation we make is to have a historical monitoring system in place. All our clients have point-in-time monitoring solutions in place, solutions that can alert them when a system is down or behaving in unacceptable ways. But historical monitoring is still not common, and we believe a lot of companies can benefit from deploying one of them. In most cases, we have recommended Percona Monitoring and Management (PMM), as a good and Open Source solution for this problem. In this session, we will talk about the reasons why we recommend PMM as a way to prevent incidents, and also to investigate their possible causes when one has happened.

Matthias Crauwels

November 06, 2018
Tweet

More Decks by Matthias Crauwels

Other Decks in Technology

Transcript

  1. 2 © The Pythian Group Inc., 2018 November 6, 2018

    Open Source Monitoring Conference Nuremberg, Germany Why we recommend PMM to our clients Matthias Crauwels
  2. © The Pythian Group Inc., 2018 4 4 © The

    Pythian Group Inc., 2017 Matthias Crauwels • Living in Ghent, Belgium • Bachelor Computer Science • ~20 years Linux user / admin • 10+ years PHP developer • 5+ years MySQL DBA • 1+ year at Pythian as MySQL Database Consultant • Recently promoted to Lead Database Consultant • Father of Leander
  3. © The Pythian Group Inc., 2018 5 © The Pythian

    Group Inc., 2018 5 PYTHIAN Pythian excels at helping businesses around the world use data and the cloud to transform how they compete and win in the data economy. From cloud automation to machine learning, Pythian leads the industry with proven innovative technologies and deep data expertise. For more than 20 years Pythian has built its reputation by delivering solutions to the toughest data challenges faster and better than anyone else.
  4. 6 © 2018 Pythian. Confidential AI / ML / BLOCKCHAIN

    Intelligent analytics and decision making Software autonomy Disruptive data technologies CLOUD MIGRATION & OPERATIONS Plan, Migrate, Manage, Optimize, Innovate Multi-cloud, Hybrid-Cloud, Cloud Native ANALYTIC DATA SYSTEMS Kick AaaS cloud-native, pre-packaged analytics platform Custom analytics platform design, implementation and support services–for on-premises and cloud Data science consulting and implementation services OPERATIONAL DATA SYSTEMS Database services–architecture to ongoing management On prem and in the cloud Oracle, MS SQL, MySQL, Cassandra, MongoDB, Hadoop, AWS/Azure/Google DBaaS
  5. 7 © The Pythian Group Inc., 2018 AGENDA 7 •

    Introduction • What is PMM? • Components & Architecture • Installing & Tuning PMM • Why PMM?
  6. 9 © The Pythian Group Inc., 2018 © The Pythian

    Group Inc., 2018 9 PMM is acronym for Percona Monitoring and Management "Percona Monitoring and Management (PMM) is an open-source platform for managing and monitoring MySQL and MongoDB performance. It is developed by Percona in collaboration with experts in the field of managed database services, support and consulting." Current version v.1.15.0 What is PMM?
  7. 10 © The Pythian Group Inc., 2018 © The Pythian

    Group Inc., 2018 10 • Prometheus (v2 as of PMM v1.13.0) Primary data store for time series data • Grafana (v5.1 as of PMM v1.12.0) Visualisation, primary web interface • QAN (Query Analytics) Collect query metrics to analyse query performance over time • Consul Service discovery • Orchestrator Topology management and visualization (not enabled by default since 1.3.0) Components and Architecture (server side)
  8. 11 © The Pythian Group Inc., 2018 © The Pythian

    Group Inc., 2018 11 • Pull based (PMM server pulls from the PMM client) • node_exporter Linux system metrics • mysqld_exporter MySQL and InnoDB metrics • mongodb_exporter MongoDB metrics • proxysql_exporter ProxySQL metrics • Push based (PMM client pushes to the PMM server) • pmm-mysql-queries Pushes MySQL query statistics to QAN • pmm-mongo-queries Pushes MongoDB query statistics to QAN Components and Architecture (client side)
  9. 13 © The Pythian Group Inc., 2018 © The Pythian

    Group Inc., 2018 13 pmm-admin tool for managing the PMM client installation Tool written in Go to configure the connection between PMM client and the PMM server. This is the tool that will update the consul service discovery data. Note: Even with the consul web-endpoint (/consul/) available on the server it is not recommended to make changes to that interface without using the pmm-admin tool. Components and Architecture (client side)
  10. 14 © The Pythian Group Inc., 2018 © The Pythian

    Group Inc., 2018 14 # pmm-admin list ... PMM Server | 192.168.100.1 Client Name | ubuntu-amd64 Client Address | 192.168.200.1 Service manager | linux-systemd ---------------- ----------- ----------- -------- ---------------- -------- SERVICE TYPE NAME LOCAL PORT RUNNING DATA SOURCE OPTIONS ---------------- ----------- ----------- -------- ---------------- -------- linux:metrics mongo-main 42000 YES - mongodb:metrics mongo-main 42003 YES localhost:27017 pmm-admin samples
  11. 15 © The Pythian Group Inc., 2018 © The Pythian

    Group Inc., 2018 15 # pmm-admin check-network PMM Network Status Server Address | 192.168.100.1 Client Address | 192.168.200.1 * System Time NTP Server (0.pool.ntp.org) | 2017-05-03 12:05:38 -0400 EDT PMM Server | 2017-05-03 16:05:38 +0000 GMT PMM Client | 2017-05-03 12:05:38 -0400 EDT PMM Server Time Drift | OK PMM Client Time Drift | OK PMM Client to PMM Server Time Drift | OK ... pmm-admin samples
  12. 16 © The Pythian Group Inc., 2018 © The Pythian

    Group Inc., 2018 16 # pmm-admin check-network PMM Network Status Server Address | 192.168.100.1 Client Address | 192.168.200.1 ... * Connection: Client --> Server -------------------- ------------- SERVER SERVICE STATUS -------------------- ------------- Consul API OK Prometheus API OK Query Analytics API OK Connection duration | 166.689µs Request duration | 364.527µs Full round trip | 531.216µs ... pmm-admin samples
  13. 17 © The Pythian Group Inc., 2018 © The Pythian

    Group Inc., 2018 17 # pmm-admin check-network PMM Network Status Server Address | 192.168.100.1 Client Address | 192.168.200.1 ... * Connection: Client <-- Server ---------------- ----------- -------------------- -------- ---------- --------- SERVICE TYPE NAME REMOTE ENDPOINT STATUS HTTPS/TLS PASSWORD ---------------- ----------- -------------------- -------- ---------- --------- linux:metrics mongo-main 192.168.200.1:42000 OK YES - mongodb:metrics mongo-main 192.168.200.1:42003 PROBLEM YES - pmm-admin samples
  14. 18 © The Pythian Group Inc., 2018 © The Pythian

    Group Inc., 2018 18 3 distribution methods are available • Docker image • OVA package (virtual appliance) • AWS marketplace Most popular in my experience is the Docker approach. Installing PMM server (1)
  15. 19 © The Pythian Group Inc., 2018 © The Pythian

    Group Inc., 2018 19 Recommended to have 4 data volumes • Prometheus: /opt/prometheus/data • Consul: /opt/consul-data • MySQL: /var/lib/mysql • Grafana: /var/lib/grafana At first run PMM will initialize the data directories. It will also set the privileges right at this time. You'll need to run without the volume mappings at this time, then stop the container/appliance and move the data to the appropriate volumes. Installing PMM server (2)
  16. 20 © The Pythian Group Inc., 2018 © The Pythian

    Group Inc., 2018 20 By default, a docker container could access as much memory as the host’s kernel scheduler allows. In an environment where the host is shared with other containers or processes, you may want to limit the amount of memory PMM container can allocate. To do so in a standalone docker environment: $ sudo docker run --memory=4G .. Also by default, prometheus will allocate all memory available to the container for storing the most recently used data chunks. If the memory available to the container is limited, restrict prometheus memory usage for data chunks so it leaves enough memory for MySQL, consul and grafana. In the example below we are setting a limit of 2Gb. $ sudo docker run -e METRICS_MEMORY=2097152 .. Tuning PMM server (1)
  17. 21 © The Pythian Group Inc., 2018 © The Pythian

    Group Inc., 2018 21 By default, prometheus stores time-series data for 30 days, and QAN stores query data for 8 days. To change this defaults use the following variables (in hours): $ sudo docker run -e METRICS_RETENTION=4400h -e QUERIES_RETENTION=4400h .. Of course, total space usage depends on the amount of monitored hosts, the retention period and even the metrics resolution. The default sample rate is 1 second. You could consider increasing METRICS_RESOLUTION (in seconds) to reduce the storage footprint: $ sudo docker run -e METRICS_RESOLUTION=5s Tuning PMM server (2)
  18. 24 © The Pythian Group Inc., 2018 © The Pythian

    Group Inc., 2018 24 Historical Monitoring
  19. 25 © The Pythian Group Inc., 2018 © The Pythian

    Group Inc., 2018 25 There are a number of commercial tools available that can offer similar kind of monitoring solution. Usually Software-as-a-Service (SaaS) solutions. • Expensive (mostly pay per server solutions) • Data shipped off-site • Dependent on your internet uplink from your backend servers • Not so customizable • ... Open Source
  20. 26 © The Pythian Group Inc., 2018 26 Security •

    Inside our network • SSL communication • Docker / Appliance • HTTPs Authentication • Custom setup
  21. 27 © The Pythian Group Inc., 2018 © The Pythian

    Group Inc., 2018 27 • Multiple options for installation • PMM Client packages availability • Open Source • Custom dashboards • Possibility to monitor other services too Flexibility
  22. 29 © The Pythian Group Inc., 2018 © The Pythian

    Group Inc., 2018 29 Since Grafana v4.0 there is the option configure alerting in Grafana. Grafana is a core component for PMM PMM has all the metrics let's configure thresholds and push out alerts Alerting