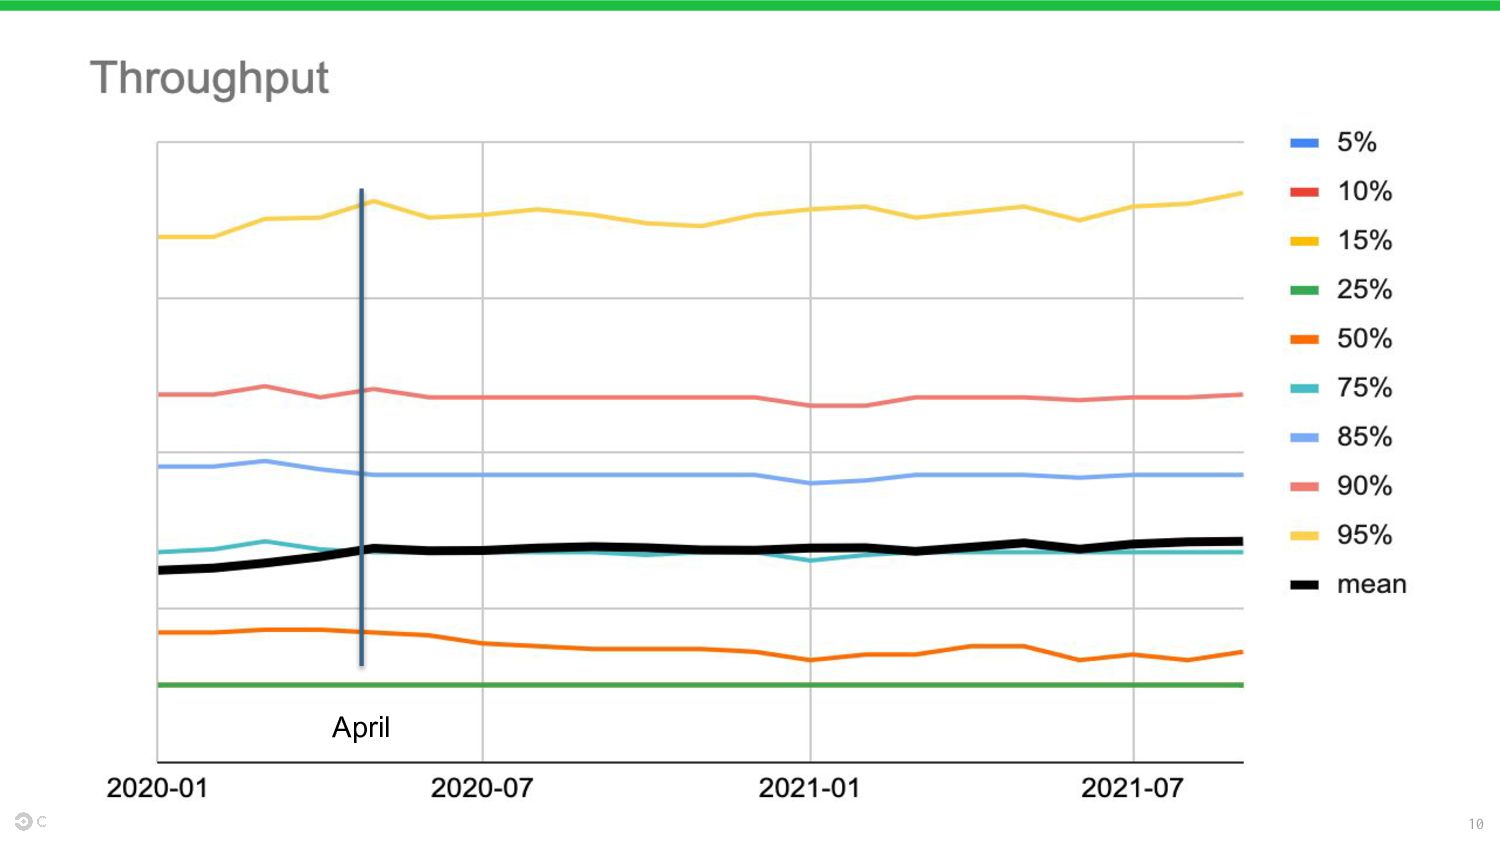
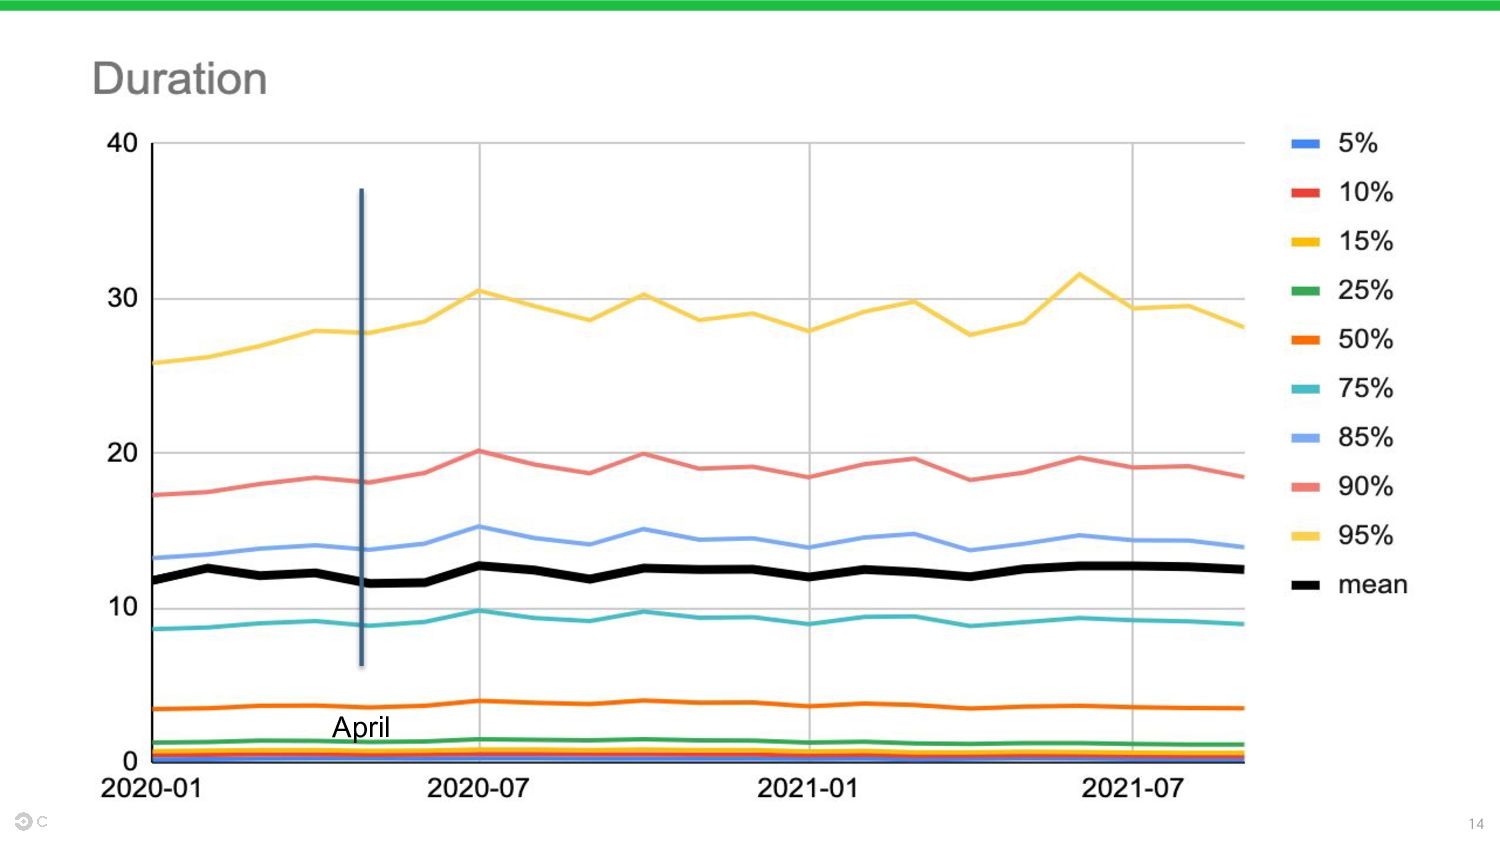
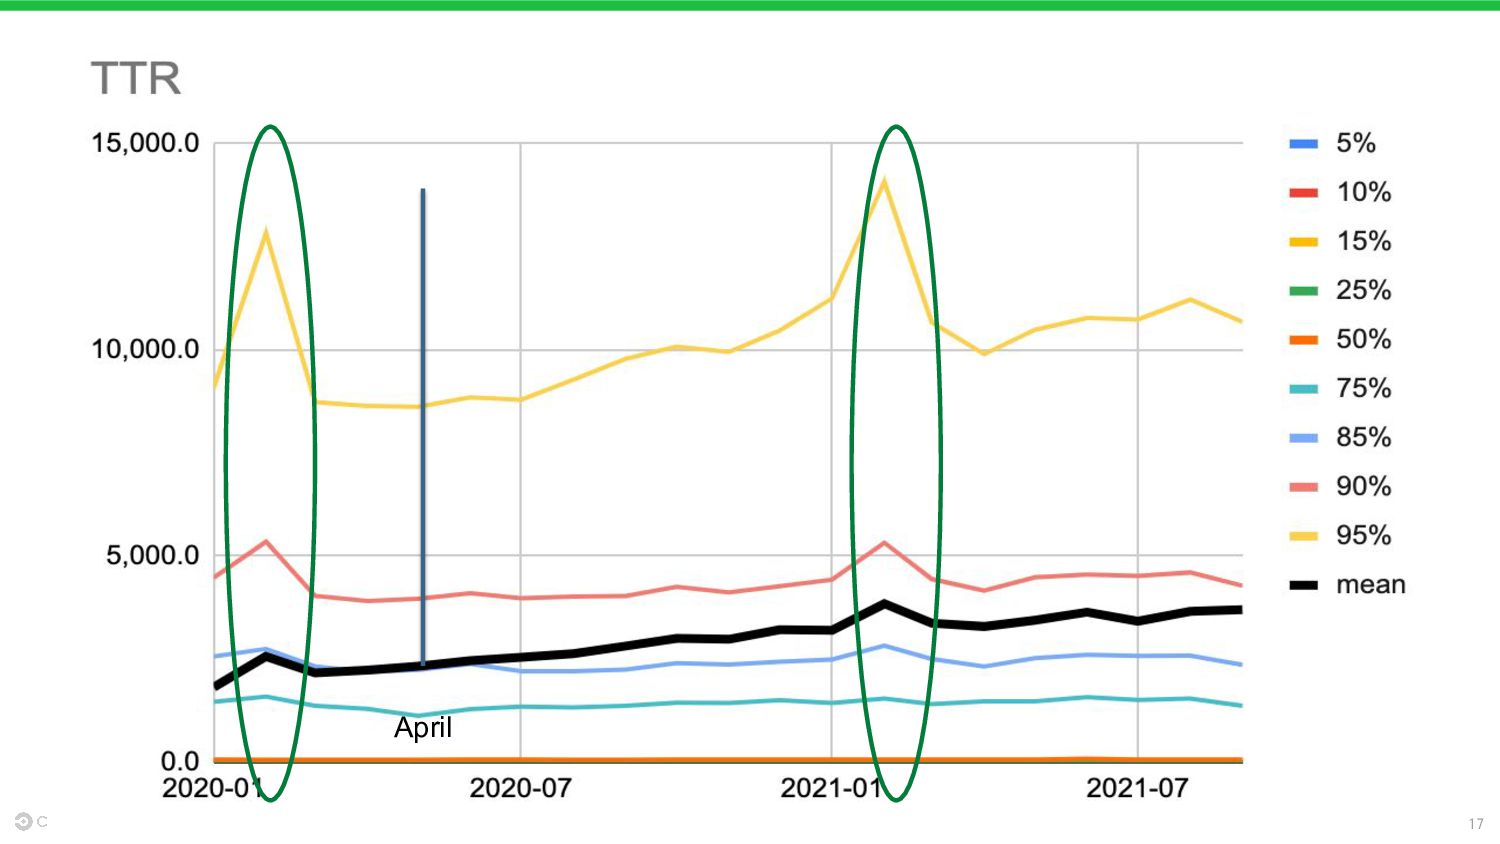
number of workflow runs per day Merge on any pull request 1.39 (- 2.8%) Duration The average length of time for a workflow to run 10 minutes (Not under 10 minutes) 3.82 minutes (+ 3.2%) Mean time to recovery The average time between failures & their next success Under 1 hour 644 minutes (+ 802%) Success rate The number of successful runs / the total number of runs over a period of time 90% or better on default (master, main) branch 65% (- 15.6%) CI/CD Performance for High Performance Teams
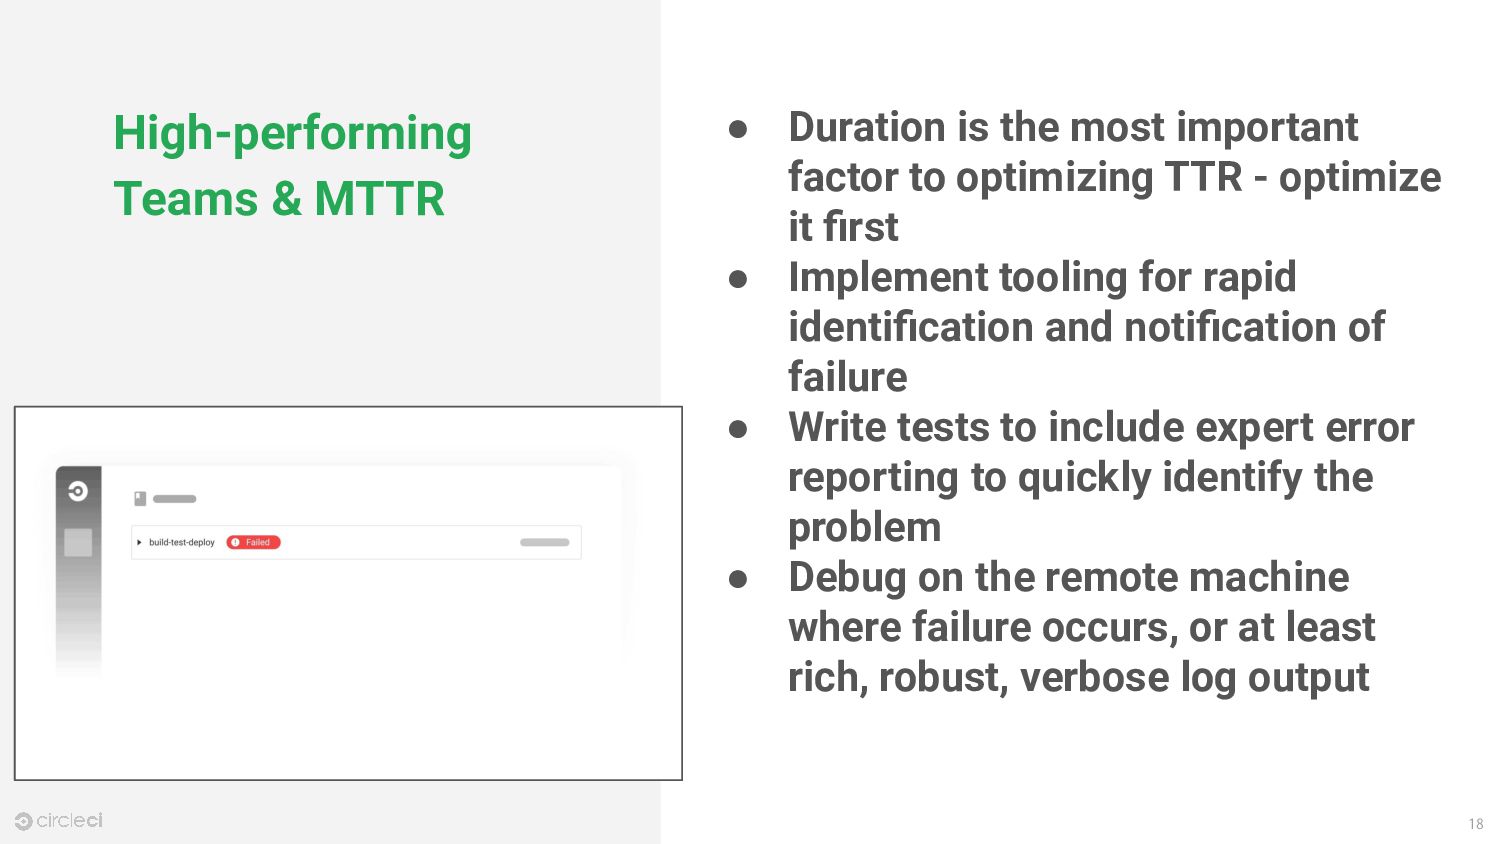
important factor to optimizing TTR - optimize it first • Implement tooling for rapid identification and notification of failure • Write tests to include expert error reporting to quickly identify the problem • Debug on the remote machine where failure occurs, or at least rich, robust, verbose log output
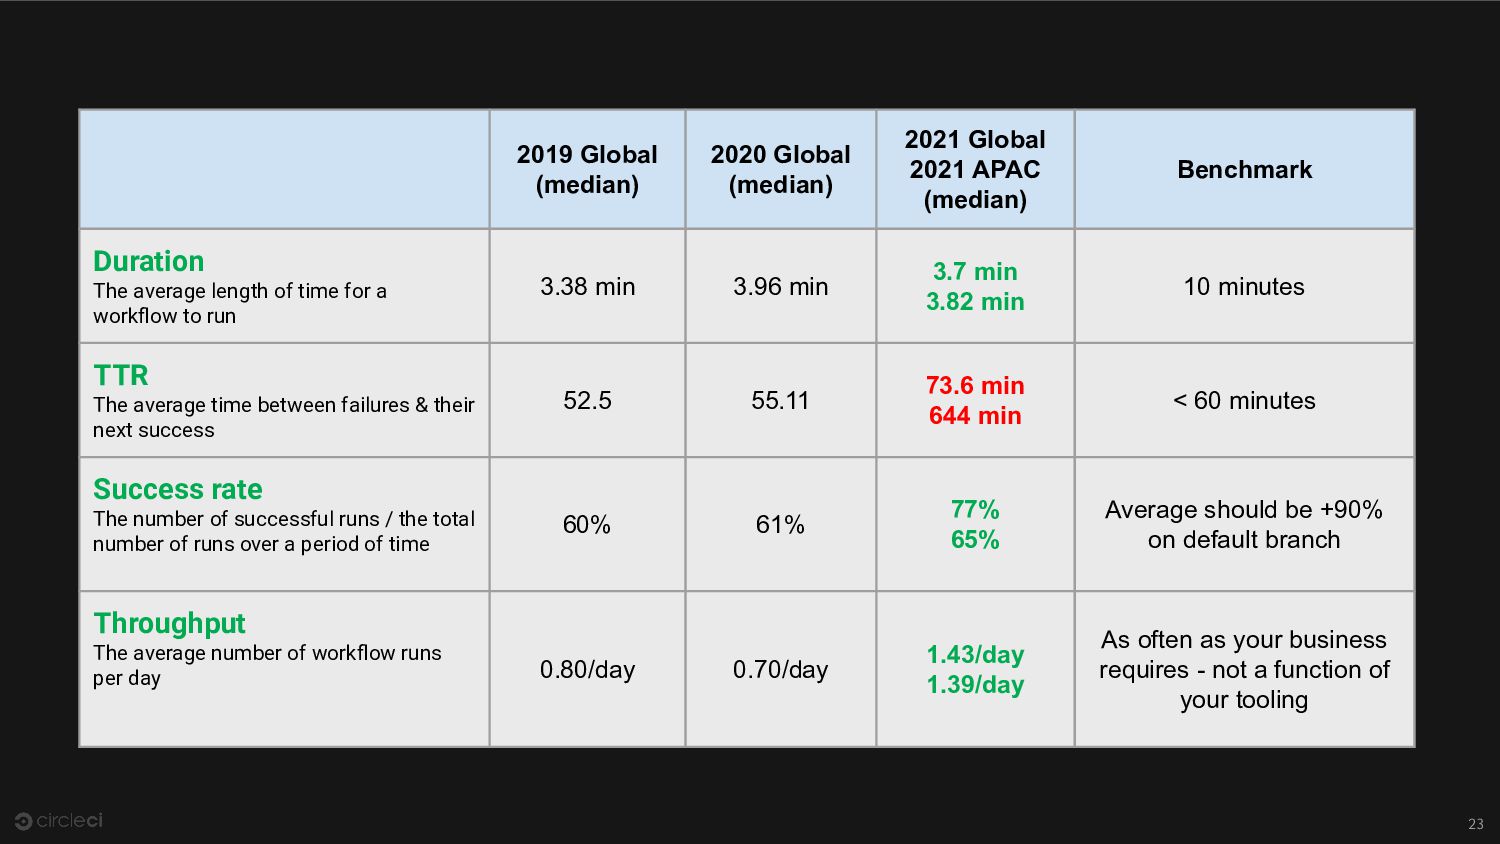
APAC (median) Benchmark Duration The average length of time for a workflow to run 3.38 min 3.96 min 3.7 min 3.82 min 10 minutes TTR The average time between failures & their next success 52.5 55.11 73.6 min 644 min < 60 minutes Success rate The number of successful runs / the total number of runs over a period of time 60% 61% 77% 65% Average should be +90% on default branch Throughput The average number of workflow runs per day 0.80/day 0.70/day 1.43/day 1.39/day As often as your business requires - not a function of your tooling