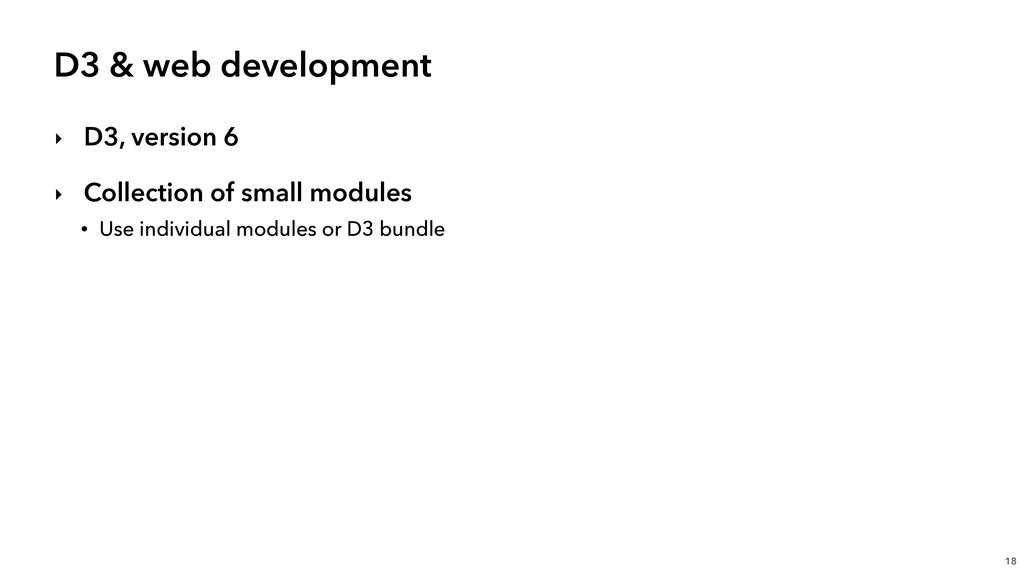
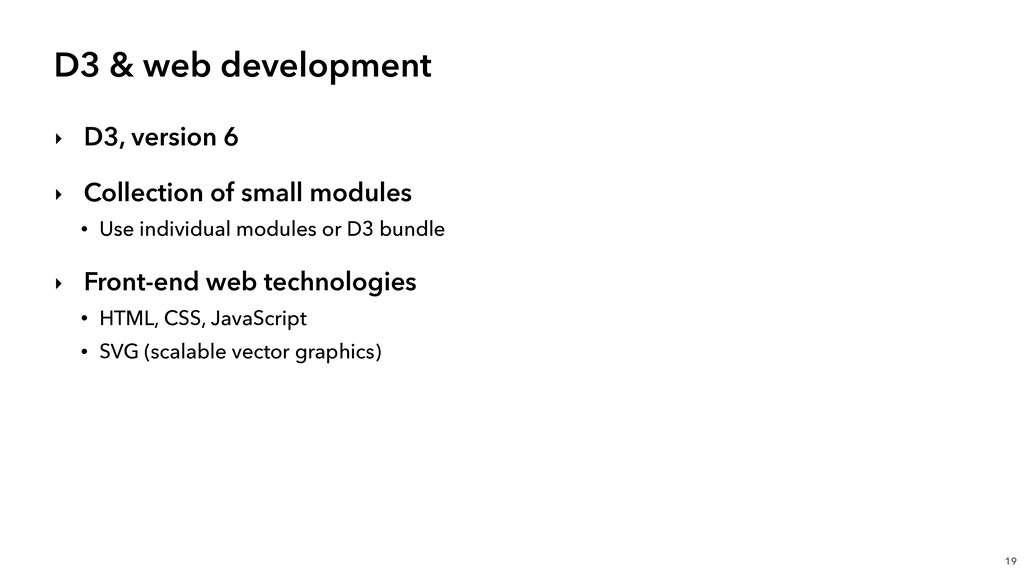
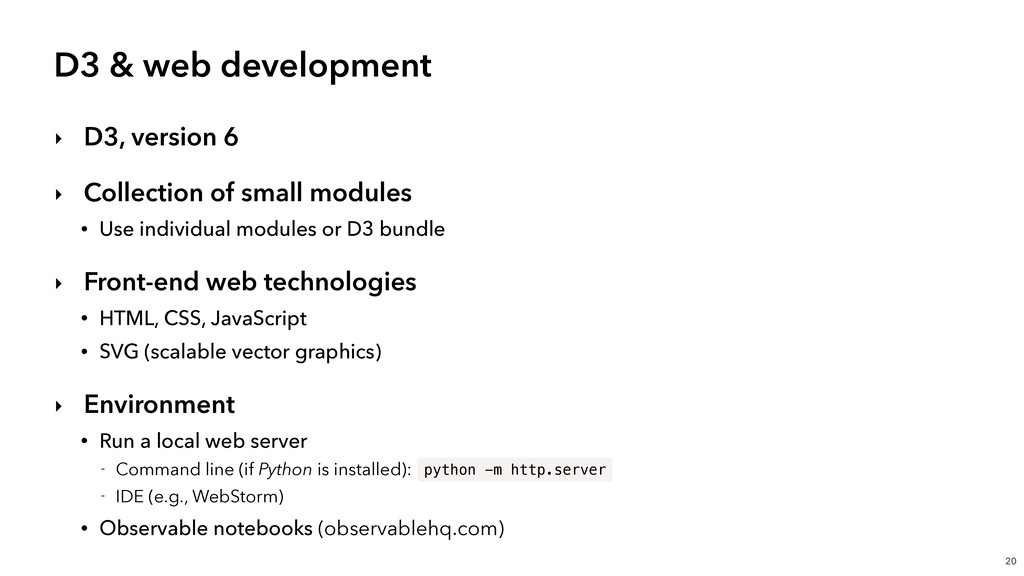
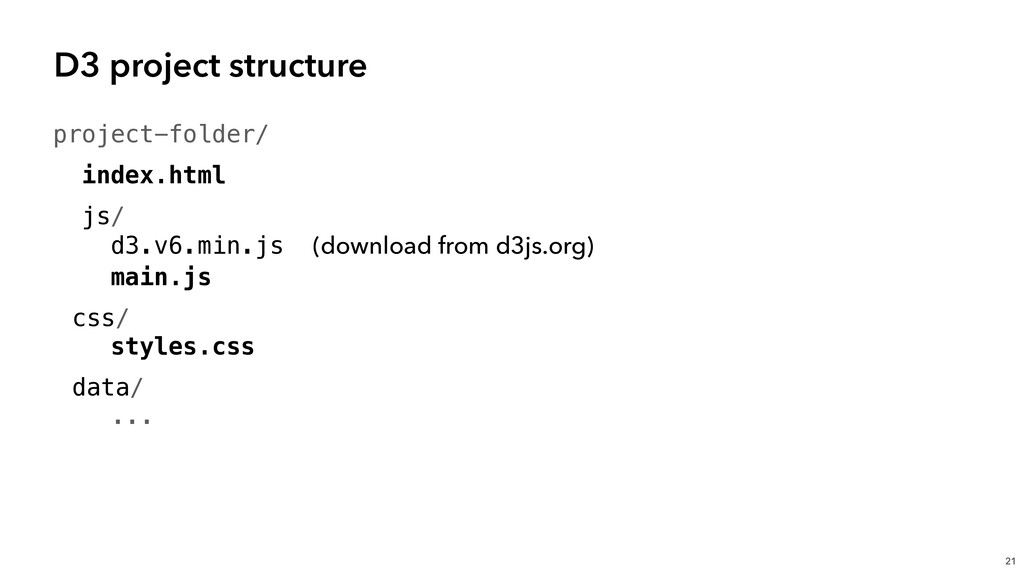
of small modules • Use individual modules or D3 bundle ‣ Front-end web technologies • HTML, CSS, JavaScript • SVG (scalable vector graphics) ‣ Environment • Run a local web server - Command line (if Python is installed): - IDE (e.g., WebStorm) • Observable notebooks (observablehq.com) 20 python -m http.server
svg.selectAll('rect') .data(summits) .join('rect') .attr('fill', 'steelblue') .attr('width', 400) .attr('height', 50); Bind data to visual elements (D3 selections) 32 main.js JS 0 elements 3 elements append 3 elements
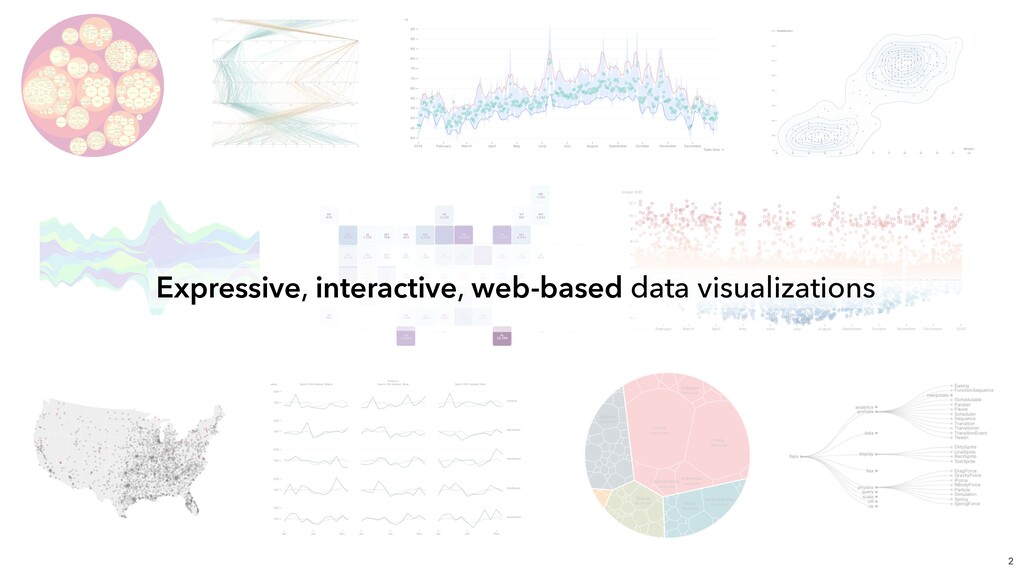
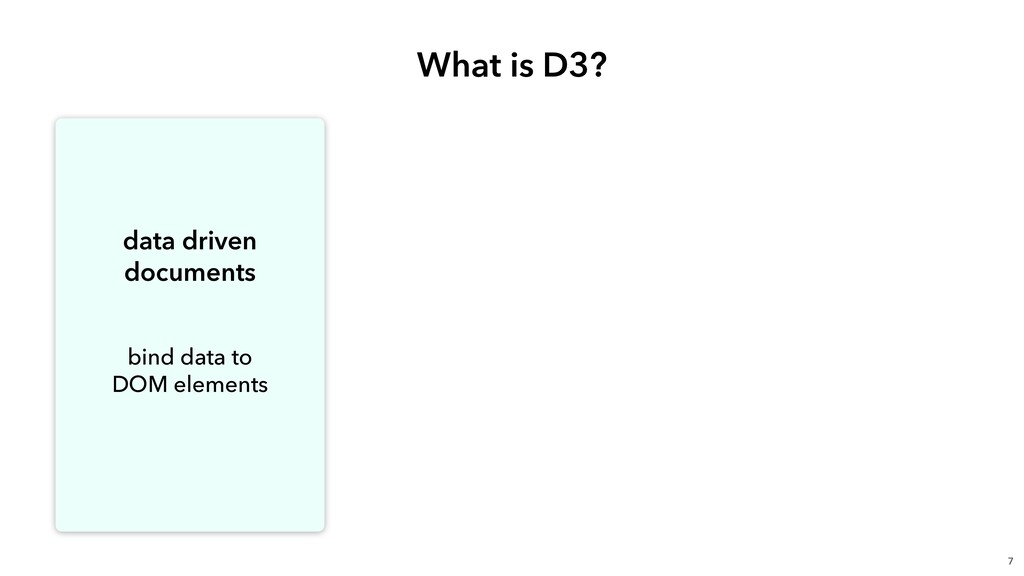
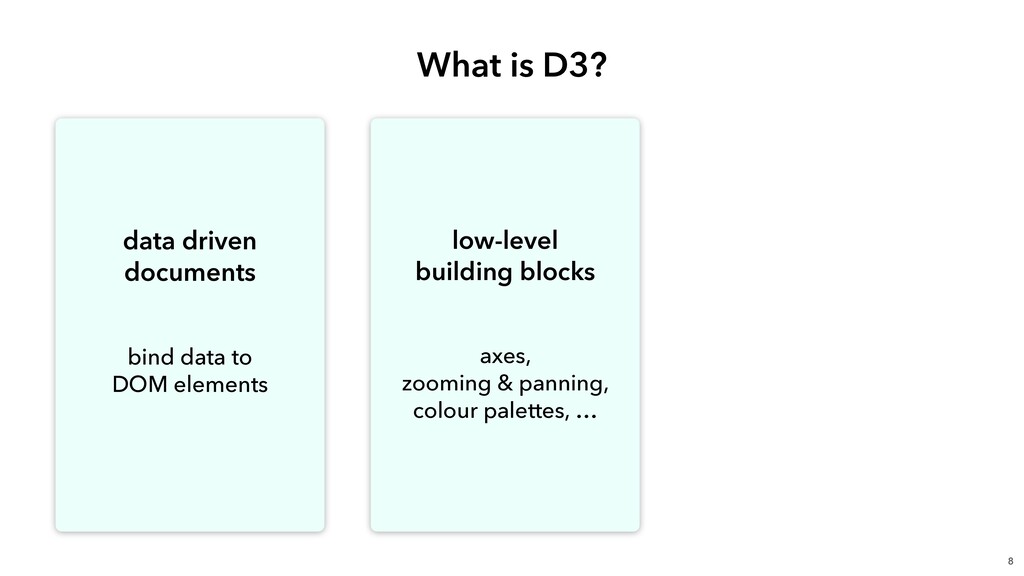
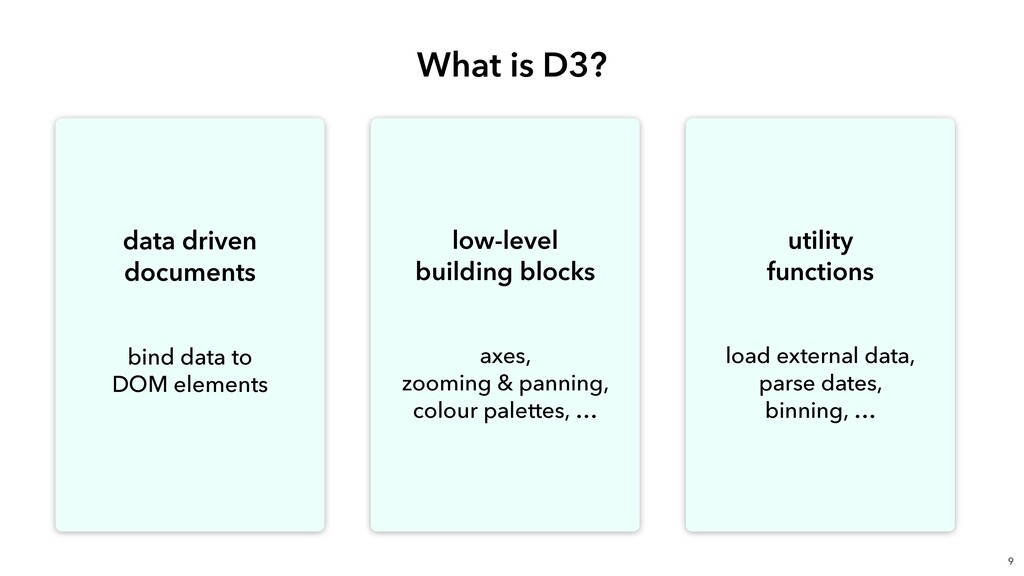
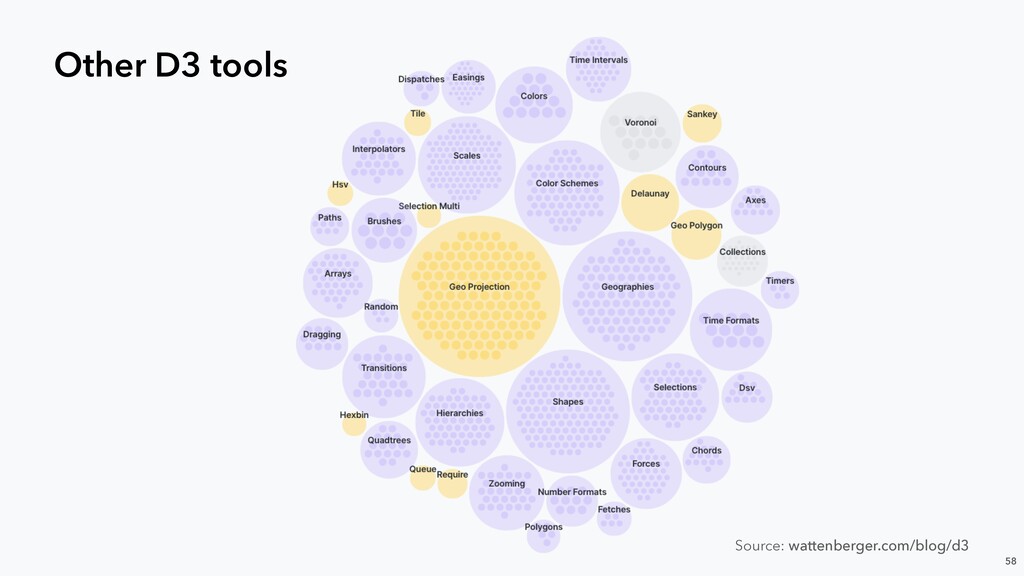
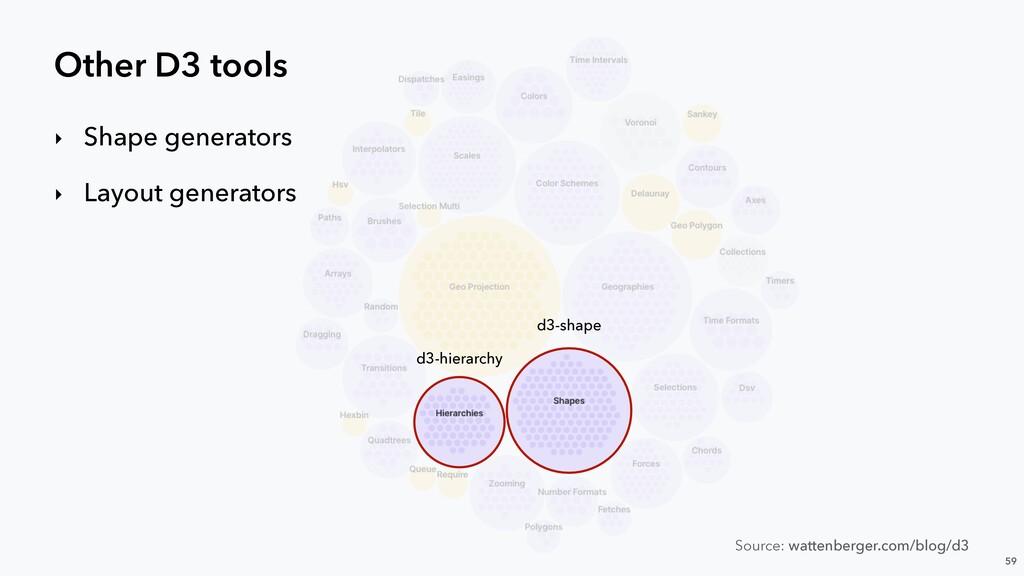
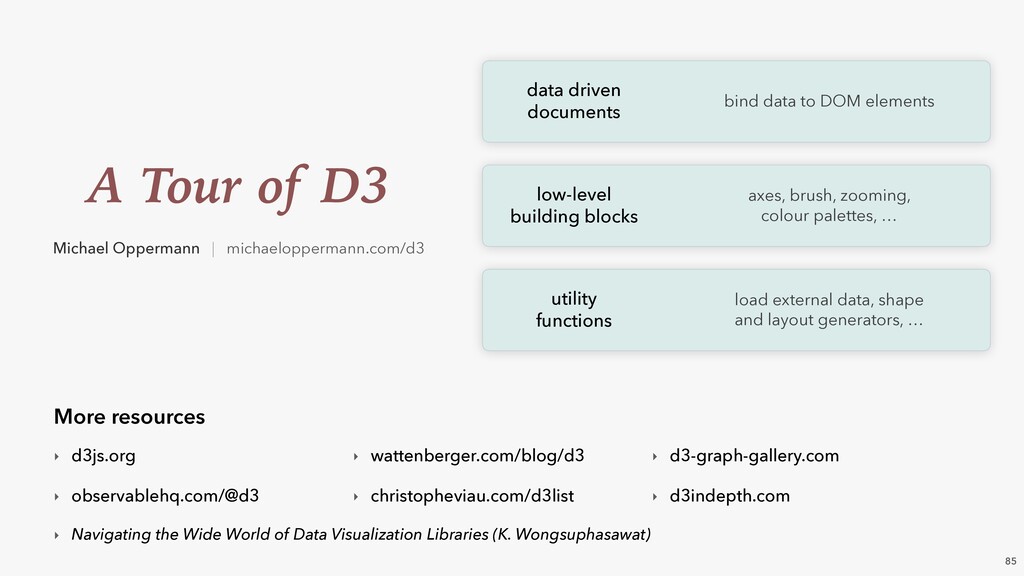
driven documents bind data to DOM elements low-level building blocks axes, brush, zooming, colour palettes, … utility functions load external data, shape and layout generators, … ‣ d3js.org ‣ observablehq.com/@d3 ‣ wattenberger.com/blog/d3 ‣ christopheviau.com/d3list ‣ d3-graph-gallery.com ‣ d3indepth.com More resources ‣ Navigating the Wide World of Data Visualization Libraries (K. Wongsuphasawat)
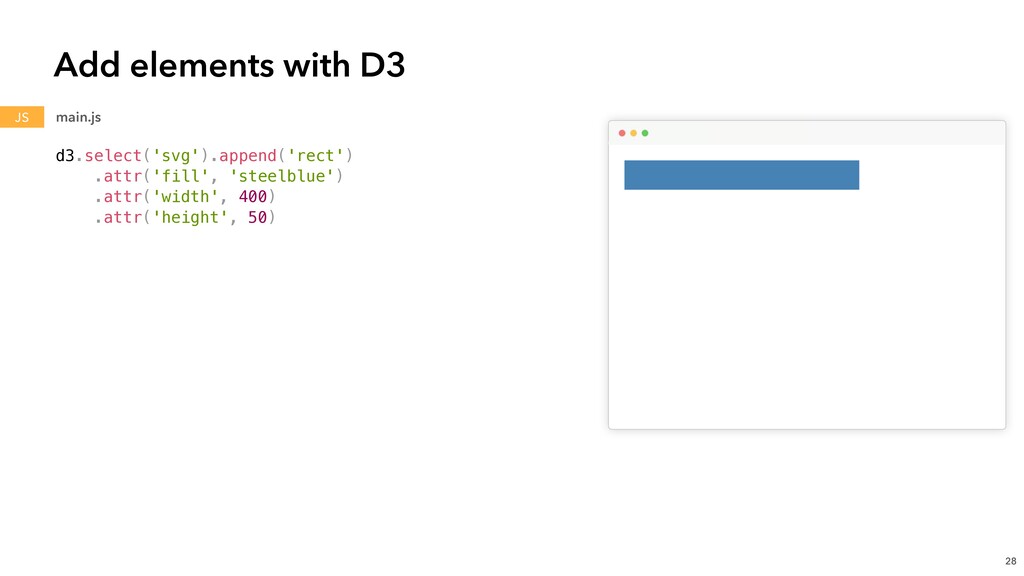
![const summits = ['Everest', 'Aconcagua', 'Denali']; Bind data to visual](https://files.speakerdeck.com/presentations/b03853cdd4bc48eb83b8b93ffddff948/slide_28.jpg)
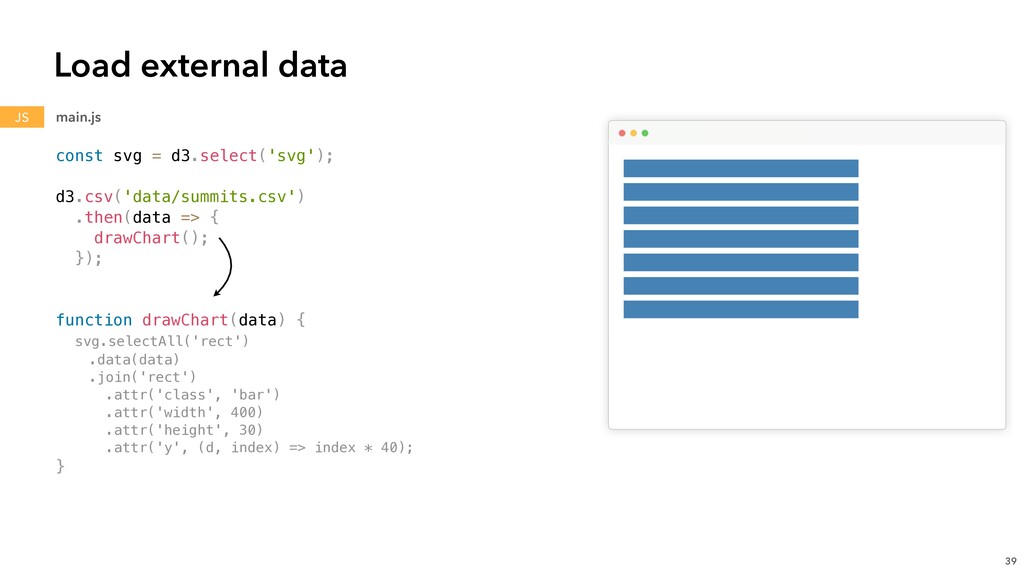
![const summits = ['Everest', 'Aconcagua', 'Denali']; const svg = d3.select('svg');](https://files.speakerdeck.com/presentations/b03853cdd4bc48eb83b8b93ffddff948/slide_29.jpg)
![const summits = ['Everest', 'Aconcagua', 'Denali']; const svg = d3.select('svg');](https://files.speakerdeck.com/presentations/b03853cdd4bc48eb83b8b93ffddff948/slide_30.jpg)
![const summits = ['Everest', 'Aconcagua', 'Denali']; const svg = d3.select('svg');](https://files.speakerdeck.com/presentations/b03853cdd4bc48eb83b8b93ffddff948/slide_31.jpg)
![const summits = ['Everest', 'Aconcagua', 'Denali']; const svg = d3.select('svg');](https://files.speakerdeck.com/presentations/b03853cdd4bc48eb83b8b93ffddff948/slide_32.jpg)
![const summits = ['Everest', 'Aconcagua', 'Denali']; const svg = d3.select('svg');](https://files.speakerdeck.com/presentations/b03853cdd4bc48eb83b8b93ffddff948/slide_33.jpg)
![const yScale = d3.scaleBand() .domain(data.map((d) => d.title )) .range([0, 300])](https://files.speakerdeck.com/presentations/b03853cdd4bc48eb83b8b93ffddff948/slide_44.jpg)
![const yScale = d3.scaleBand() .domain(data.map((d) => d.title )) .range([0, 300])](https://files.speakerdeck.com/presentations/b03853cdd4bc48eb83b8b93ffddff948/slide_45.jpg)
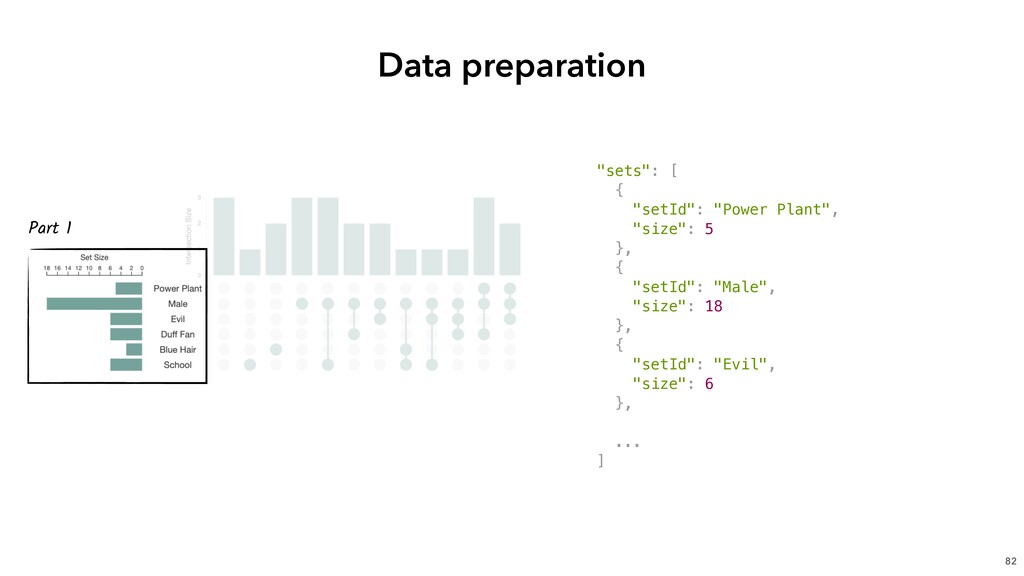
![83 Data preparation "combinations": [ { "combinationId": "a", "setMembership": [],](https://files.speakerdeck.com/presentations/b03853cdd4bc48eb83b8b93ffddff948/slide_82.jpg)