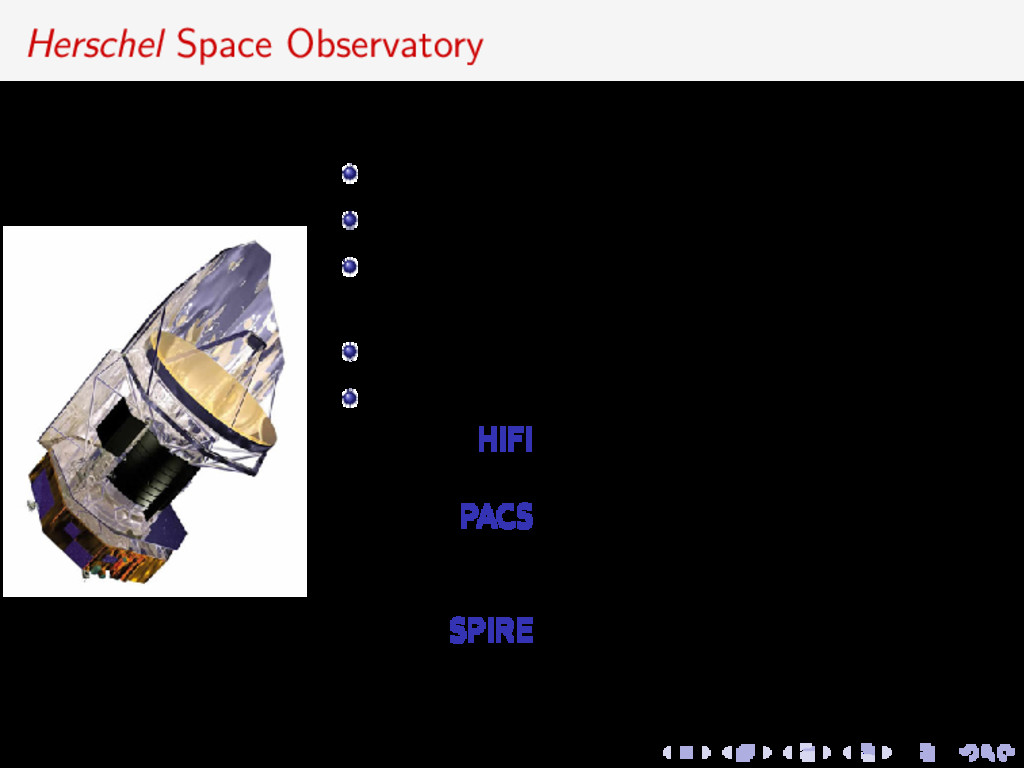
L2 active between 14 May 2009 – 29 April 2013 mission’s post-operations until 2017 to refine calibration and data archival study molecular chemistry of the universe 3 complementary instruments in IR and sub-mm: HIFI high-resolution heterodyne spectrometer 150–610 µm PACS camera and medium-resolution spectrometer 55–210 µm (60–85, 85–130 and 130–210 µm) SPIRE camera and imaging FTS 194–672 µm (250, 350 and 500 µm)
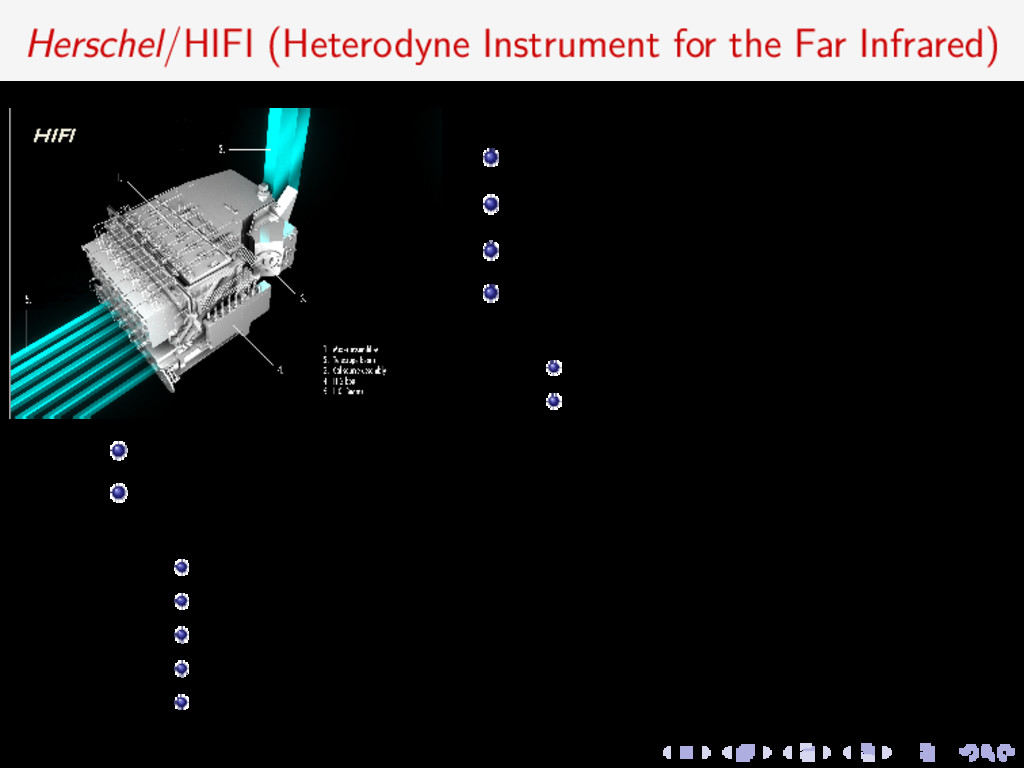
spectrometer 5 bands in the 480–1150 GHz dual frequency bands 1410–1910 GHz HIFI observes two polarizations simultaneously WBS - 1.1 MHz resolution HRS - 140 kHz resolution Wide range of chemical and dynamical studies HIFI’s high spectral resolution and sensitivity allows for the detection of multiple rotational water lines 90 h for comets from HssO program accurate determinations of water production rates in comets study of extended coma emission resolve H2 O line profiles to constrain excitation search for water emission in distant comets and MBC
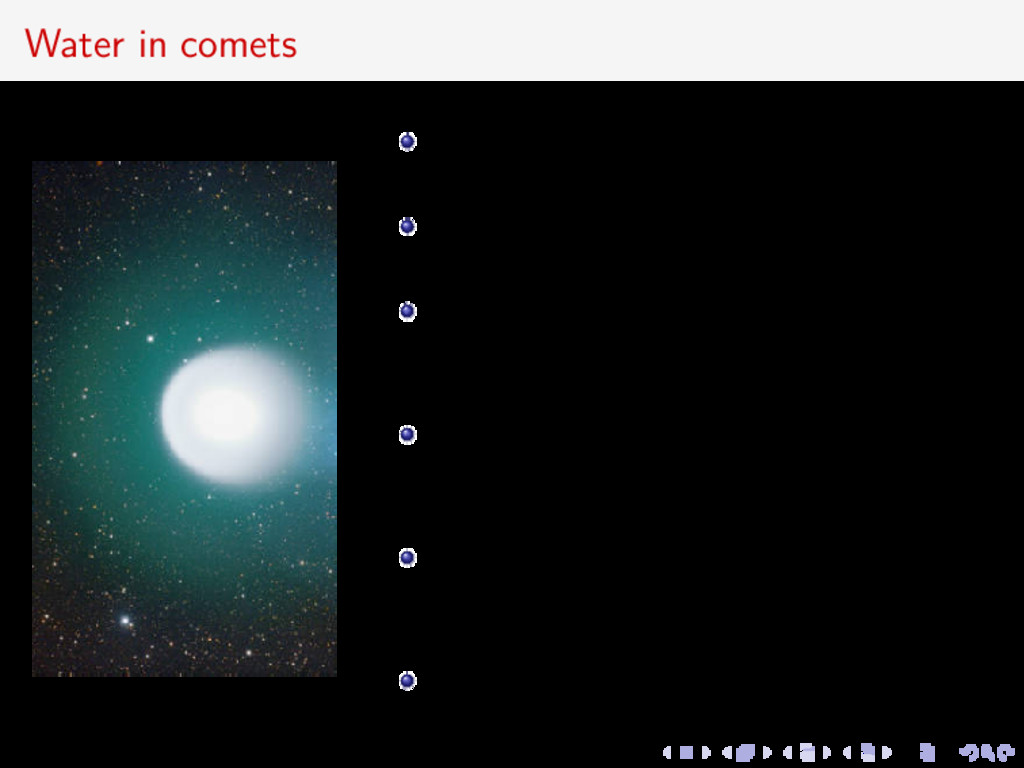
Water main component of cometary nucleus QH 2 O has been estimated from the ground through water high vibrational bands and the OH radical 110–101 ortho-H2O at 557 GHz was observed in several comets by SWAS and Odin Other ortho- and para-H2O, HDO and H18 2 O transitions observed by Herschel (e.g., Hartogh et al. 2010) MIRO has detected H2O, H17 2 O and H18 2 O in comet 67P/Churyumov-Gerasimenko
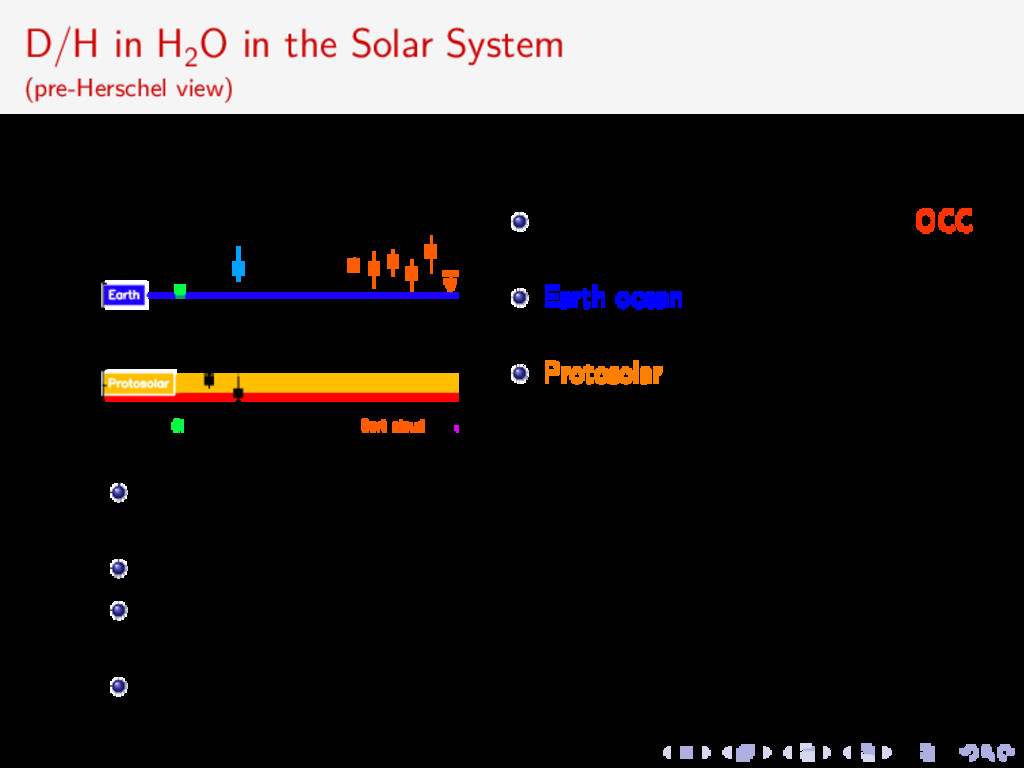
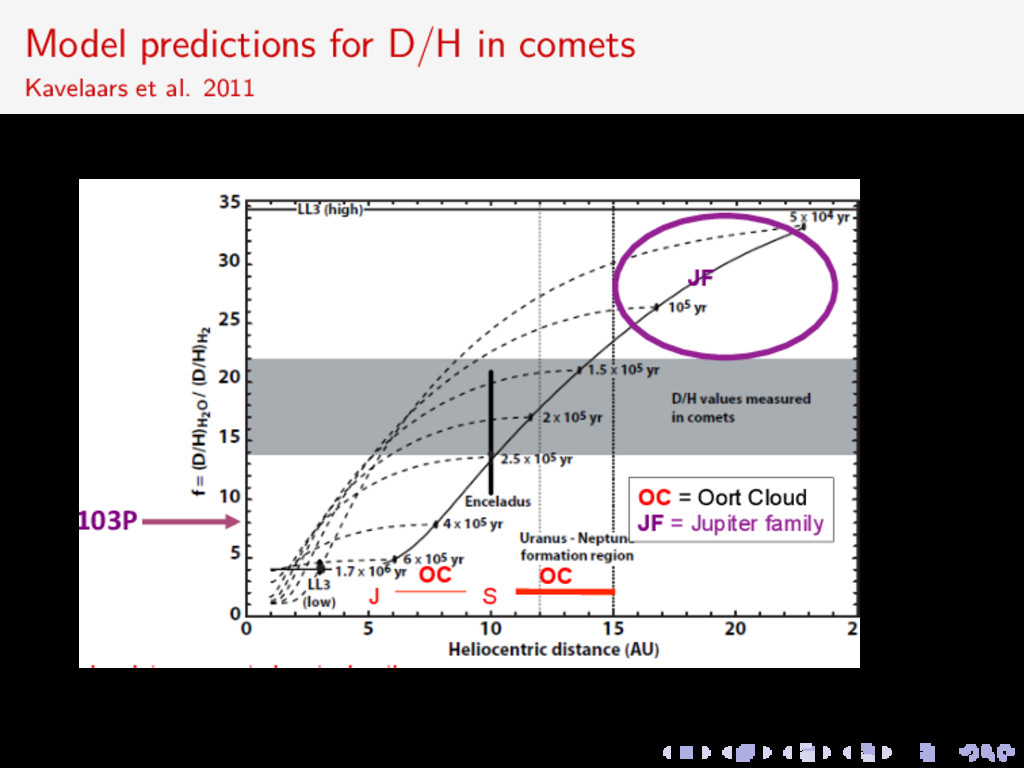
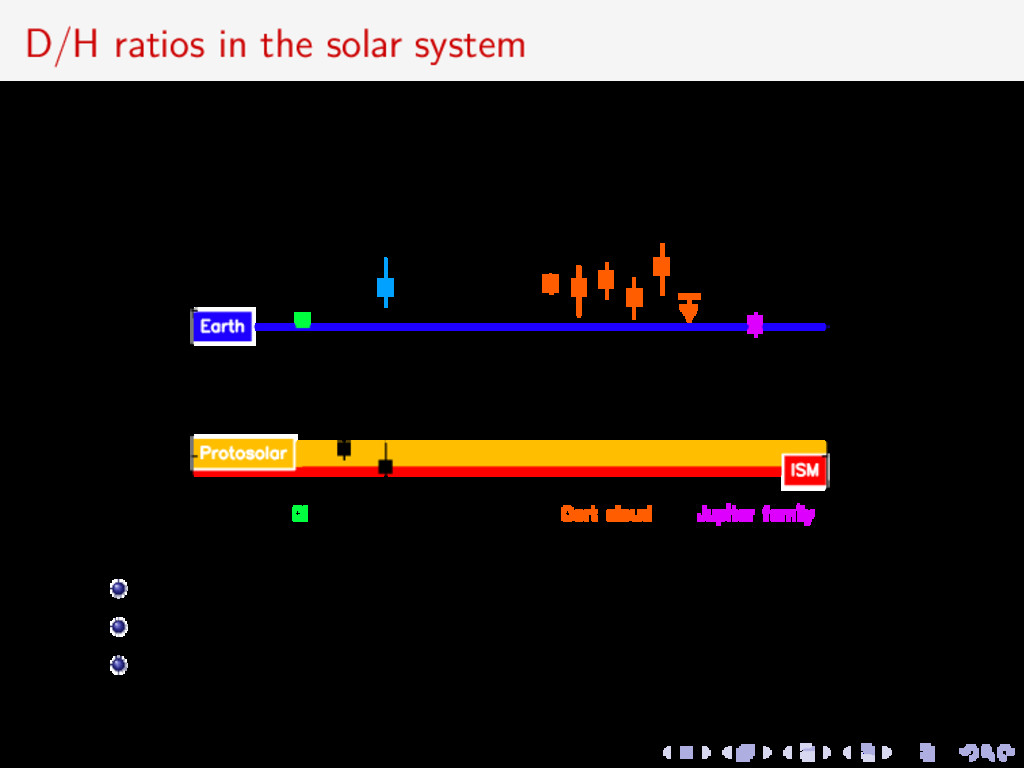
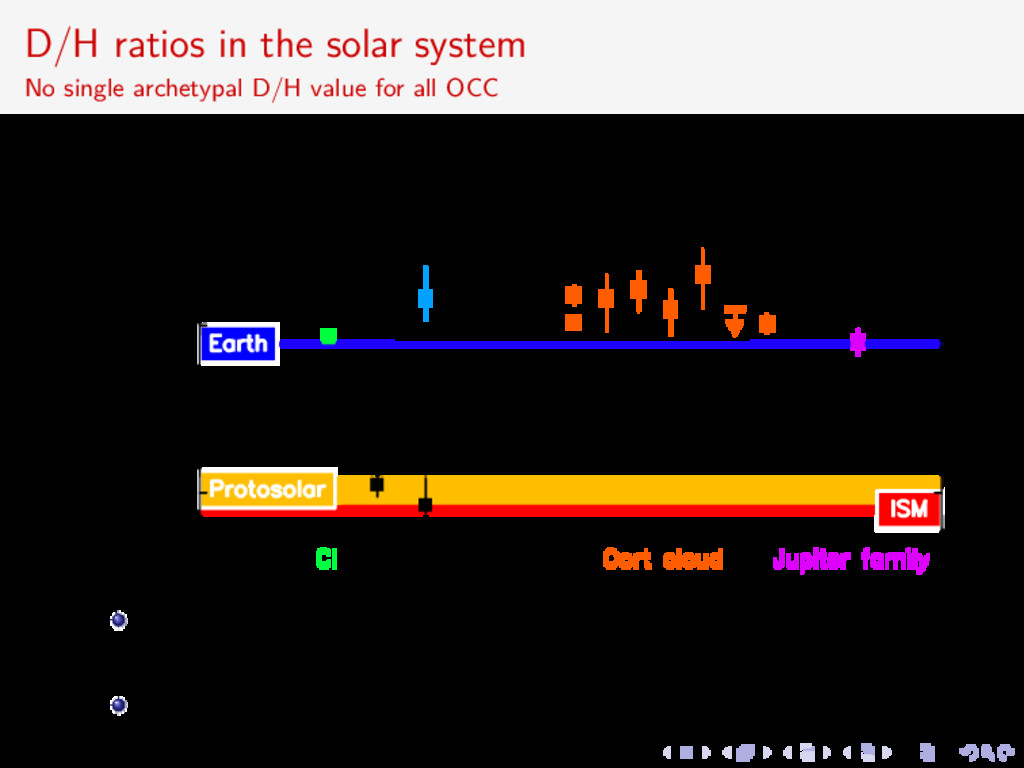
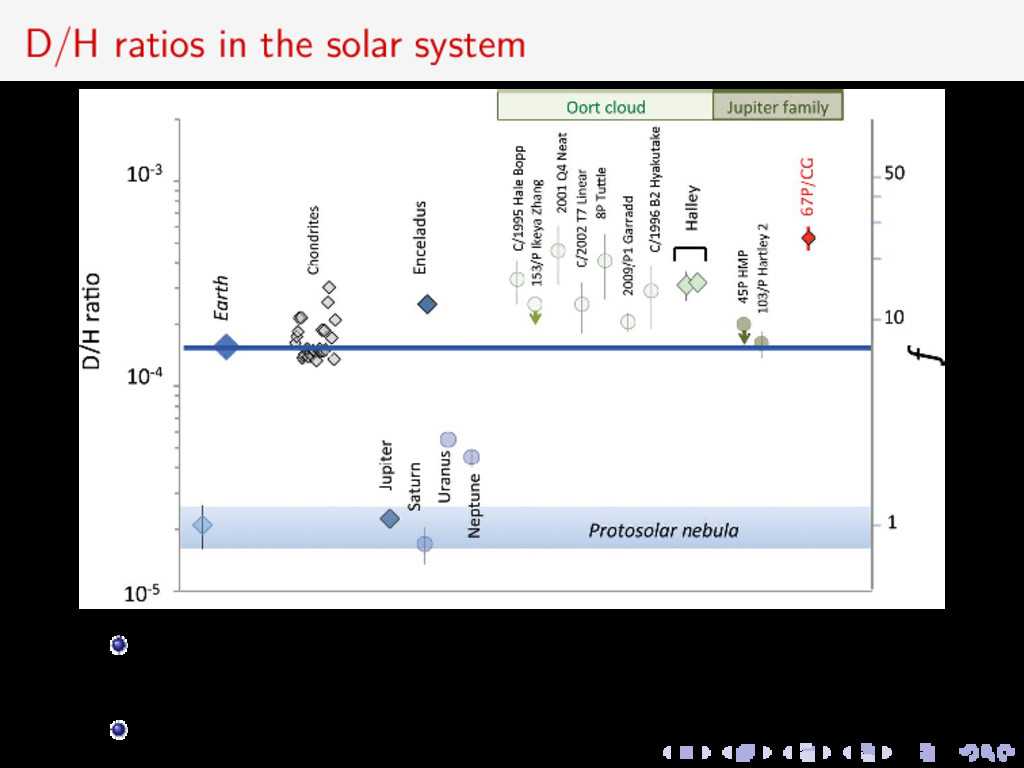
Mean D/H measured in several OCC is 3 × 10⁻⁴ Earth ocean (Vienna Standard Mean Ocean Water) is 1.56 × 10⁻⁴ Protosolar D/H ratio in H2 is 2.5 × 10⁻⁵ Cometary D/H ratios represent a factor of ∼ 12 enrichment over the protosolar value and ∼ 2 enrichment over the Earth ocean value D/H enrichment in Enceladus is similar to OCCs From isotopic measurements and dynamical models most probable source of Earth H2 O was ice-rich reservoir in outer asteroid belt Comets could have contributed less than 10% of the Earth water
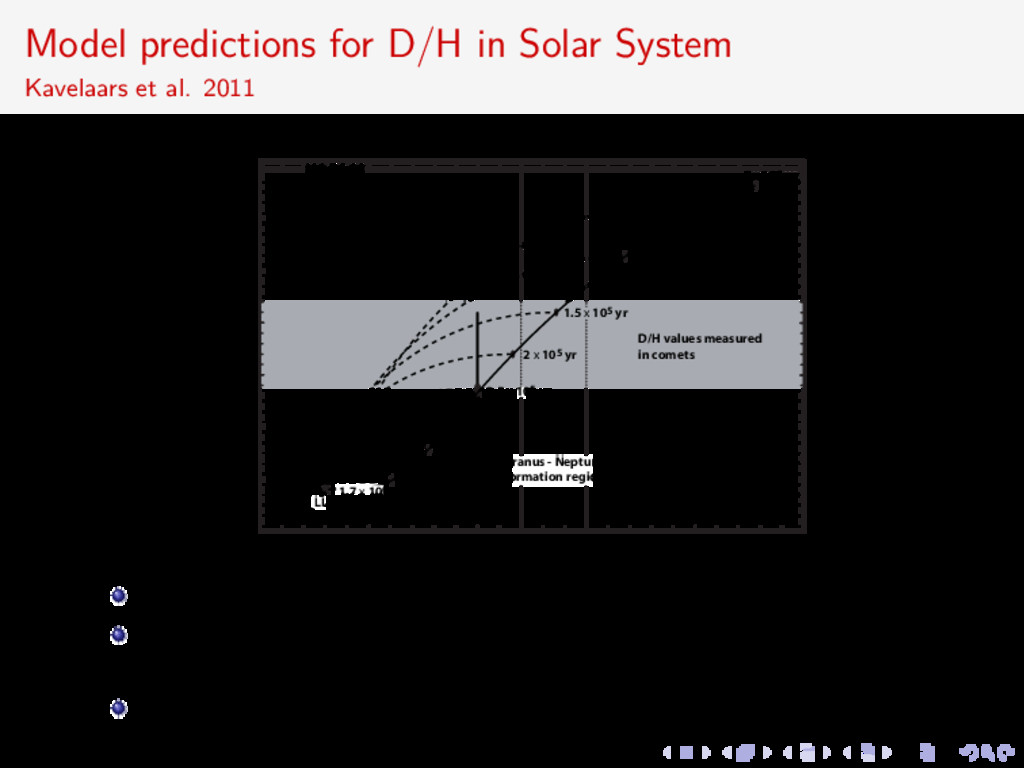
2011 Enceladus 5 x 10⁴ yr f = (D/H)H2O / (D/H)H2 0 5 10 15 20 25 0 5 10 15 20 25 30 Heliocentric distance (AU) 35 105 yr 2 x 10⁵ yr 4 x 10⁵ yr 6 x 10⁵ yr LL3 (low) 1.5 x 10⁵ yr 2.5 x 10⁵ yr 1.7 x 10⁶ yr Uranus - Neptune formation region D/H values measured in comets LL3 (high) f evolution in gas phase prior to condensation LL3 high value taken as initial highly enriched protosolar value due to low temperature non-equilibrium chemistry Isotopic exchange reactions between H2 and HDO led to a gradual reduction of D/H ratio in water
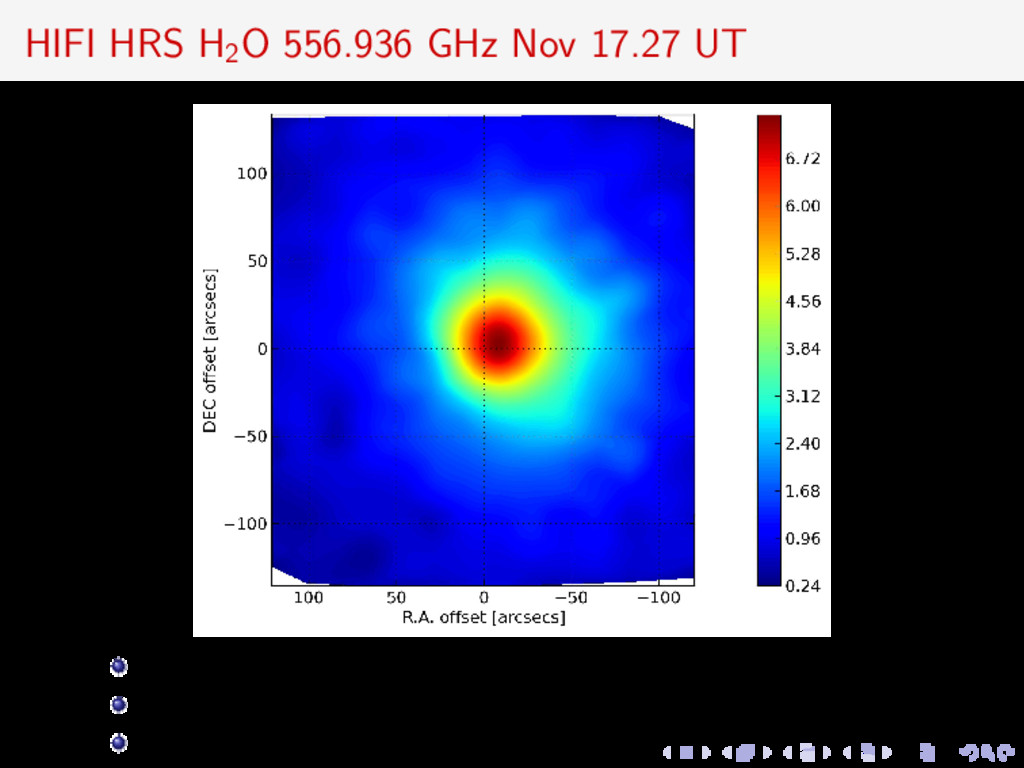
Target of NASA’s EPOXI mission on 4 Nov 2010 Elongated nucleus with 18 h period Perihelion on 28 Oct 2010 at rh = 1.05 AU Closest approach to Earth on 20 Oct 2010 at 0.12 AU Typical QH 2 O = 1028 s−1 (active) Herschel observed far-IR and sub-mm spectrum and imaged thermal dust at 70-672 µm (Oct 24–Nov 17)
al. 2011 20 days post-perihelion (rh = 1.095 AU, ∆ = 0.212) Observing sequence 10 32-min scans of HDO 110 –101 at 509.292 GHz 10 6-min scans of H2 O and H18 2 O 110 –101 at 556.936 and 547.676 GHz 5 16-min on-the-fly maps of the H2 O 110 –101 transition Single-point observations in frequency switched mode (94.5 MHz throw) Similar beam sizes (FWHM 38.1, 38.7 and 41.6 , ∼6500 km) Spectra acquired with WBS and HRS simultaneously All lines were observed in H+V polarizations
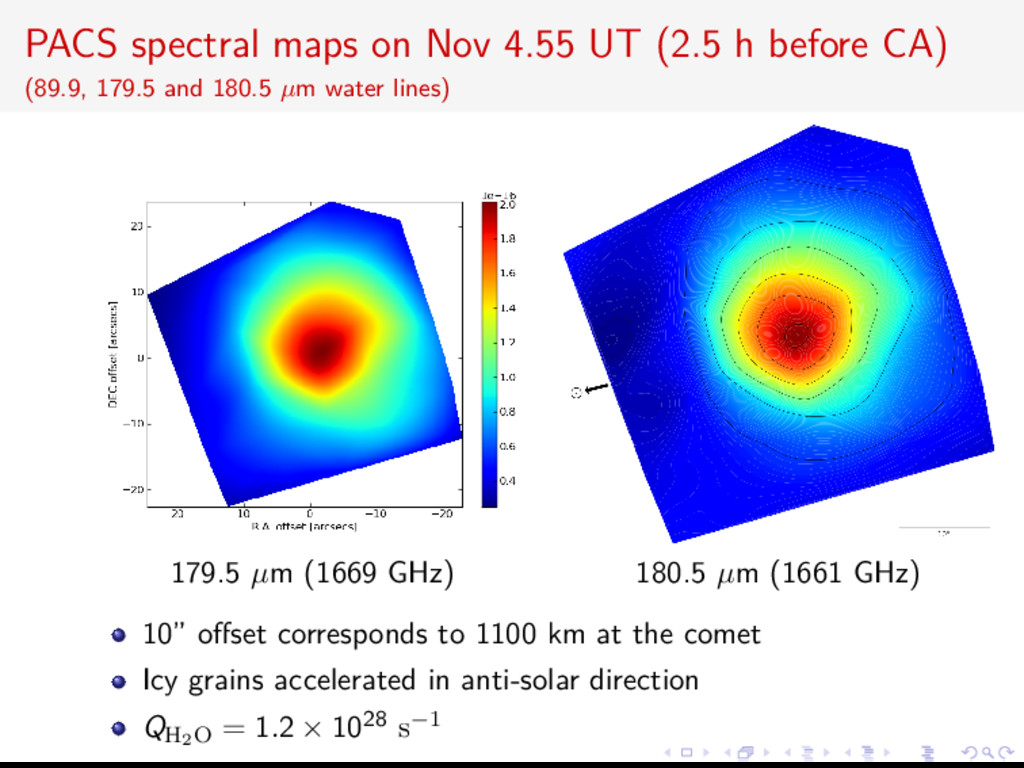
CA) (89.9, 179.5 and 180.5 µm water lines) 179.5 µm (1669 GHz) 180.5 µm (1661 GHz) 10” offset corresponds to 1100 km at the comet Icy grains accelerated in anti-solar direction QH2O = 1.2 × 1028 s−1
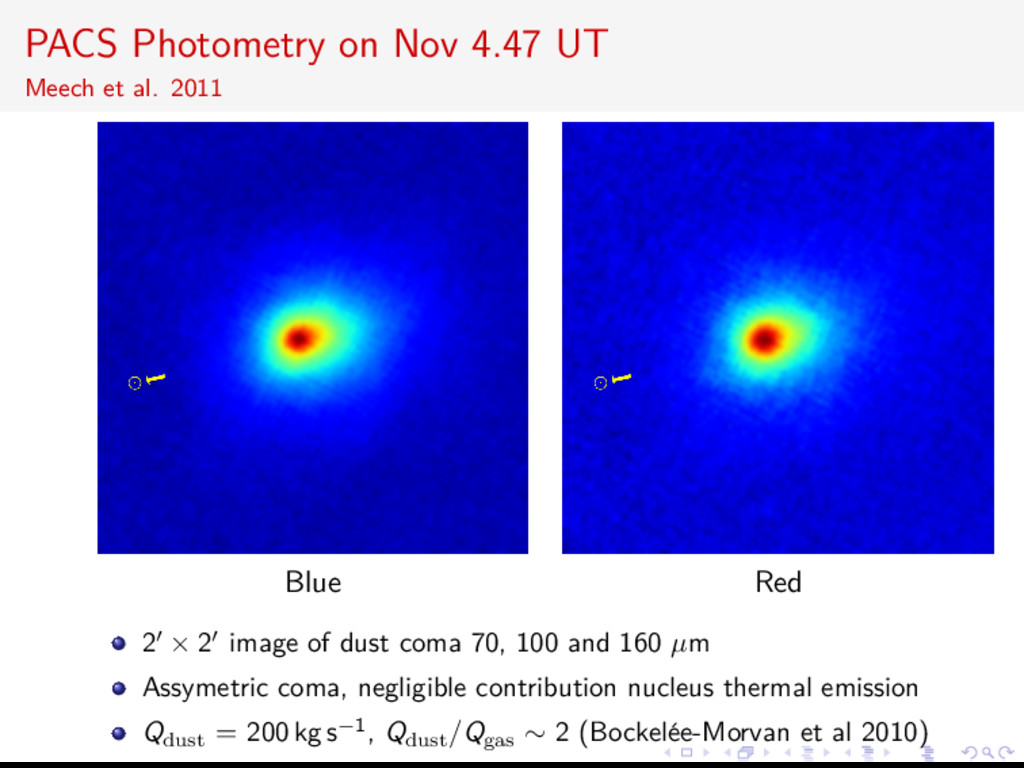
Blue Red 2 × 2 image of dust coma 70, 100 and 160 µm Assymetric coma, negligible contribution nucleus thermal emission Qdust = 200 kg s−1, Qdust /Qgas ∼ 2 (Bockel´ ee-Morvan et al 2010)
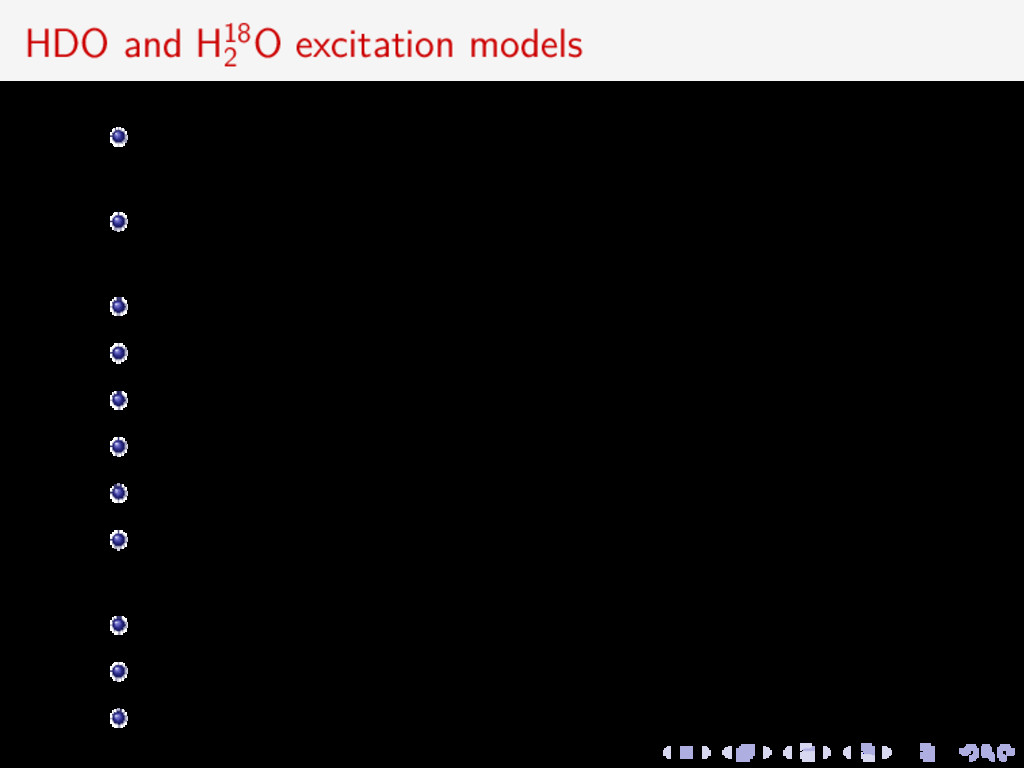
H2O and electrons dominate the excitation in the inner coma (Crovisier 1984) solar infrared pumping of vibrational bands lead to fluorescence equilibrium in the outer coma self-absorption effects are negligible standard Haser distribution with isotropic outgassing level populations depend on collisional rates and Tkin H2 O–H2 O cross section are derived from Itikawa 1972 Tkin = 50 K from CH3 OH mm Tkin ∼ 70–85 K from ro-vibrational lines in near-IR at scales of 0.5-2 (Mumma et al 2011) electron density xne = 0.2 wrt measurements in 1P/Halley vexp = 0.6 km s−1 from half-width of optically thin lines ortho-to-para ratio 2.8 (consistent with IR Mumma et al 2011)
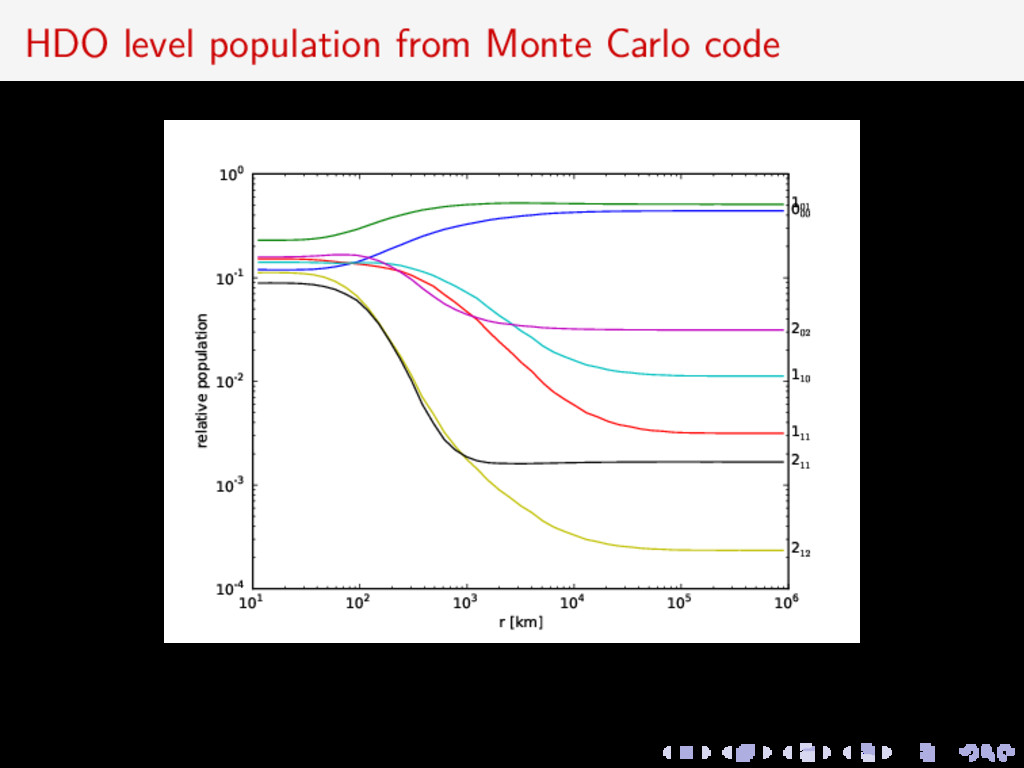
104 105 106 r [km] 10-4 10-3 10-2 10-1 100 relative population 000 101 111 110 202 212 211 HIFI observations sample molecules with an excitation state intermediate between LTE and fluorescence equilibrium
Assuming VSMOW 16O/18O = 500 ± 50 (520 ± 30 in 4 comets with Odin): (D/H)H 2 O = (1.61 ± 0.24) × 10−4 HDO/H18 2 O production rate ratio is not very sensitive to the model parameters unexpected result: factor of two smaller than in OCCs (2.96 ± 0.25) × 10−4 close to terrestrial VSMOW D/H value (1.558 ± 0.001) × 10−4 larger than the protosolar value (2.1 × 10⁻⁵) and the ISM value (1.6 × 10⁻⁵) in H2 JFC expected to have higher D/H as they formed in Kuiper belt in colder environment
D/H ratios Oort cloud comets have twice the value of the Earth’s ocean JFC 103P/Hartley 2 and the CI values in carbonaceous chondrites are consistent with VSMOW
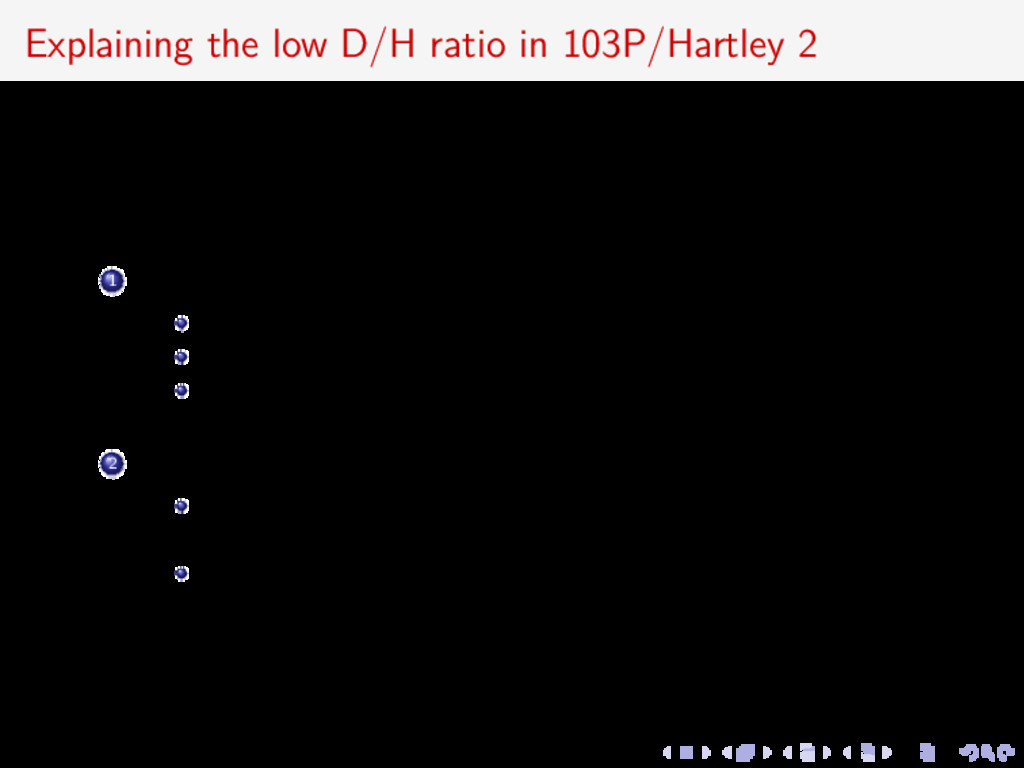
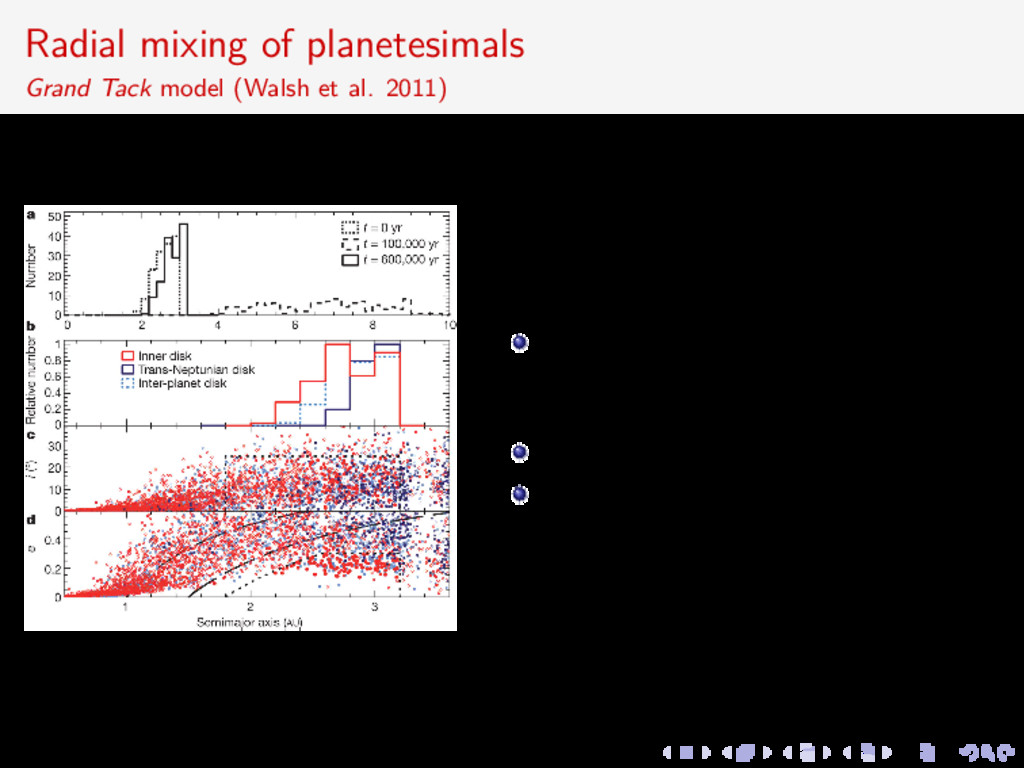
in H2O predicted to increase with distance from the Sun (not yet confirmed by observations) 1 103P/Hartley 2 may not come from the Kuiper belt Fraction of JFC originate in the OC Is it a Trojan (Horner et al. 2007) originating near Jupiter? Perhaps OCCs did not form in the vicinity of the giant planets or do not represent the solar system (Levison et al. 2010) 2 D/H ratio with heliocentric distance not as expected In the early phase of the solar system formation material was mixed over large distances (Walsh 2011). Region of solar nebula with terrestrial D/H ratio includes the Kuiper belt
2011) Evolution of small body population Inward then outward type II migration of Jupiter and Saturn Explain Mars’ mass and distribution of S/C/D asteroids in main belt
2011) Distribution of 100-km planetesimals at the end of the giant planet migration phase Substantial radial mixing TNOs on eccentric Earth-crossing orbits
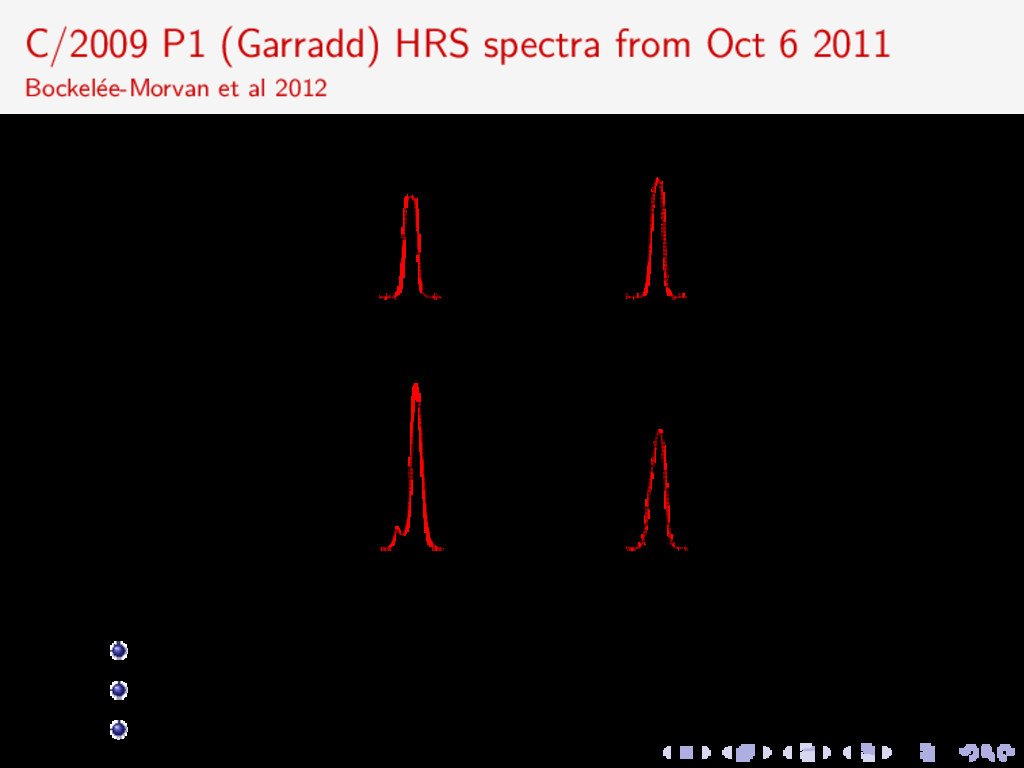
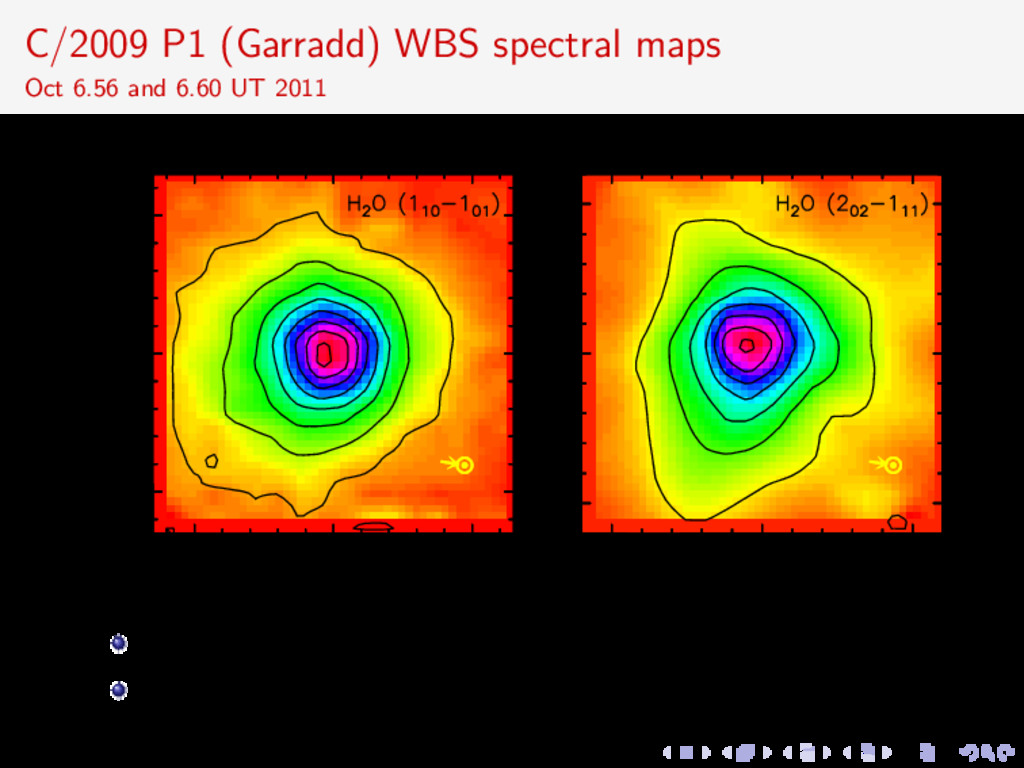
i = 106◦) perihelion on Dec 23, 2011 HIFI HDO observations conducted on Oct 6, 2011 rh = 1.88 AU ∆ = 1.76 AU Same observing strategy as for comet 103P/Hartley 2 H2 O and H18 2 O lines observed simultaneously in band 1a mixer H18 2 O line more reliable reference for D/H determination maps serve to constrain the H2 O excitation H2 O line at 988 GHz observed in the band 4a mixer telescope beam sizes 38. 1, 38. 7, and 41. 6 for H2 O, H18 2 O and HDO lines (∼ 50 000 km)
ee-Morvan et al 2012 110 –101 HDO (509 GHz), H18 2 O (548 GHz), H2 O (557 and 988 GHz) phase angle is 30◦ profiles with 30% extended production (Paganini et al 2012)
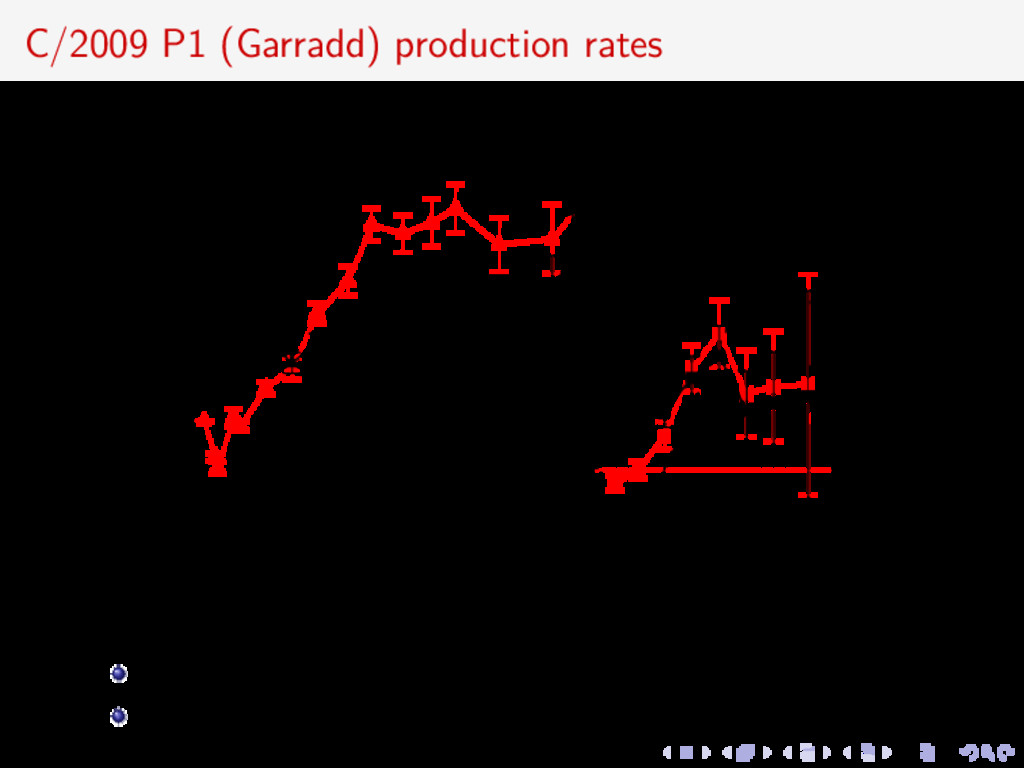
2012 HDO/H18 2 O = 0.215 ± 0.023 Using H2 O production rates with 30% extended source D/H = (2.06 ± 0.22) × 10−4 16O/18O = 523 ± 32 Variable T profile and isotropic outgassing v 0.5–0.6 km s−1 Significantly higher than 103P D/H = (1.61 ± 0.24) × 10−4 Only 16O/18O ∼ 300 can reconcile D/H with OCC Uncertainties take into account 5% relative calibration error
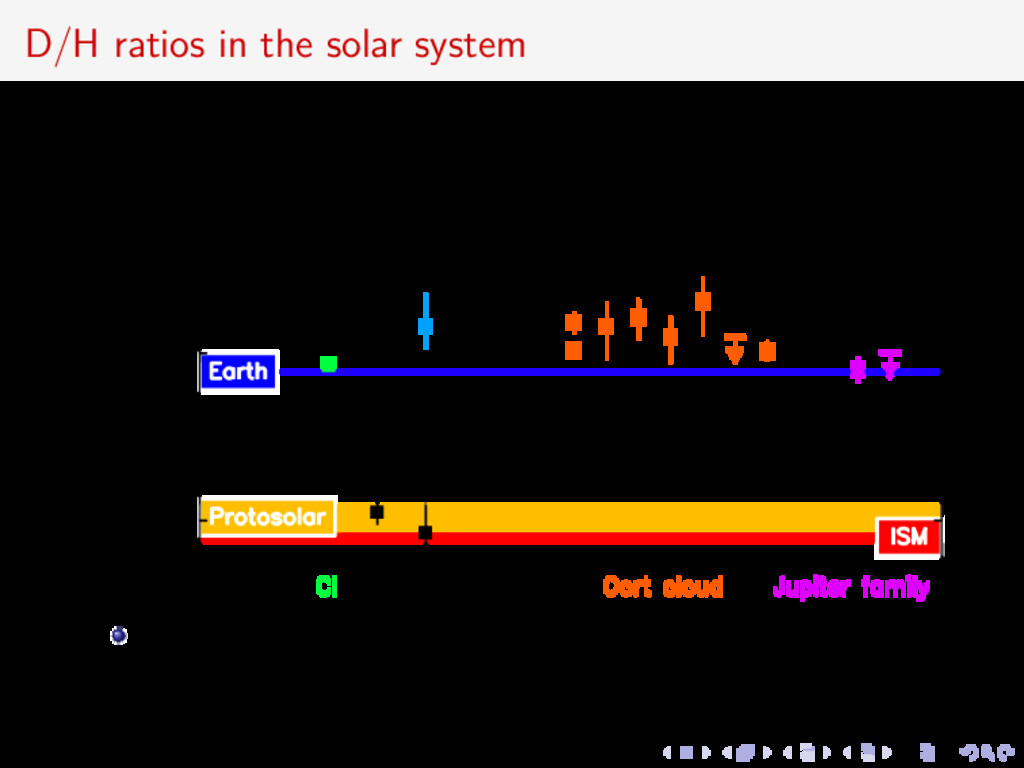
value for all OCC Oort-cloud comet 2009 P1 has a D/H ratio that is significantly higher than the value of the Earth’s ocean 16O/18O consistent with terrestrial value
August 2011 No HDO emission detected with D/H < 2 × 10⁻⁴ Consistent with Hartley 2 measurement Canonical OCC D/H 3 × 10⁻⁴ excluded at 4.5σ Further confirmation of diversity of D/H
with models involving isotopic exchanges: current understanding of deuteration in the solar system, or the formation zone of JFCs, have to be revisited Ices condensed close to the Sun would be more deuterated? e.g., out of equilibirium chemistry at high T H2 /H2 O/OH/H/O (Thi et al. 2010) D/H is not monotonically increasing away from the Sun (Yang et al. 2012) Revisit origin of JFCs and OCCs JFC = Trojans formed in the vicinity of Jupiter? 90% of OCC from other stars in the Sun’s birth cluster (Levison et al. 2010)?
ratio in the OC population Dichotomy between JFC and OCC? Diversity within the two populations expected from the Grand Tack dynamical model involving Saturn and Jupiter inner migration (Walsh et al. 2011) The reservoir of icy bodies with Ocean-like water is larger than previously thought and may include the Kuiper belt based on very small sample much higher fraction of ocean water could have been delivered by comets? Alexander et al. (2012) suggests the bulk D/H in comets might be compatible with the Ocean’s value, considering D-enriched organics
of D/H ratio (3 comets) Rosetta 67P (JFC) ALMA band 8 gives access to the 110–101 line at 464 GHz in bright comets comets require scheduling on a short notice and their emission is extended best suited for compact ALMA configurations autocorrelation mode is most sensitive for HDO detection complementary observations of water in the IR, or UV/radio observations of OH, will be used to obtain accurate water production rates HDO can be observed in the near-IR, or UV for bright comets
110–101 lines HDO (509 GHz) and H18 2 O (548 GHz) detected in 2 objects Ocean like water found for the first time in a JFC High D/H values previously measured in OCCs are not representative of all comets. Findings does not fit present models on origin of cometary material and isotopic fractionation with heliocentric distance Dynamical modelling suggests that population of planetesimals underwent large-scale mixing Isotopic differences in comets may be linked to the chemical diversity observed in JFC and OCC Paradigm of maximum 10% cometary water in hydrosphere based on composition arguments needs to be revisited Further D/H measurements required to increase sample size