Upgrade to Pro — share decks privately, control downloads, hide ads and more …

Data Science in a Box

Data Science in a Box

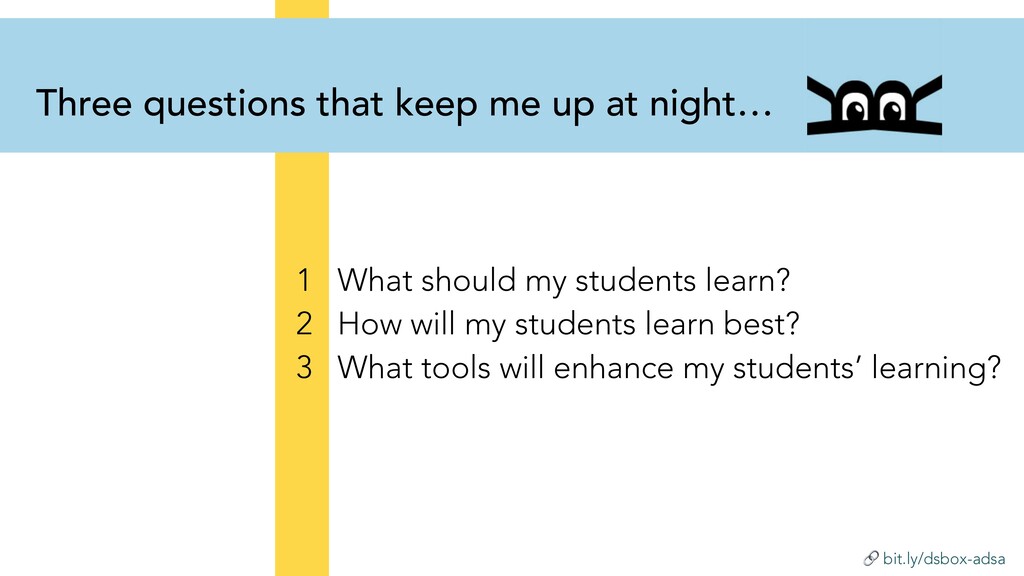
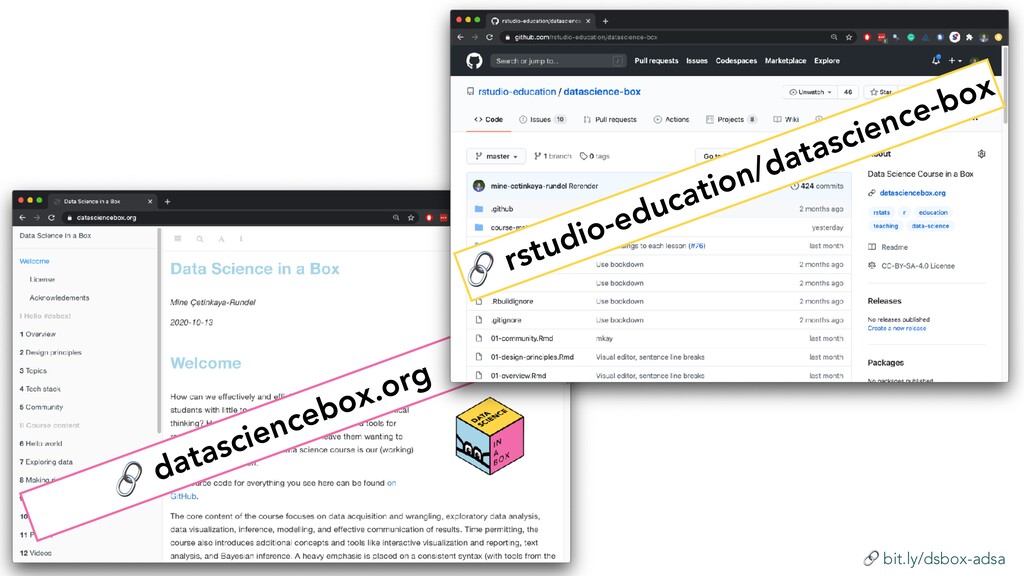
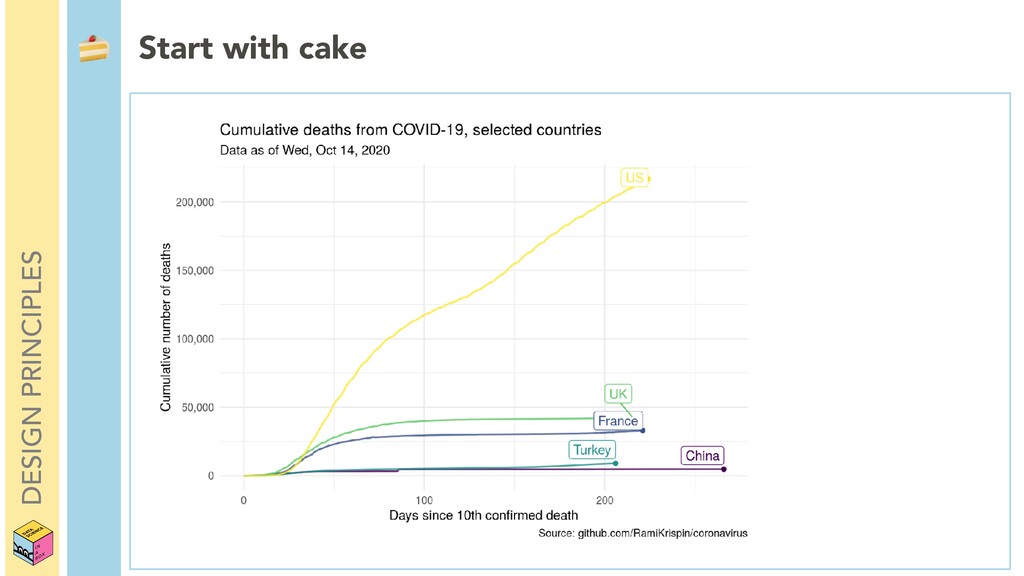
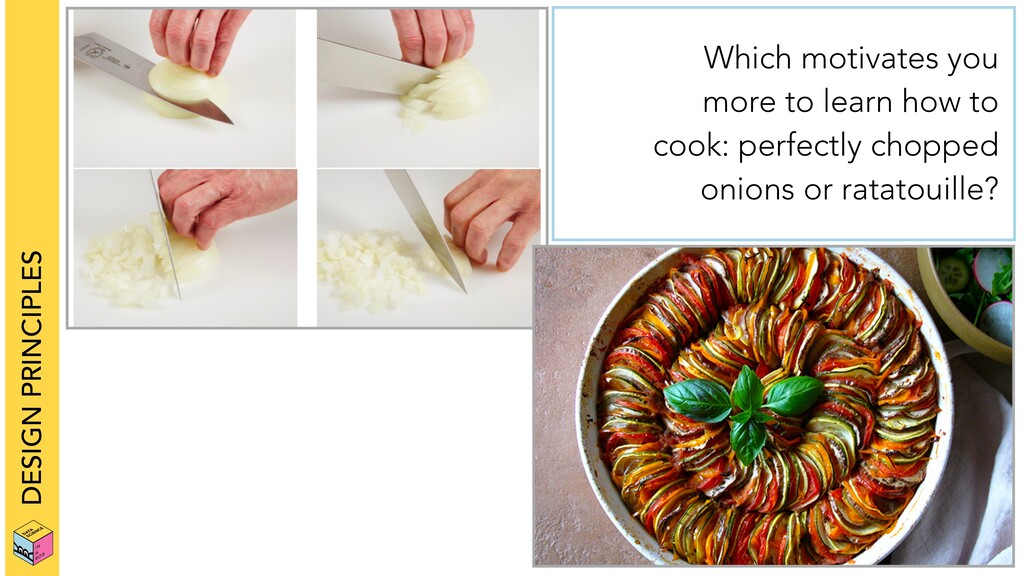
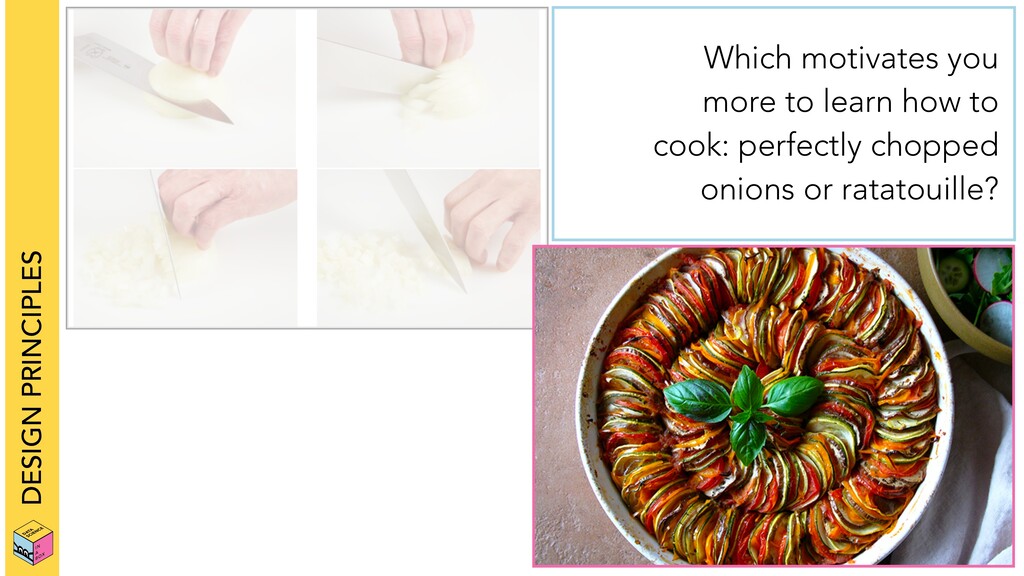
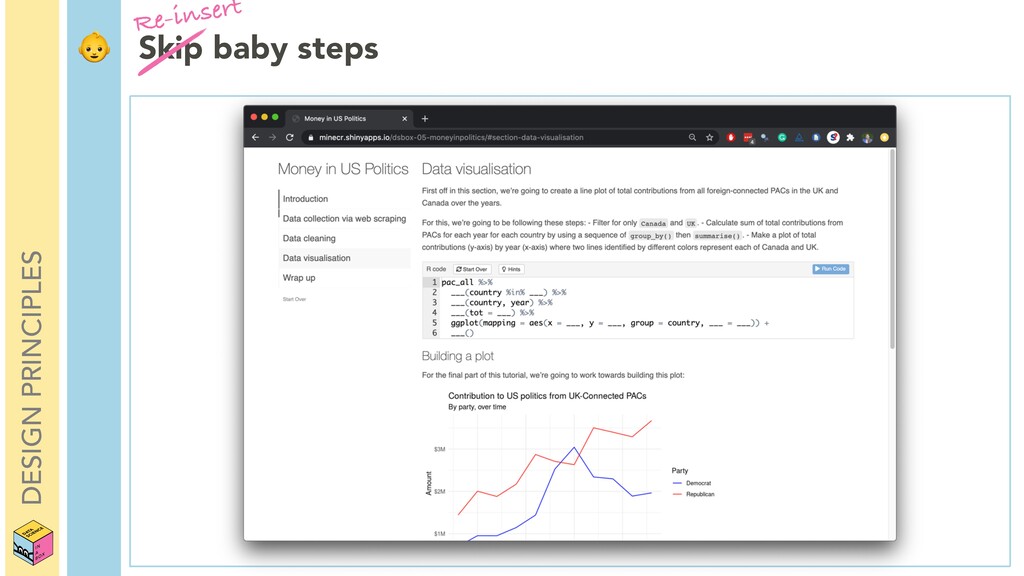
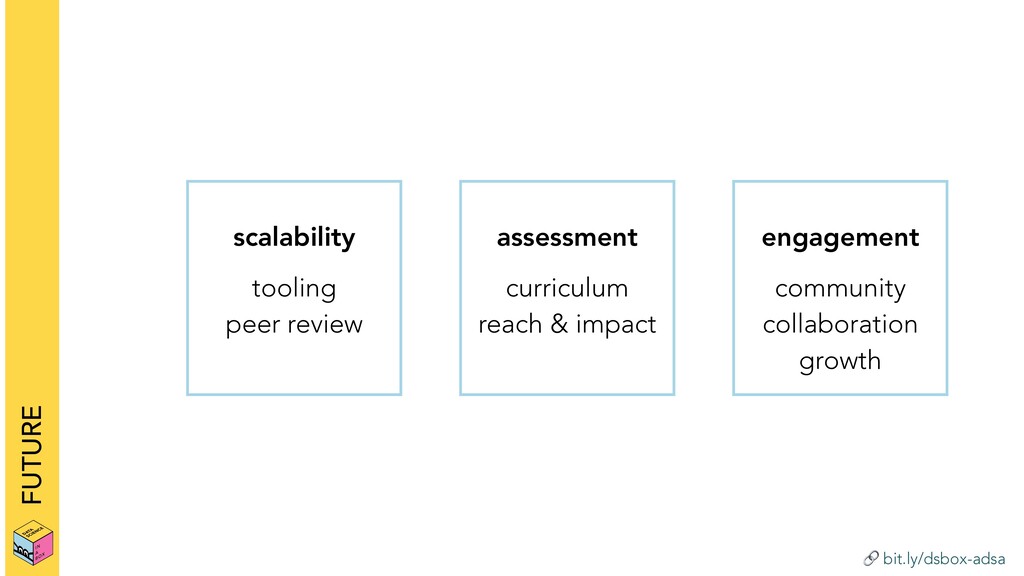
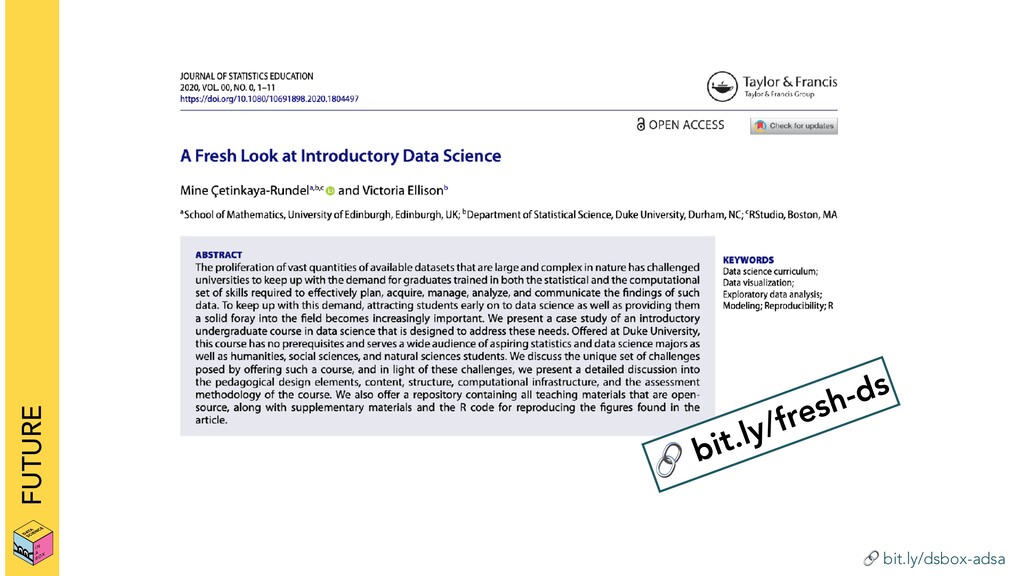
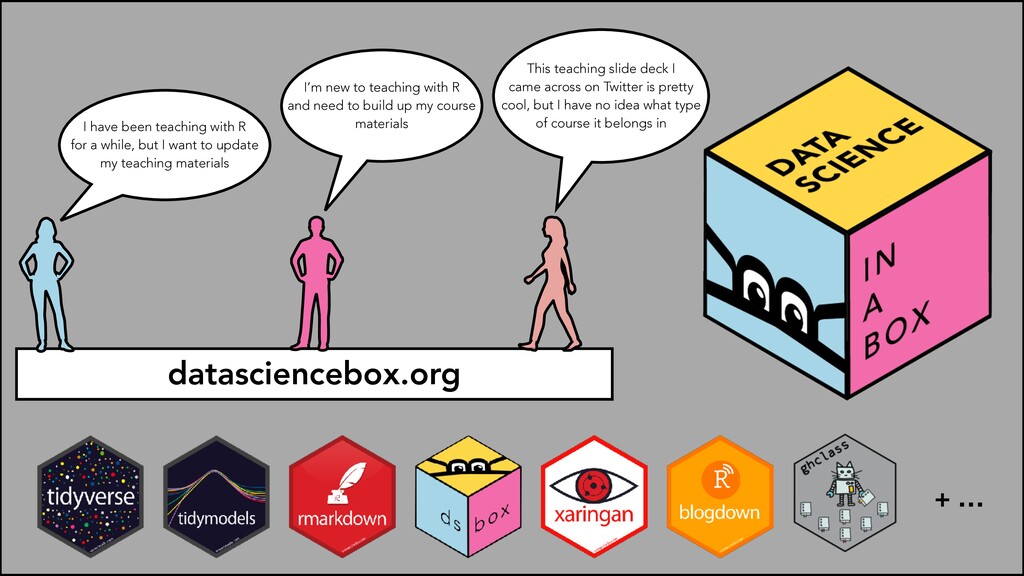
Data Science in a Box (datasciencebox.org) is an open-source project that aims to equip educators with concrete information on content and infrastructure for designing and painlessly running a semester-long modern introductory data science course with R. In this talk we outline five guiding pedagogical principles that underlie the choice of topics and concepts introduced in the course as well as their ordering, highlight a sample of examples and assignments that demonstrate how the pedagogy is put into action, introduce `dsbox` -- the companion R package for datasets used in the course as well as interactive tutorials, and share sample student work and feedback. We will also walk through a quick start guide for faculty interested in using all or some of these resources in their teaching.

Mine Cetinkaya-Rundel

October 15, 2020
Tweet

More Decks by Mine Cetinkaya-Rundel

Other Decks in Education

Transcript

  1. bit.ly/dsbox-adsa Three questions that keep me up at night… 1

    What should my students learn? 2 How will my students learn best? 3 What tools will enhance my students’ learning?
  2. bit.ly/dsbox-adsa 1 What should my students learn? 2 How will

    my students learn best? 3 What tools will enhance my students’ learning? Three questions that keep me up at night… Content Pedagogy Infrastructure
  3. bit.ly/dsbox-adsa AUDIENCE I have been teaching with R for a

    while, but I want to update my teaching materials I’m new to teaching with R and need to build up my course materials This teaching slide deck I came across on Twitter is pretty cool, but I have no idea what type of course it belongs in
  4. bit.ly/dsbox-adsa CONTENTS 30 slide decks 10 application exercises 13 computing

    labs ✍ 8 homework assignments ✔ 2 take-home exams 1 open-ended project website datasciencebox.org repository 8 interactive tutorials package dsbox … videos
  5. bit.ly/dsbox-adsa DESIGN PRINCIPLES cherish day one skip baby steps start

    with cake leverage the ecosystem hide the veggies
  6. DESIGN PRINCIPLES Start with cake ‣ Open today’s demo project

    ‣ Knit the document and discuss the results with your neighbor ‣ Then, change Turkey to a different country, and plot again
  7. DESIGN PRINCIPLES Start with cake With great examples, comes a

    great amount of code… but let’s focus on the task at hand… ‣ Open today’s demo project ‣ Knit the document and discuss the results with your neighbor ‣ Then, change Turkey to a different country, and plot again
  8. DESIGN PRINCIPLES Start with cake un_votes %>% filter(country %in% c("UK

    & NI", “US”, "Turkey")) %>% inner_join(un_roll_calls, by = "rcid") %>% inner_join(un_roll_call_issues, by = "rcid") %>% group_by(country, year = year(date), issue) %>% summarize( votes = n(), percent_yes = mean(vote == "yes") ) %>% filter(votes > 5) %>% # only use records where there are more than 5 votes ggplot(mapping = aes(x = year, y = percent_yes, color = country)) + geom_smooth(method = "loess", se = FALSE) + facet_wrap(~ issue) + labs( title = "Percentage of Yes votes in the UN General Assembly", subtitle = "1946 to 2015", y = "% Yes", x = "Year", color = "Country" )
  9. DESIGN PRINCIPLES Start with cake un_votes %>% filter(country %in% c("UK

    & NI", “US”, "Turkey")) %>% inner_join(un_roll_calls, by = "rcid") %>% inner_join(un_roll_call_issues, by = "rcid") %>% group_by(country, year = year(date), issue) %>% summarize( votes = n(), percent_yes = mean(vote == "yes") ) %>% filter(votes > 5) %>% # only use records where there are more than 5 votes ggplot(mapping = aes(x = year, y = percent_yes, color = country)) + geom_smooth(method = "loess", se = FALSE) + facet_wrap(~ issue) + labs( title = "Percentage of Yes votes in the UN General Assembly", subtitle = "1946 to 2015", y = "% Yes", x = "Year", color = "Country" )
  10. DESIGN PRINCIPLES Start with cake un_votes %>% filter(country %in% c("UK

    & NI", “US”, "Turkey")) %>% inner_join(un_roll_calls, by = "rcid") %>% inner_join(un_roll_call_issues, by = "rcid") %>% group_by(country, year = year(date), issue) %>% summarize( votes = n(), percent_yes = mean(vote == "yes") ) %>% filter(votes > 5) %>% # only use records where there are more than 5 votes ggplot(mapping = aes(x = year, y = percent_yes, color = country)) + geom_smooth(method = "loess", se = FALSE) + facet_wrap(~ issue) + labs( title = "Percentage of Yes votes in the UN General Assembly", subtitle = "1946 to 2015", y = "% Yes", x = "Year", color = "Country" )
  11. DESIGN PRINCIPLES Start with cake un_votes %>% filter(country %in% c("UK

    & NI", “US”, “France")) %>% inner_join(un_roll_calls, by = "rcid") %>% inner_join(un_roll_call_issues, by = "rcid") %>% group_by(country, year = year(date), issue) %>% summarize( votes = n(), percent_yes = mean(vote == "yes") ) %>% filter(votes > 5) %>% # only use records where there are more than 5 votes ggplot(mapping = aes(x = year, y = percent_yes, color = country)) + geom_smooth(method = "loess", se = FALSE) + facet_wrap(~ issue) + labs( title = "Percentage of Yes votes in the UN General Assembly", subtitle = "1946 to 2015", y = "% Yes", x = "Year", color = "Country" )
  12. DESIGN PRINCIPLES Which motivates you more to learn how to

    cook: perfectly chopped onions or ratatouille?
  13. DESIGN PRINCIPLES Which motivates you more to learn how to

    cook: perfectly chopped onions or ratatouille?
  14. DESIGN PRINCIPLES Hide the veggies ‣ Today we go from

    this to that ‣ And do so in a way that is easy to replicate for another state →
  15. DESIGN PRINCIPLES Lesson: Web scraping essentials for turning a structured

    table into a data frame in R. Ex 1: Scrape the table off the web and save as a data frame. Hide the veggies
  16. DESIGN PRINCIPLES Lesson: Web scraping essentials for turning a structured

    table into a data frame in R. Ex 1: Scrape the table off the web and save as a data frame. Ex 2: What other information do we need represented as variables to make this figure? Hide the veggies
  17. DESIGN PRINCIPLES Lesson: Web scraping essentials for turning a structured

    table into a data frame in R. Ex 1: Scrape the table off the web and save as a data frame. Ex 2: What other information do we need represented as variables to make this figure? Lesson: “Just enough” regex Hide the veggies
  18. DESIGN PRINCIPLES If you are already taking a baking class,

    which will be easier to venture on to?
  19. DESIGN PRINCIPLES If you are already taking a baking class,

    which will be easier to venture on to?
  20. bit.ly/dsbox-adsa USAGE in full to jumpstart / overhaul your teaching

    in bits & pieces to supplement your teaching
  21. datasciencebox.org I have been teaching with R for a while,

    but I want to update my teaching materials I’m new to teaching with R and need to build up my course materials This teaching slide deck I came across on Twitter is pretty cool, but I have no idea what type of course it belongs in + …