Upgrade to Pro — share decks privately, control downloads, hide ads and more …

Introduction to Data Science, case-by-case

Introduction to Data Science, case-by-case

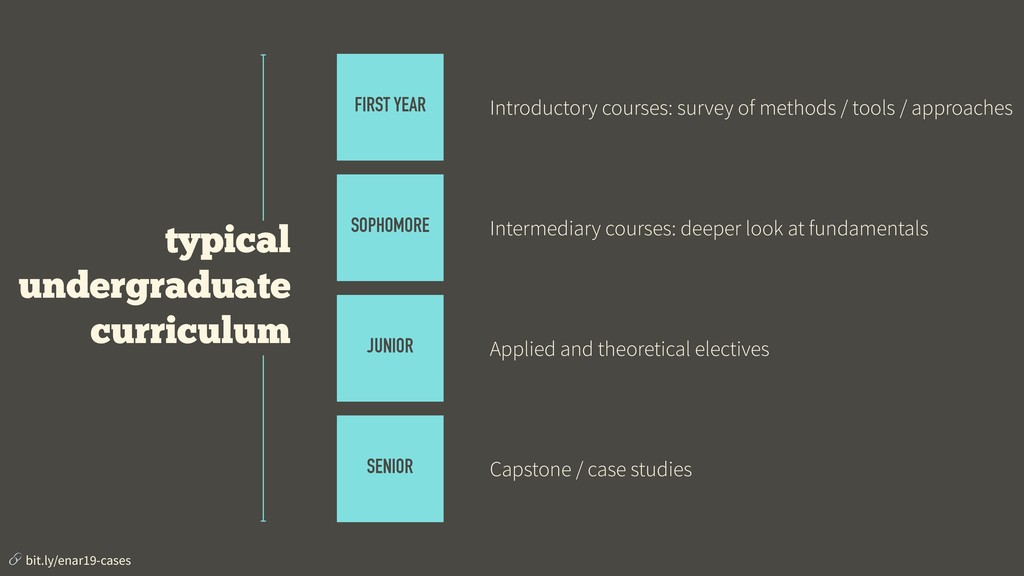
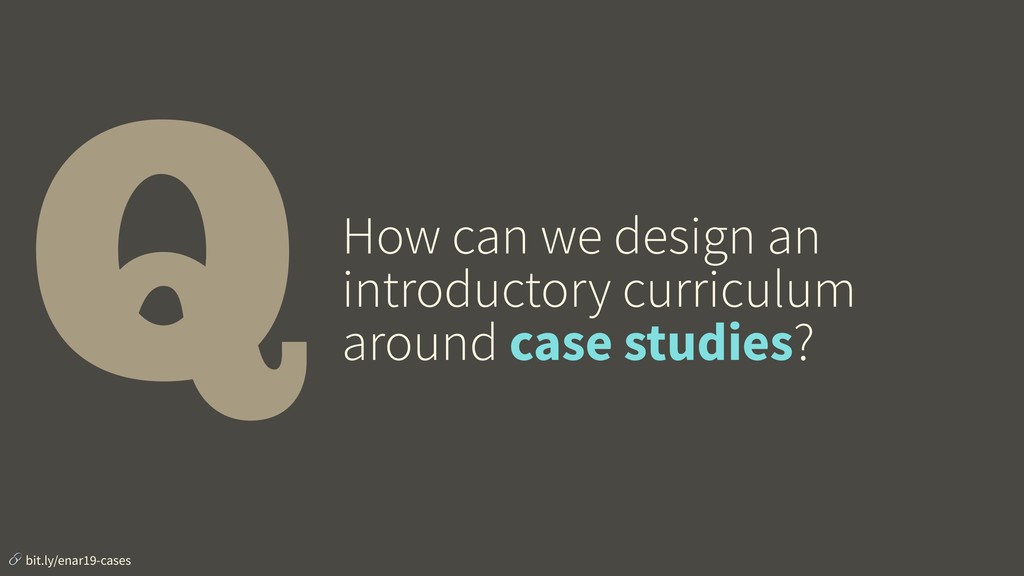
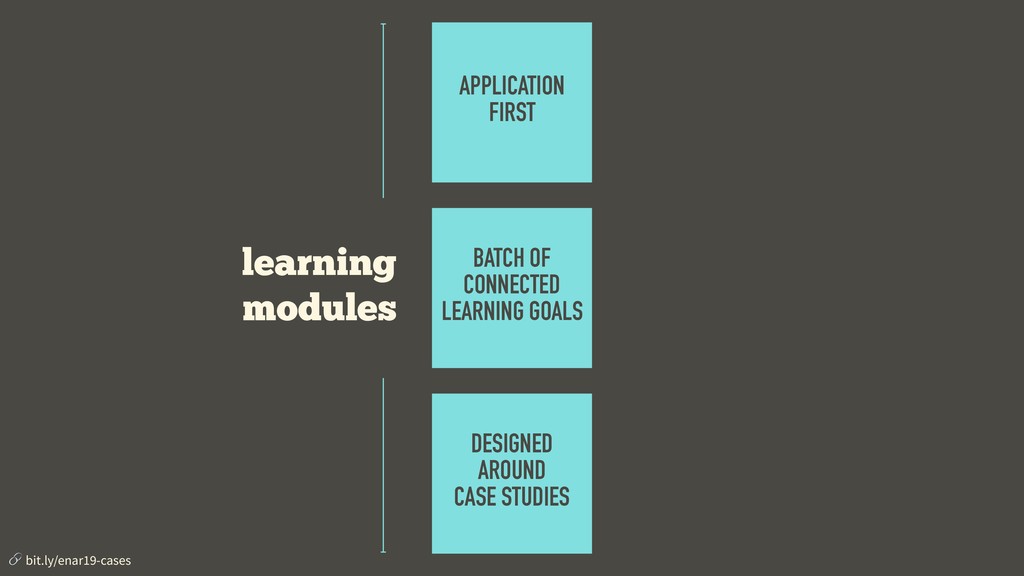
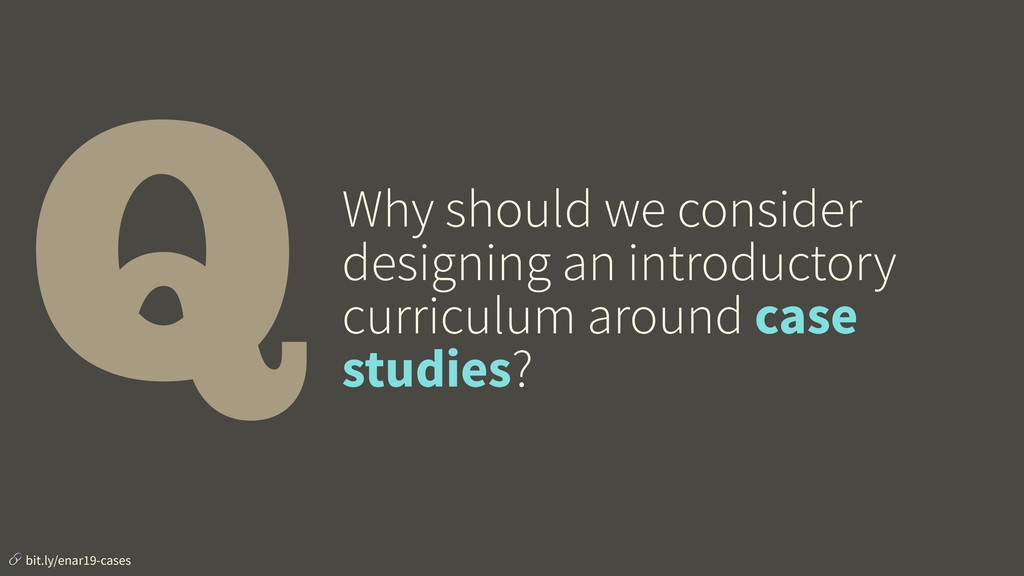
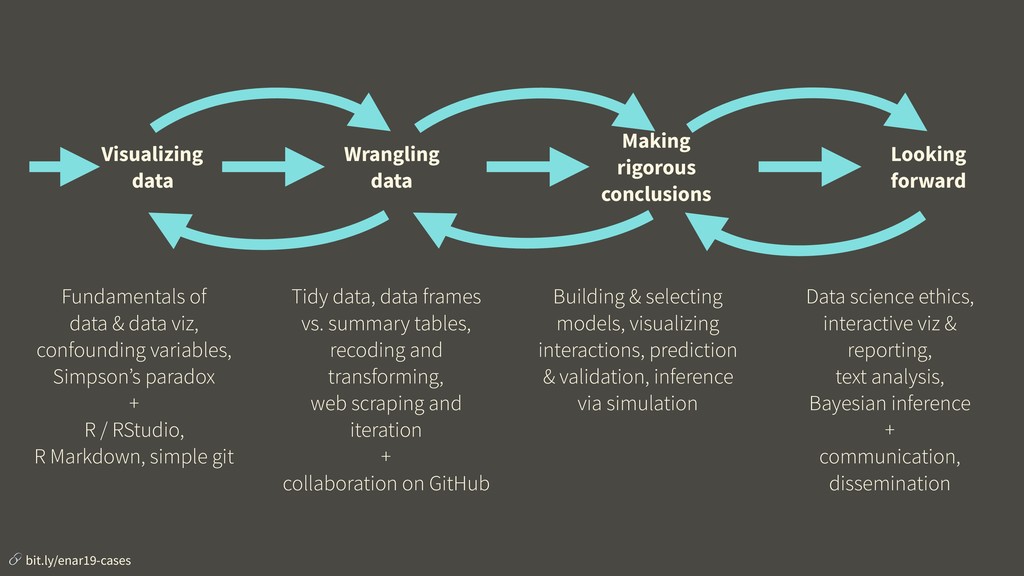
Interest in data science is surging, which means nowadays it’s pretty easy to fill the seats in an introductory data science class. But how do we effectively take the students through a challenging curriculum once they are in the class? We argue that the answer is an application first approach where the curriculum is divided into learning modules, each covering a batch of connected learning goals and designed around a case study. In this talk we present the curriculum for such a course intended for an audience of Duke University students with little to no computing or statistical background, and focuses on data wrangling, exploratory data analysis, data visualization, and effective communication. This course serves not as a first and thorough exposure to computing essentials for data science (including programming with R, reproducibility with R Markdown, and version control and collaboration with git/GitHub) but also as a gateway for the statistical science major. We will discuss in detail the course design philosophy and pedagogical considerations as well as give examples from the case studies used in the course.

Mine Cetinkaya-Rundel

March 27, 2019
Tweet

More Decks by Mine Cetinkaya-Rundel

Other Decks in Education

Transcript

  1. FIRST YEAR Introductory courses: survey of methods / tools /

    approaches SENIOR Capstone / case studies SOPHOMORE Intermediary courses: deeper look at fundamentals JUNIOR Applied and theoretical electives bit.ly/enar19-cases typical undergraduate curriculum
  2. Q Which of the following is more likely to be

    motivating for a wide range of students? bit.ly/enar19-cases
  3. option 1: ✓ Topic: Web scraping & mapping ✓ What

    will we learn about? ✓ rvest: A new package for harvesting data off the web ✓ regular expressions ✓ ggplot2’s mapping features ✓ Functions and automation bit.ly/enar19-cases
  4. students will encounter lots of new challenges along the way

    — let that happen, and then provide a solution bit.ly/enar19-cases
  5. Lesson: Web scraping essentials for turning a structured table into

    a data frame in R. Ex 1: Scrape the table off the web and save as a data frame. bit.ly/enar19-cases
  6. Lesson: Web scraping essentials for turning a structured table into

    a data frame in R. Ex 1: Scrape the table off the web and save as a data frame. Ex 2: What other information do we need represented as variables in the data to obtain the desired facets? bit.ly/enar19-cases
  7. Lesson: Web scraping essentials for turning a structured table into

    a data frame in R. Ex 1: Scrape the table off the web and save as a data frame. Ex 2: What other information do we need represented as variables in the data to obtain the desired facets? Lesson: “Just enough” string parsing and regular expressions to go from to bit.ly/enar19-cases
  8. FIND A DATASET PIN DOWN A RESEARCH QUESTION IDENTIFY METHODS

    AND TECHNIQUES PERFORM ANALYSIS WRITE REPORT / PREPARE PRESENTATION how we might expect students to approach a final project… bit.ly/enar19-cases
  9. FIND A DATASET PIN DOWN A RESEARCH QUESTION IDENTIFY METHODS

    AND TECHNIQUES PERFORM ANALYSIS WRITE REPORT / PREPARE PRESENTATION …how students might approach a final project bit.ly/enar19-cases
  10. there is no one clear answer, allow students to brainstorm

    approaches and take them through your (expert) reasoning for what might / might not work bit.ly/enar19-cases
  11. ASA DataFest is a data analysis competition where teams of

    up to five students attack a large, complex, and surprise dataset over a weekend. inspiration… bit.ly/enar19-cases
  12. introduce students to the formulation of research questions, and help

    them understand what questions can (and cannot) be answered with a given dataset bit.ly/enar19-cases
  13. Two paintings very rich in composition, of a beautiful execution,

    and whose merit is very remarkable, each 17 inches 3 lines high, 23 inches wide; the first, painted on wood, comes from the Cabinet of Madame la Comtesse de Verrue; it represents a departure for the hunt: it shows in the front a child on a white horse, a man who gives the horn to gather the dogs, a falconer and other figures nicely distributed across the width of the painting; two horses drinking from a fountain; on the right in the corner a lovely country house topped by a terrace, on which people are at the table, others who play instruments; trees and fabriques pleasantly enrich the background. bit.ly/enar19-cases
  14. data expeditions PAIR OF GRAD STUDENTS, WORK WITH COURSE INSTRUCTOR

    TO FORMULATE A QUESTION, + A PATHWAY THROUGH A DATASET TO EXPLORE THE QUESTION ELEMENT OF AN UNDERGRADUATE COURSE THAT INTRODUCES STUDENTS TO EXPLORATORY DATA ANALYSIS GRADUATE STUDENT PARTICIPANTS RECEIVE A TRAVEL GRANT bit.ly/enar19-cases
  15. Visualizing data Wrangling data Making rigorous conclusions Looking forward Fundamentals

    of data & data viz, confounding variables, Simpson’s paradox + R / RStudio, R Markdown, simple git Tidy data, data frames vs. summary tables, recoding and transforming, web scraping and iteration + collaboration on GitHub Building & selecting models, visualizing interactions, prediction & validation, inference via simulation Data science ethics, interactive viz & reporting, text analysis, Bayesian inference + communication, dissemination bit.ly/enar19-cases