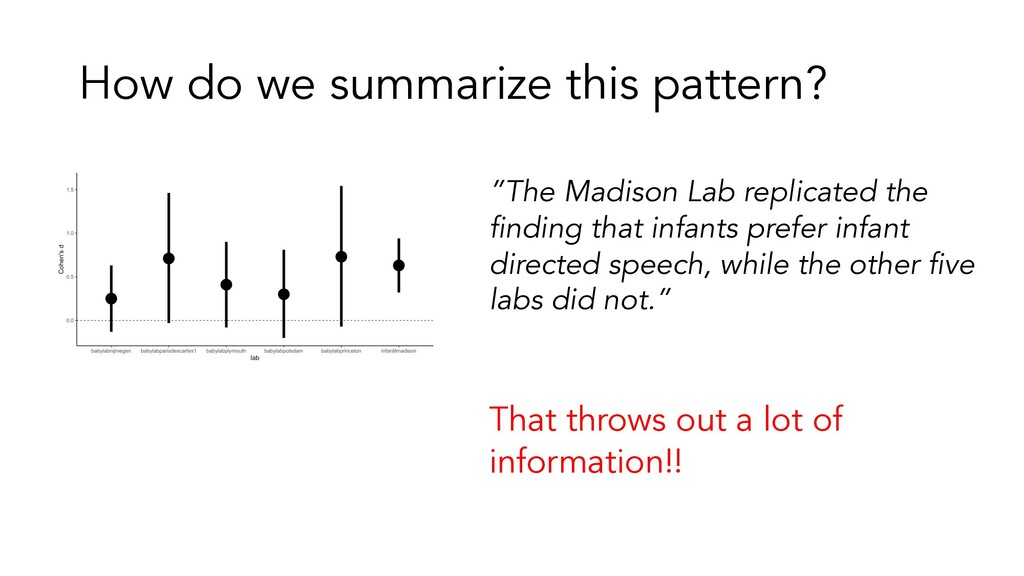
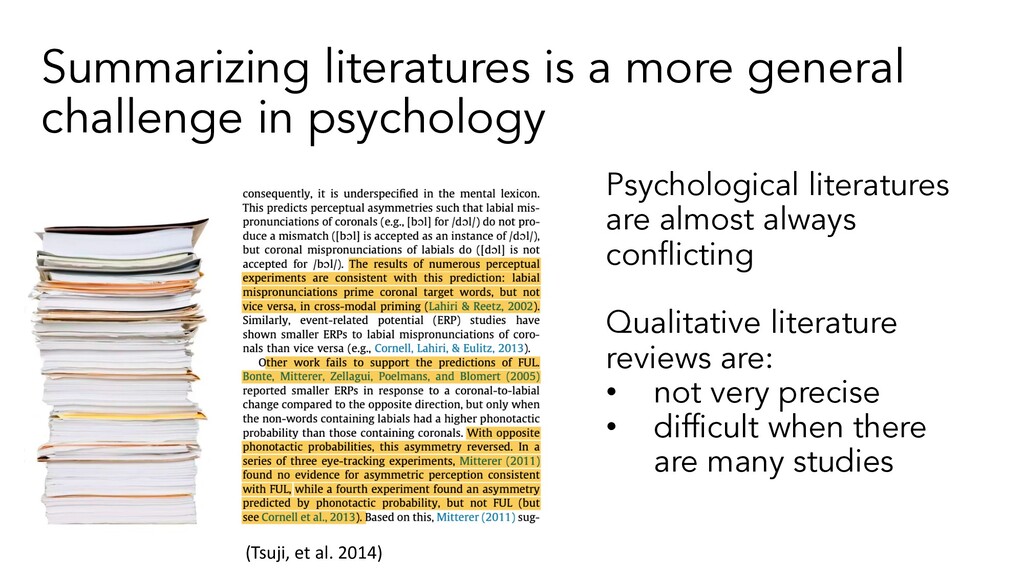
literatures are almost always conflicting Qualitative literature reviews are: • not very precise • difficult when there are many studies (Tsuji, et al. 2014)
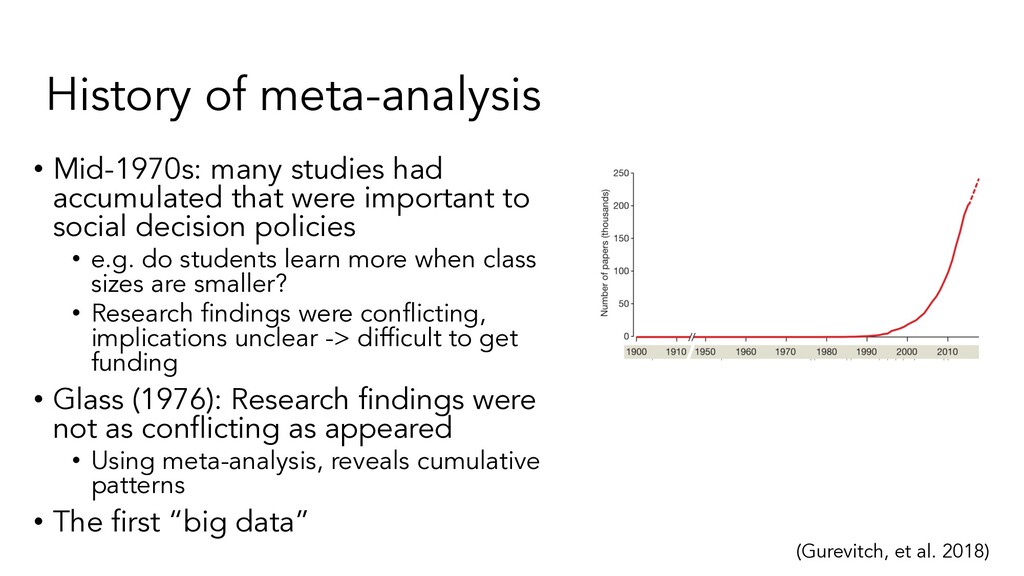
were important to social decision policies • e.g. do students learn more when class sizes are smaller? • Research findings were conflicting, implications unclear -> difficult to get funding • Glass (1976): Research findings were not as conflicting as appeared • Using meta-analysis, reveals cumulative patterns • The first “big data” (Gurevitch, et al. 2018)
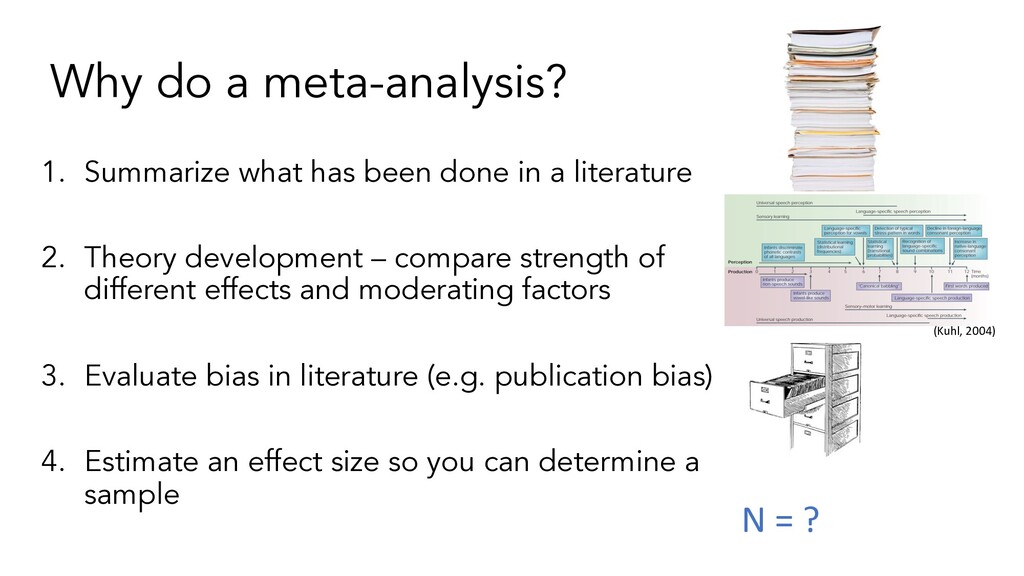
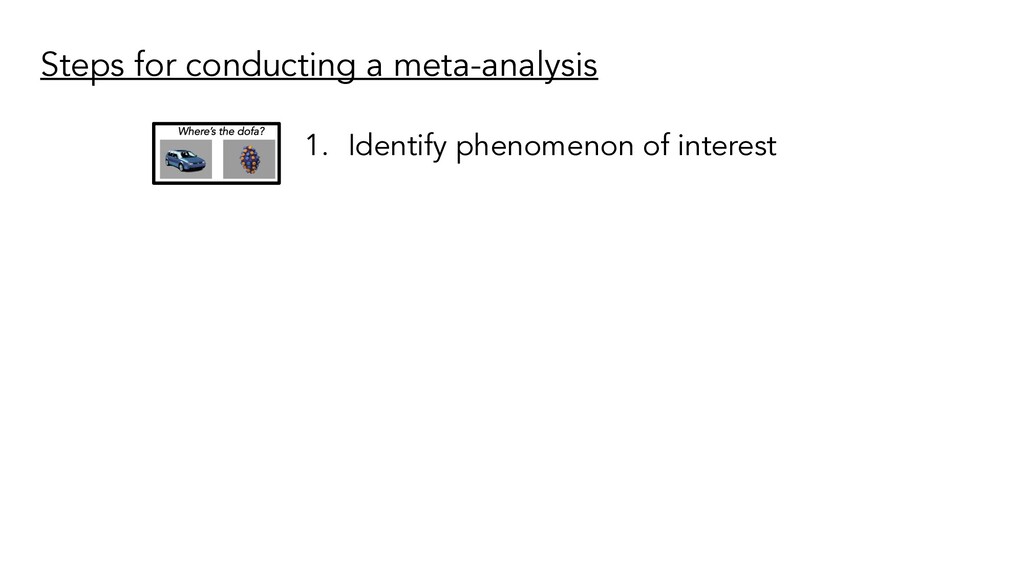
in a literature 2. Theory development – compare strength of different effects and moderating factors 3. Evaluate bias in literature (e.g. publication bias) 4. Estimate an effect size so you can determine a sample N = ? (Kuhl, 2004)
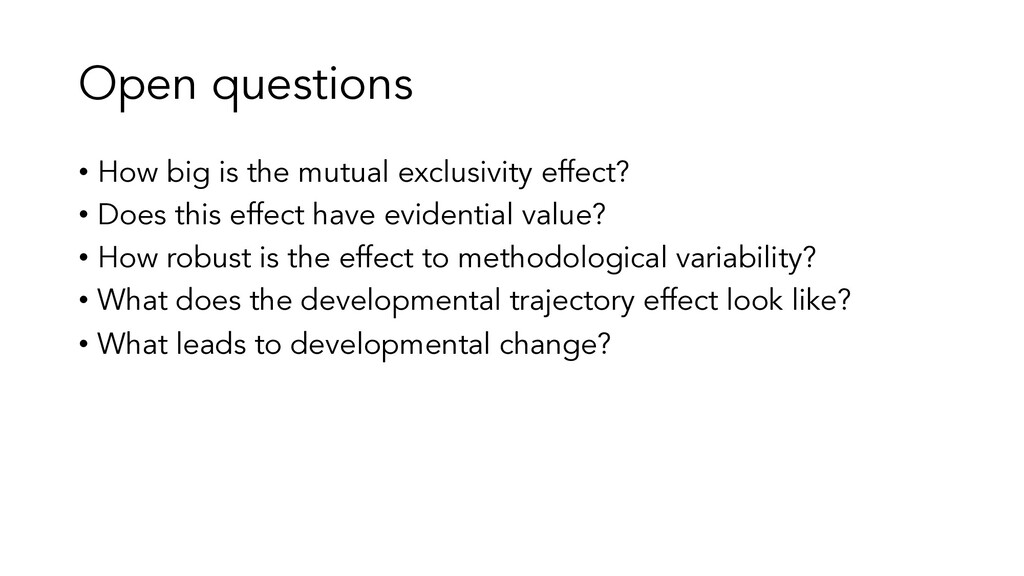
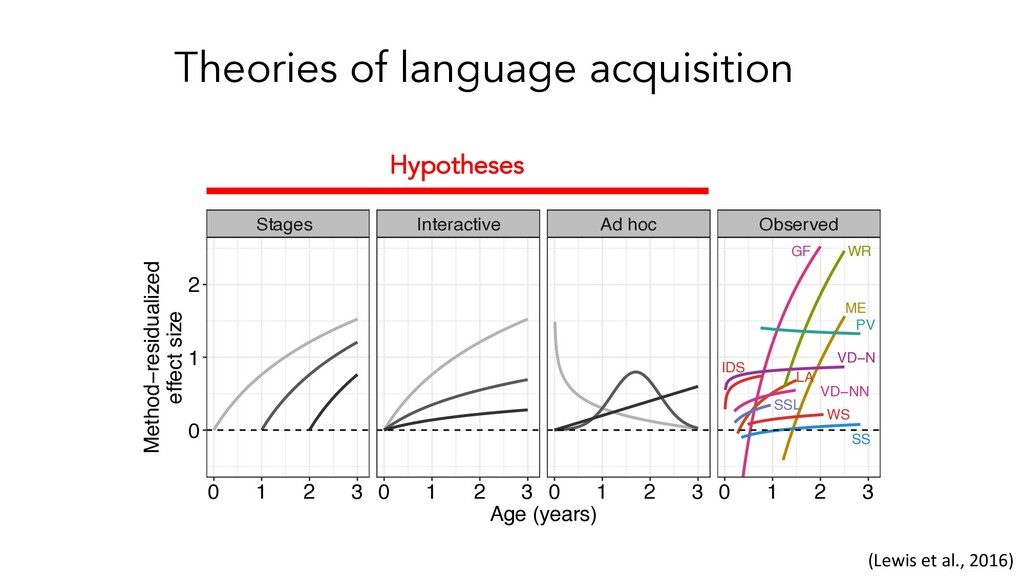
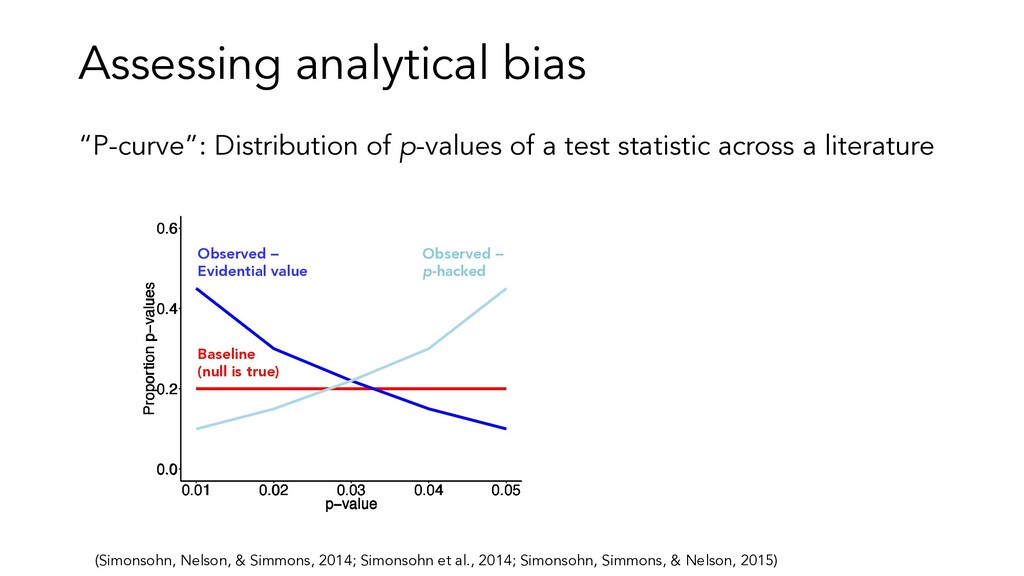
• Does this effect have evidential value? • How robust is the effect to methodological variability? • What does the developmental trajectory effect look like? • What leads to developmental change?
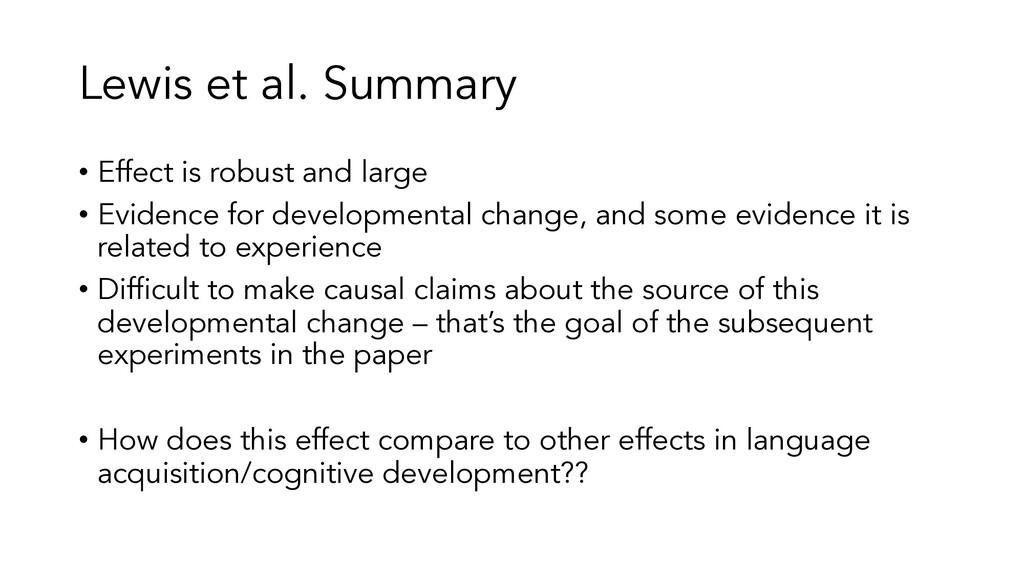
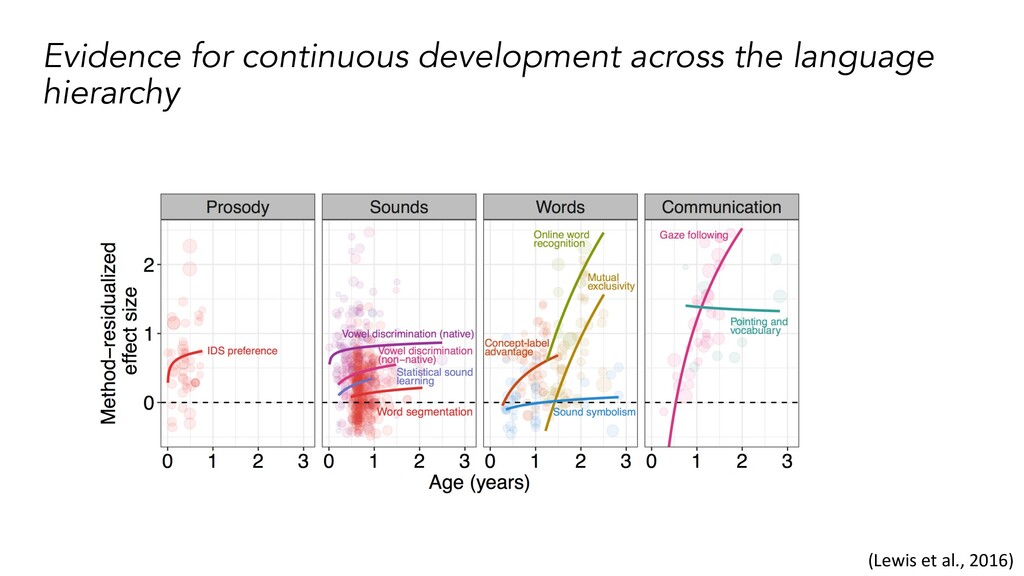
• Evidence for developmental change, and some evidence it is related to experience • Difficult to make causal claims about the source of this developmental change – that’s the goal of the subsequent experiments in the paper • How does this effect compare to other effects in language acquisition/cognitive development??
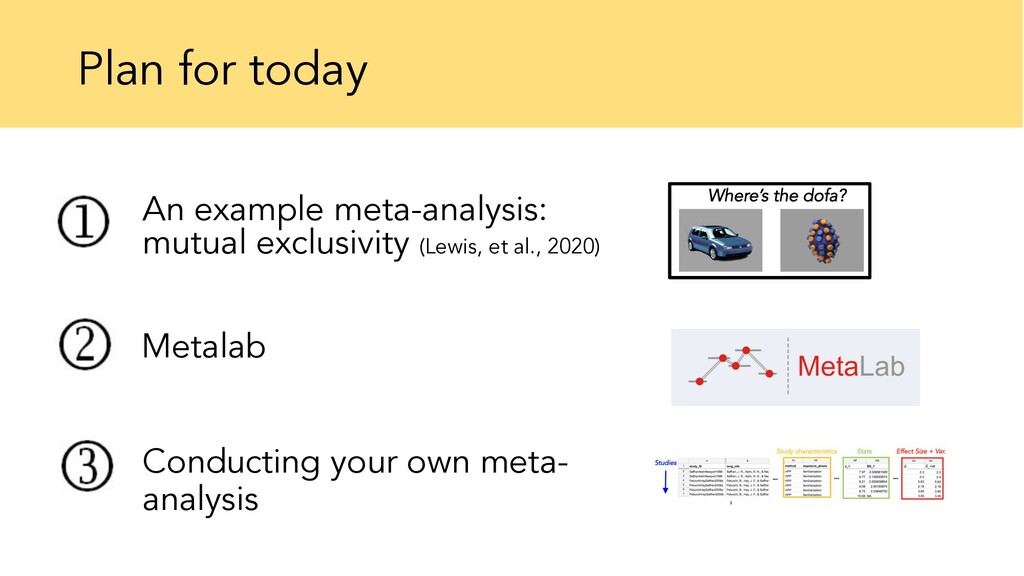
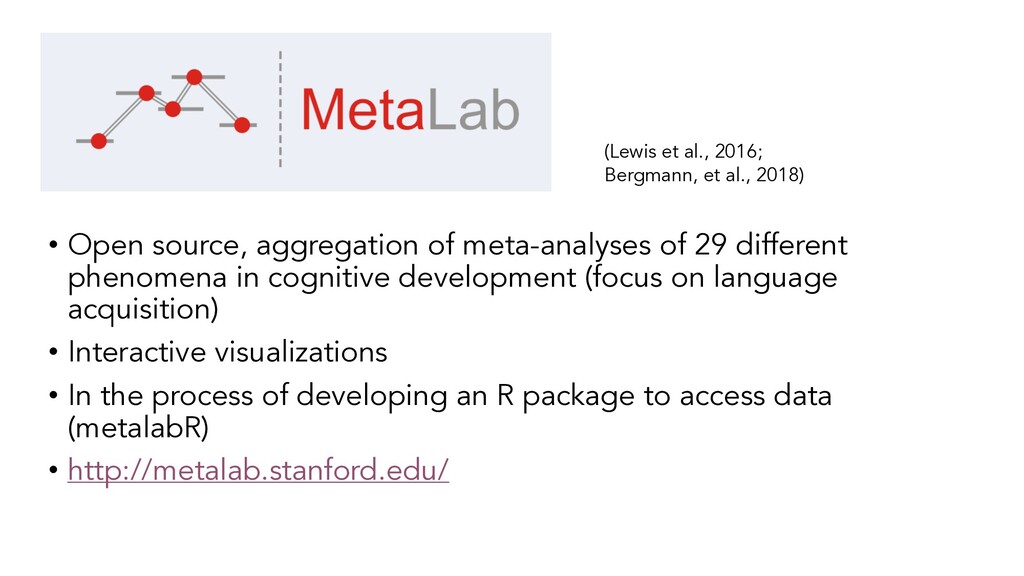
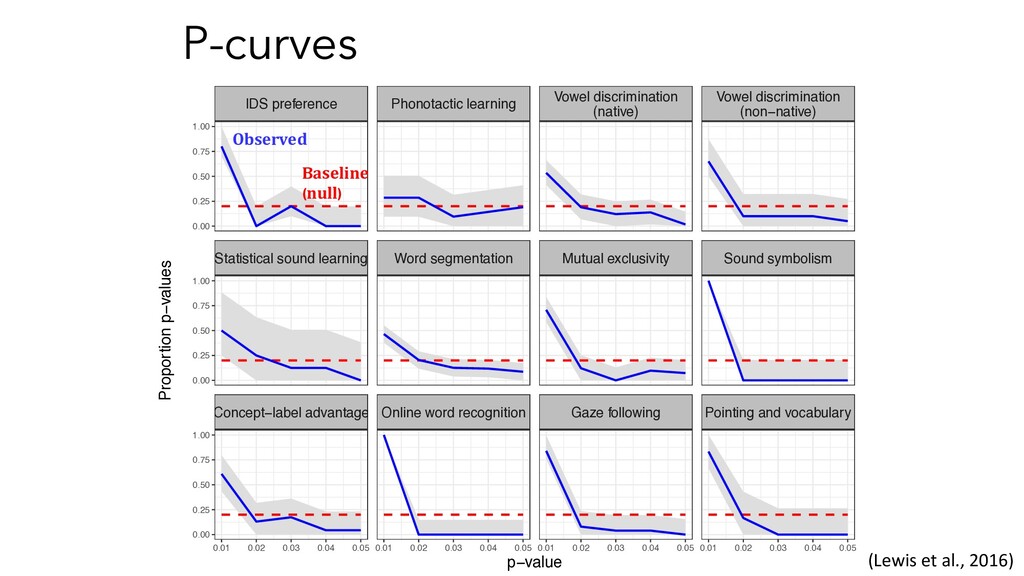
in cognitive development (focus on language acquisition) • Interactive visualizations • In the process of developing an R package to access data (metalabR) • http://metalab.stanford.edu/ (Lewis et al., 2016; Bergmann, et al., 2018)
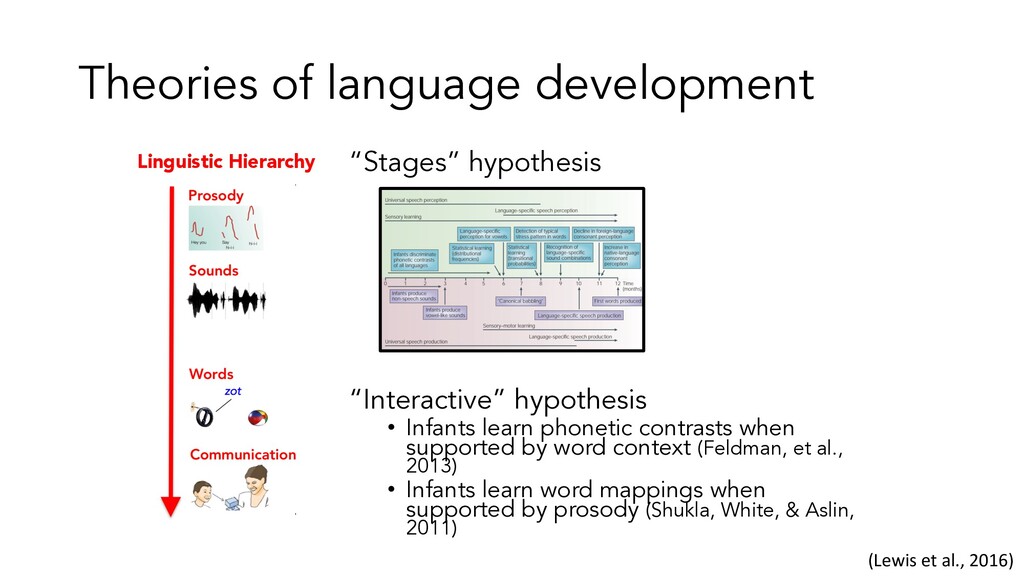
learn phonetic contrasts when supported by word context (Feldman, et al., 2013) • Infants learn word mappings when supported by prosody (Shukla, White, & Aslin, 2011) Linguistic Hierarchy (Lewis et al., 2016)
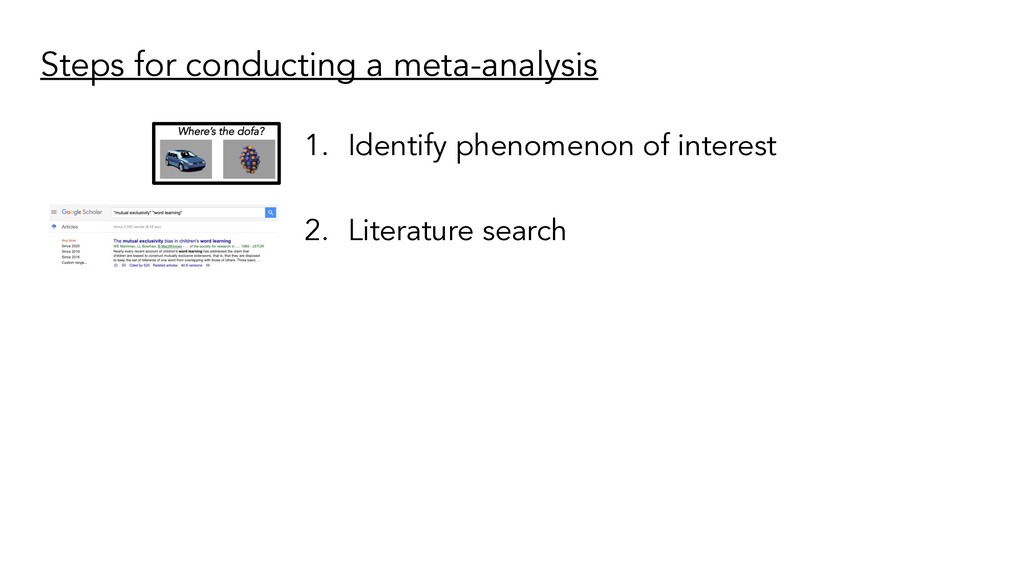
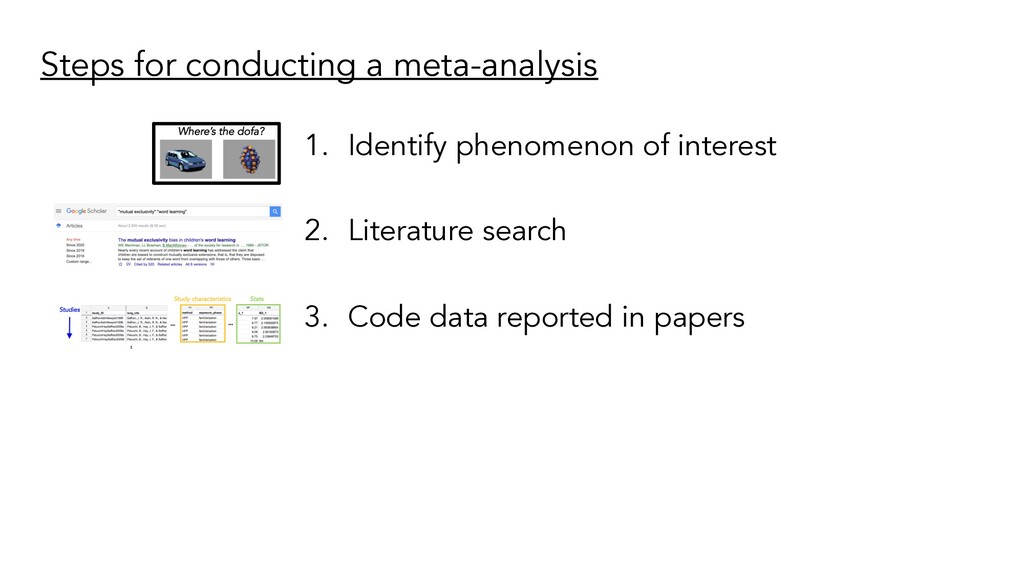
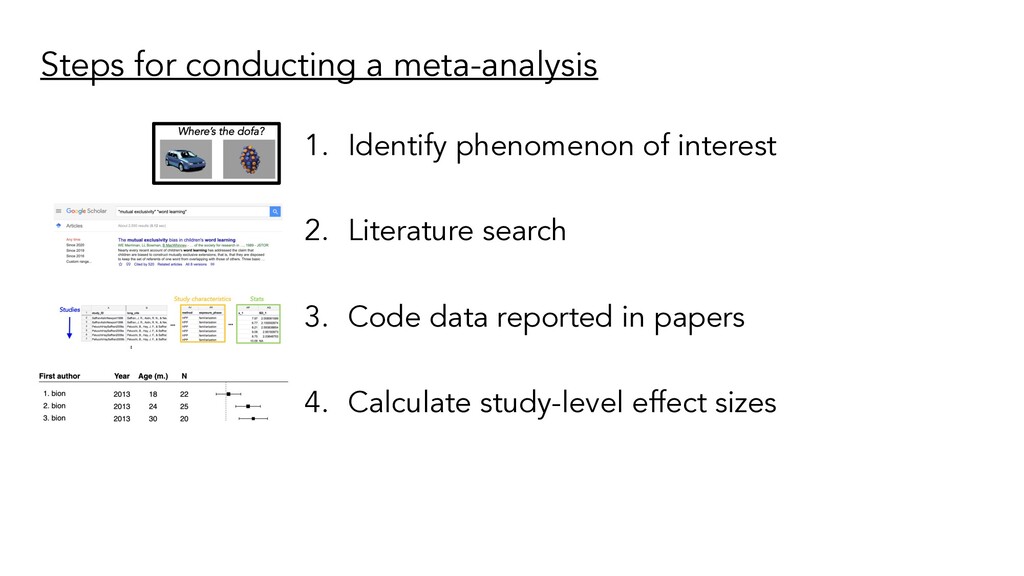
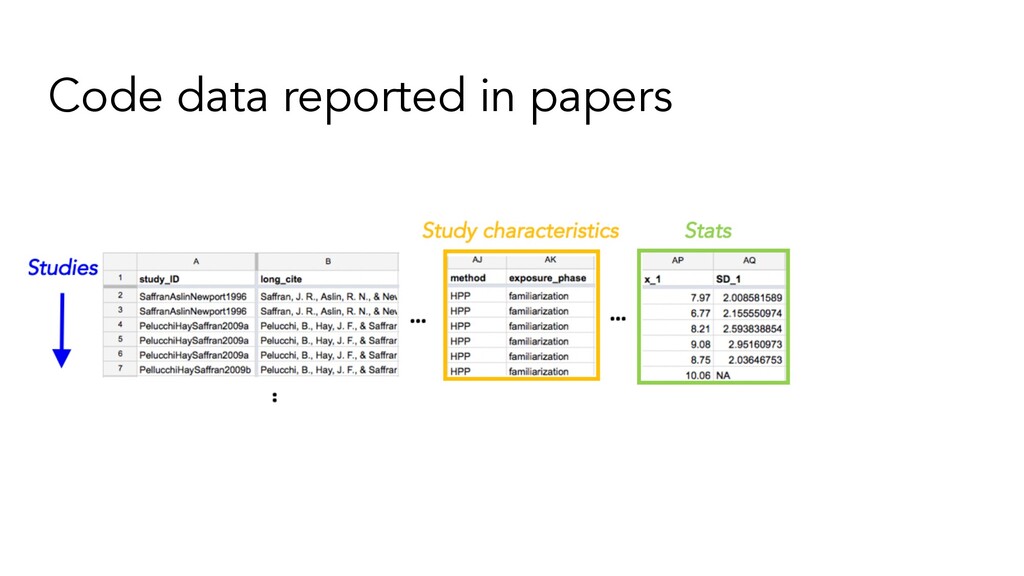
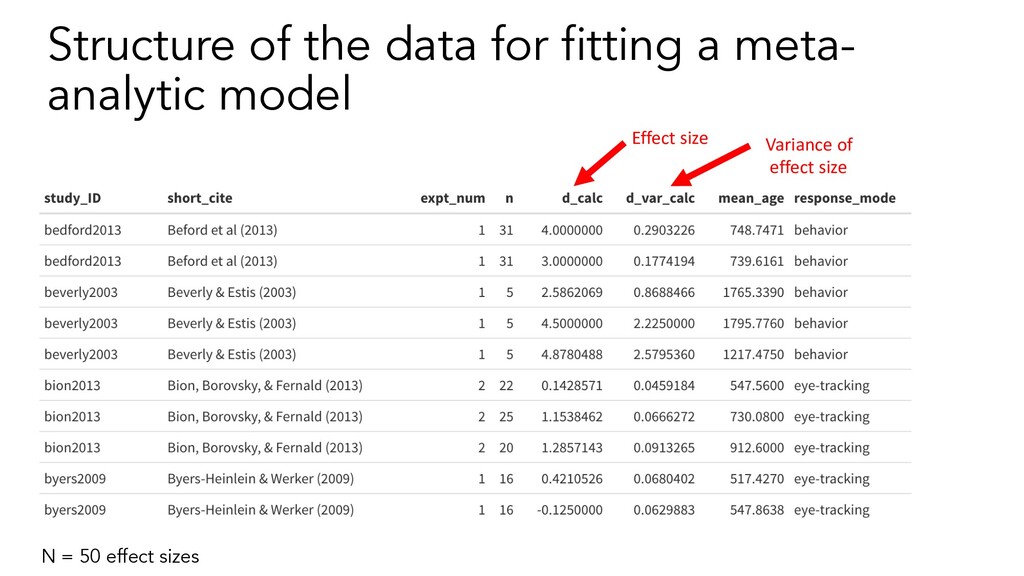
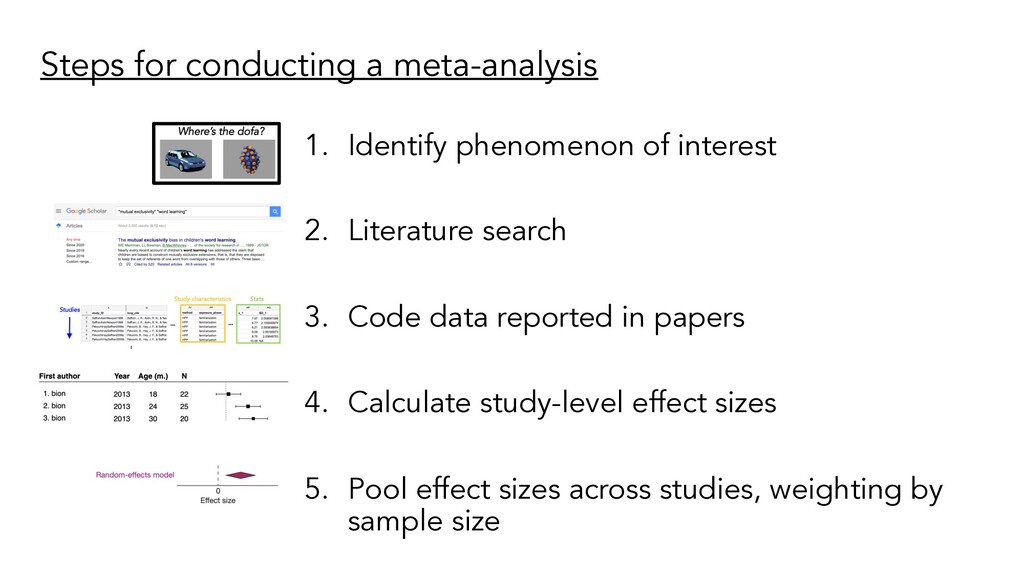
2. Literature search 3. Code data reported in papers 4. Calculate study-level effect sizes 5. Pool effect sizes across studies, weighting by sample size
broad -> comparing apples and oranges • Too narrow -> doesn’t answer question you care about, not many studies • Can be defined by a paradigm (as in mutual exclusivity) • Can start with seminal study • How many studies do you need?? • Answer: at least two • Aggregated evidence is more precise than individual studies • Within-paper meta-analyses sometimes contain only a few (~5 studies; Lewis & Frank, 2016)
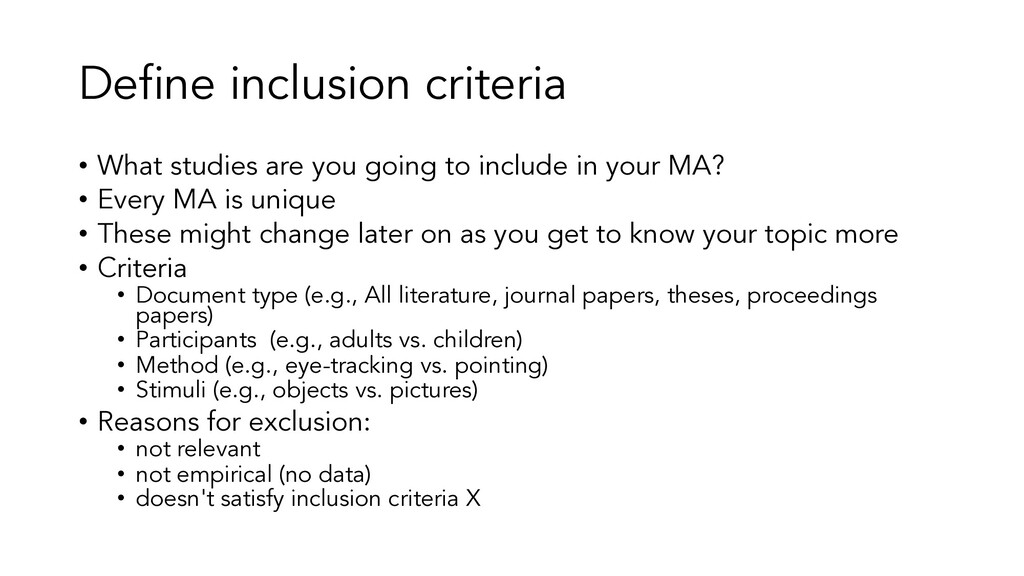
include in your MA? • Every MA is unique • These might change later on as you get to know your topic more • Criteria • Document type (e.g., All literature, journal papers, theses, proceedings papers) • Participants (e.g., adults vs. children) • Method (e.g., eye-tracking vs. pointing) • Stimuli (e.g., objects vs. pictures) • Reasons for exclusion: • not relevant • not empirical (no data) • doesn't satisfy inclusion criteria X
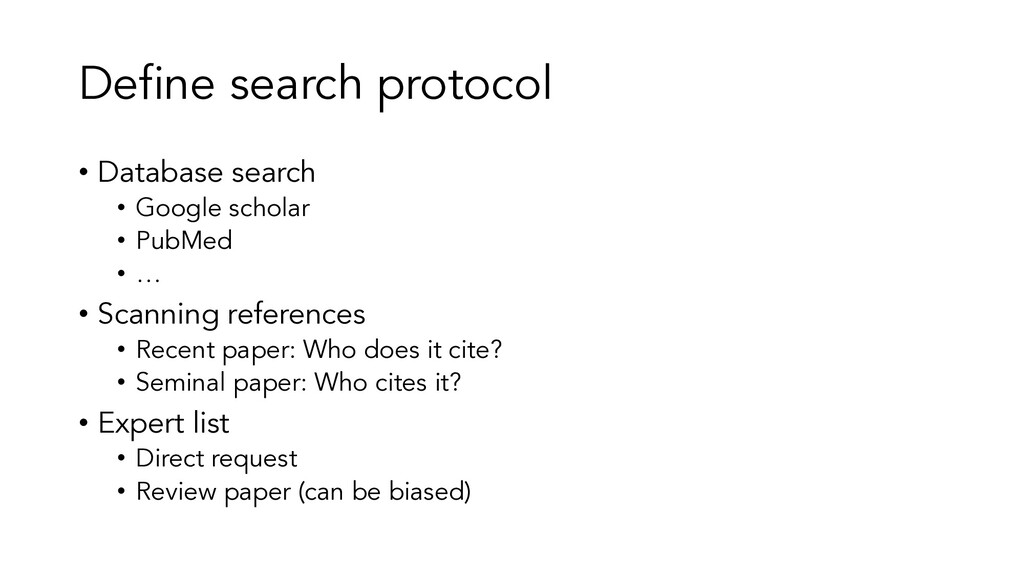
PubMed • … • Scanning references • Recent paper: Who does it cite? • Seminal paper: Who cites it? • Expert list • Direct request • Review paper (can be biased)
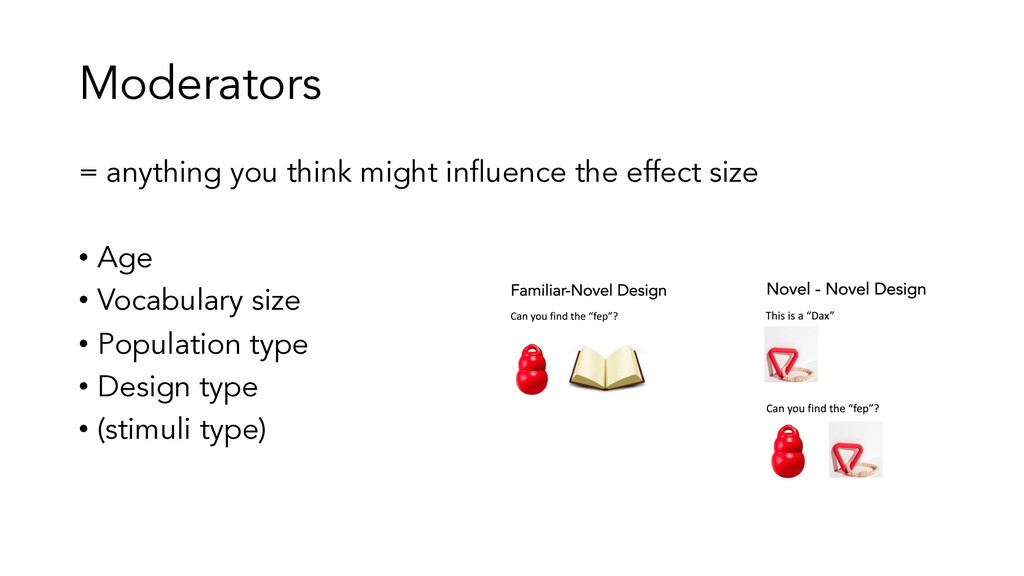
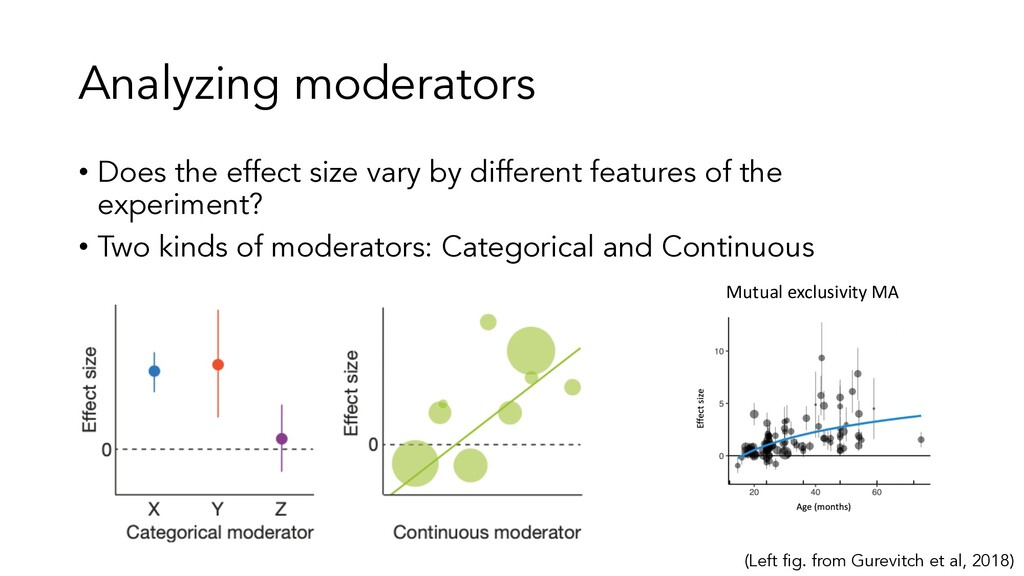
size (continuous or discrete) • Can be of theoretical or methodological interest • Specific to each MA (e.g., age, design, etc.) • Make a codebook for how you will enter each moderator
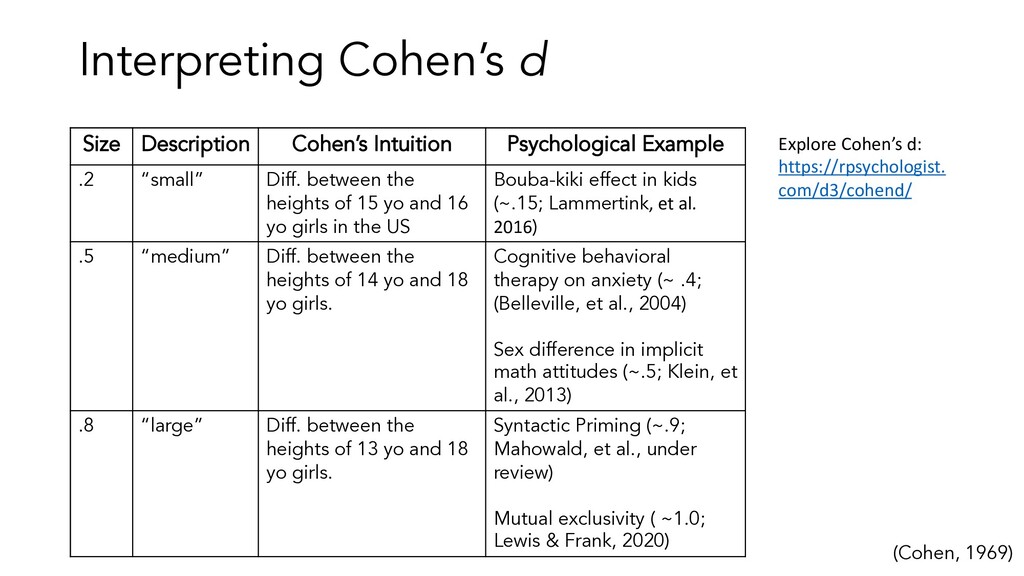
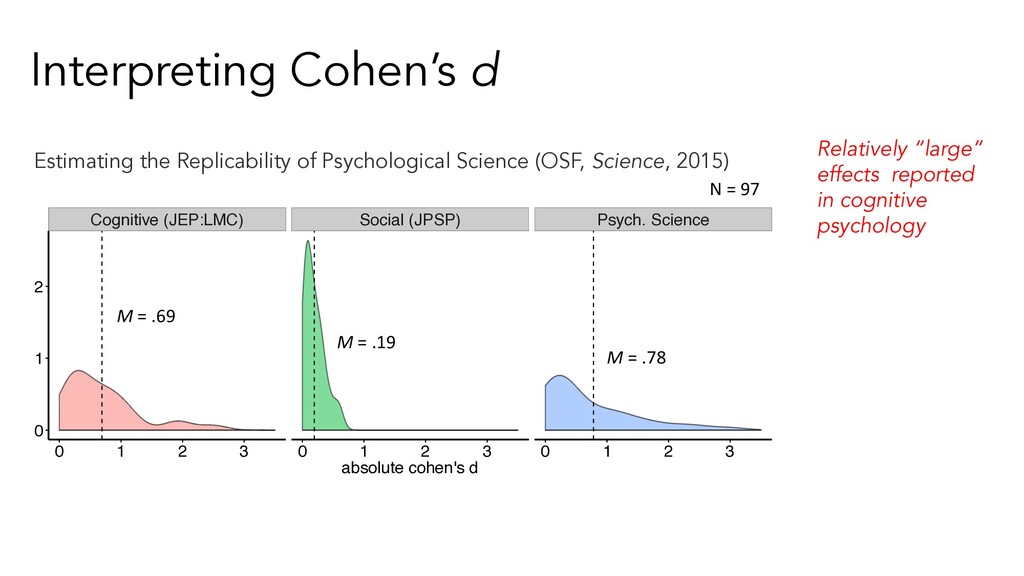
“small” Diff. between the heights of 15 yo and 16 yo girls in the US Bouba-kiki effect in kids (~.15; Lammertink, et al. 2016) .5 “medium” Diff. between the heights of 14 yo and 18 yo girls. Cognitive behavioral therapy on anxiety (~ .4; (Belleville, et al., 2004) Sex difference in implicit math attitudes (~.5; Klein, et al., 2013) .8 “large” Diff. between the heights of 13 yo and 18 yo girls. Syntactic Priming (~.9; Mahowald, et al., under review) Mutual exclusivity ( ~1.0; Lewis & Frank, 2020) (Cohen, 1969) Explore Cohen’s d: https://rpsychologist. com/d3/cohend/
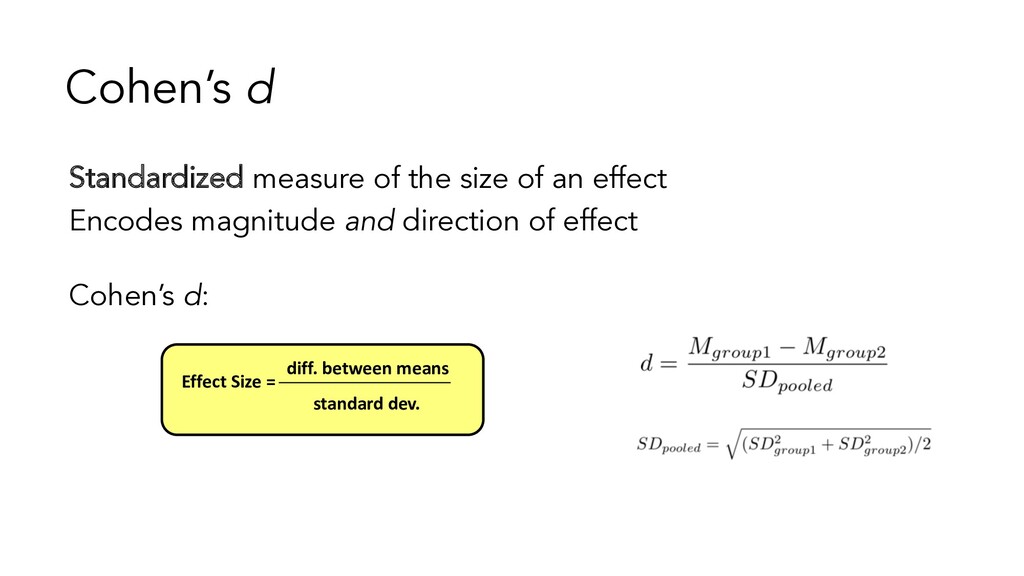
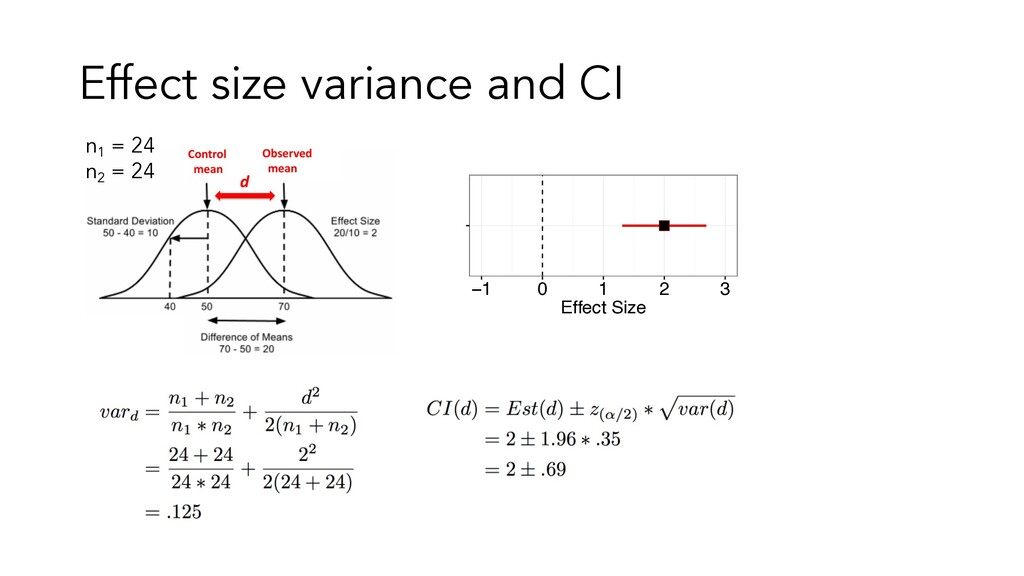
• Appropriate effect size measure depends on aspect of design (e.g., within vs. between subject), and types of variables (e.g. qualitative vs. quantitative). • For any statistical test you conduct can compute effect size (in principle) • the difference is between groups (t-test, d) • the relationship between variables (correlation, r) • the amount of variance accounted for by a factor (ANOVA, regression, f) • … • Can convert between ES metrics
2. Literature search 3. Code data reported in papers 4. Calculate study-level effect sizes 5. Pool effect sizes across studies, weighting by sample size
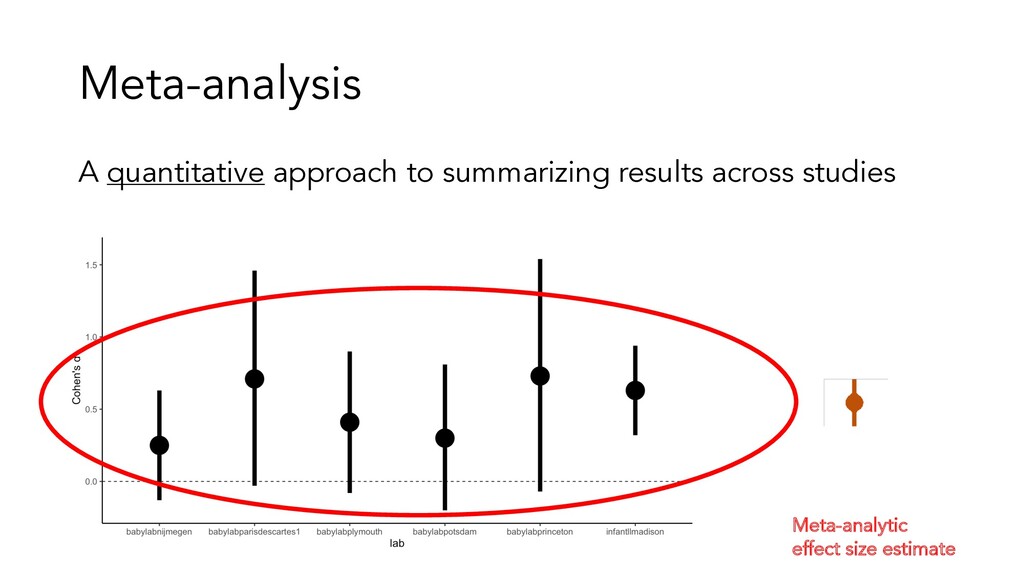
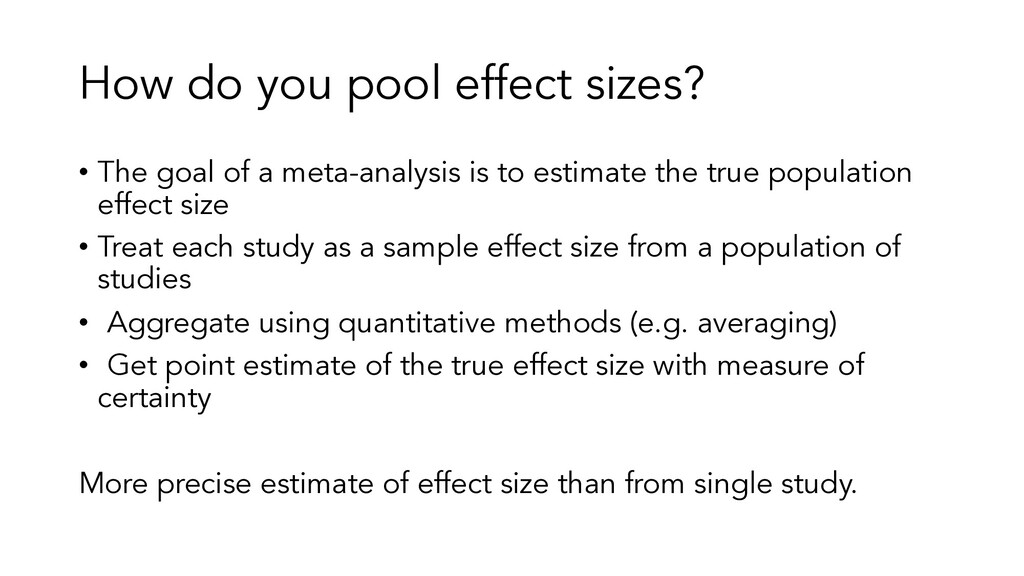
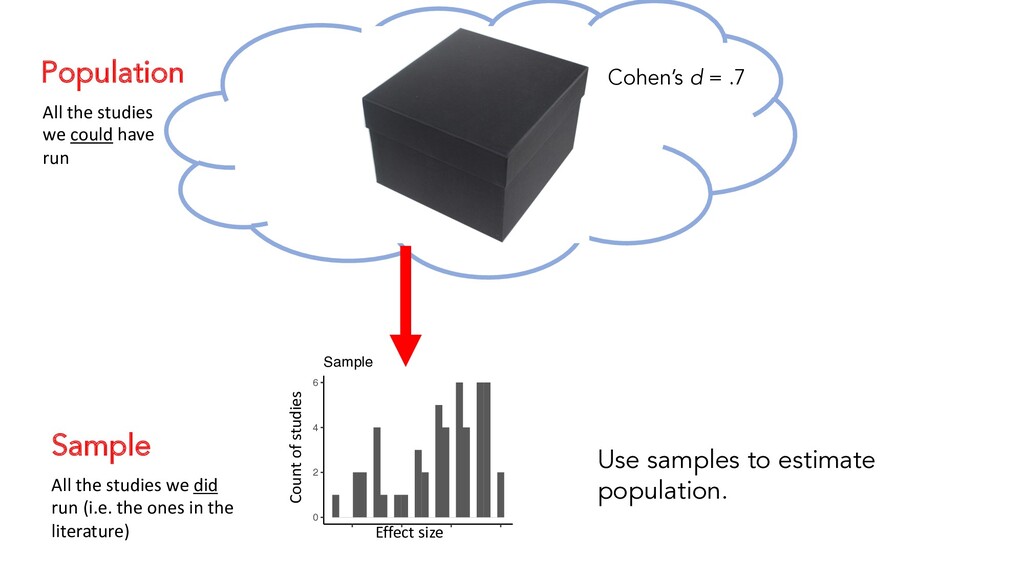
a meta-analysis is to estimate the true population effect size • Treat each study as a sample effect size from a population of studies • Aggregate using quantitative methods (e.g. averaging) • Get point estimate of the true effect size with measure of certainty More precise estimate of effect size than from single study.
ones in the literature) 0 2 4 6 0.4 0.6 0.8 1.0 Prop. Right count Sample Effect size Count of studies 0 25000 50000 75000 100000 0.0 0.4 0.8 Prop. Right count Population Effect size Count of studies All the studies we could have run Use samples to estimate population. Cohen’s d = .7
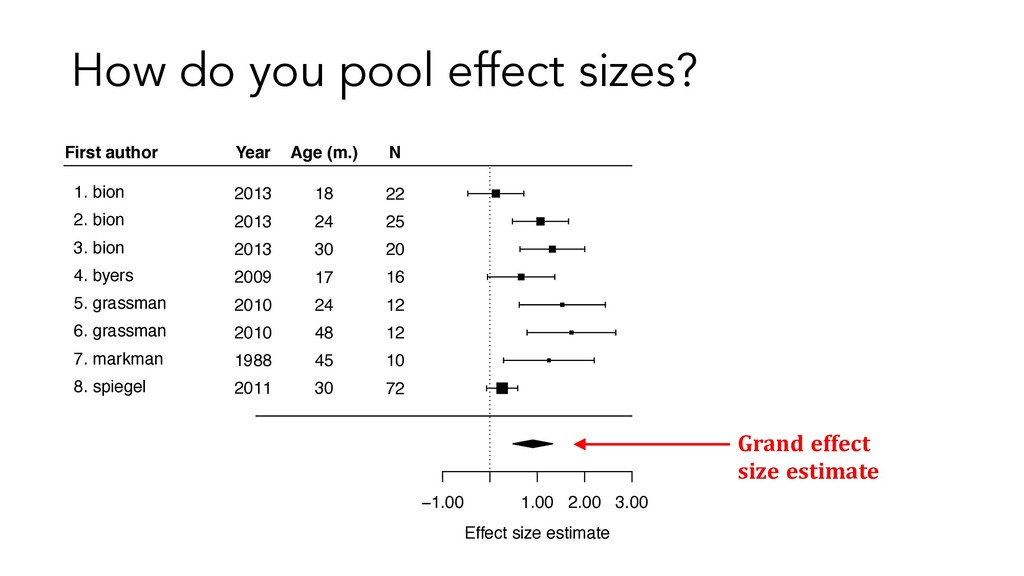
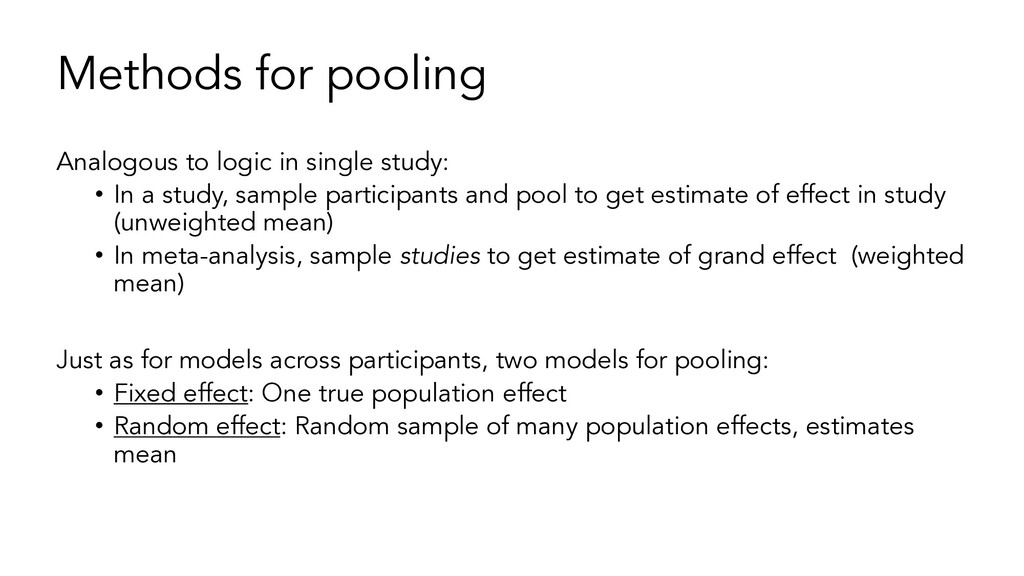
In a study, sample participants and pool to get estimate of effect in study (unweighted mean) • In meta-analysis, sample studies to get estimate of grand effect (weighted mean) Just as for models across participants, two models for pooling: • Fixed effect: One true population effect • Random effect: Random sample of many population effects, estimates mean
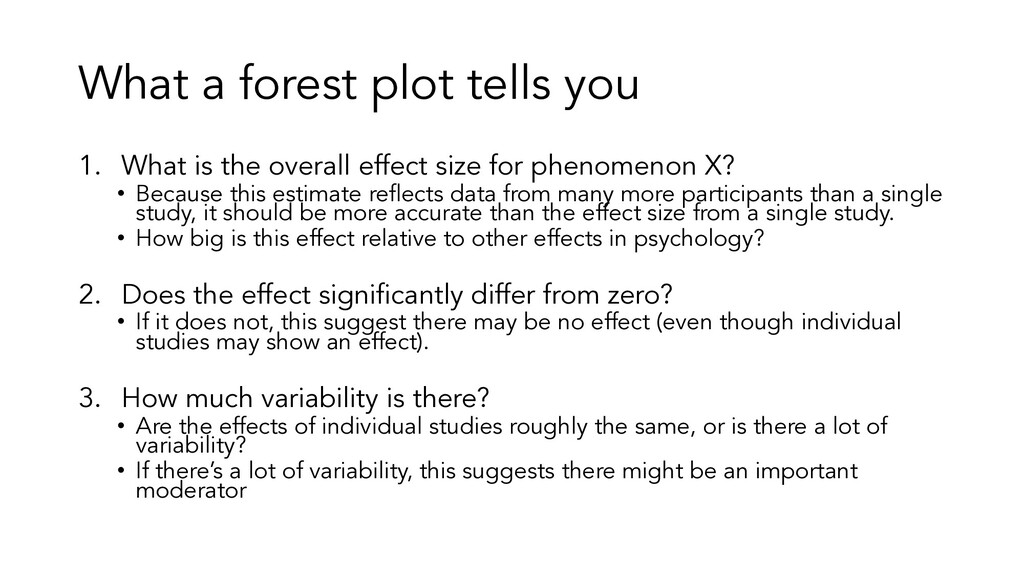
overall effect size for phenomenon X? • Because this estimate reflects data from many more participants than a single study, it should be more accurate than the effect size from a single study. • How big is this effect relative to other effects in psychology? 2. Does the effect significantly differ from zero? • If it does not, this suggest there may be no effect (even though individual studies may show an effect). 3. How much variability is there? • Are the effects of individual studies roughly the same, or is there a lot of variability? • If there’s a lot of variability, this suggests there might be an important moderator
due to sample size – need to distinguish this from bias 0.00 0.25 0.50 0.75 1.00 0.4 0.6 0.8 1.0 chance d x x Study 1 Study 2 x Study 3 N = 100 0.4 0.6 0.8 1.0 N = 12
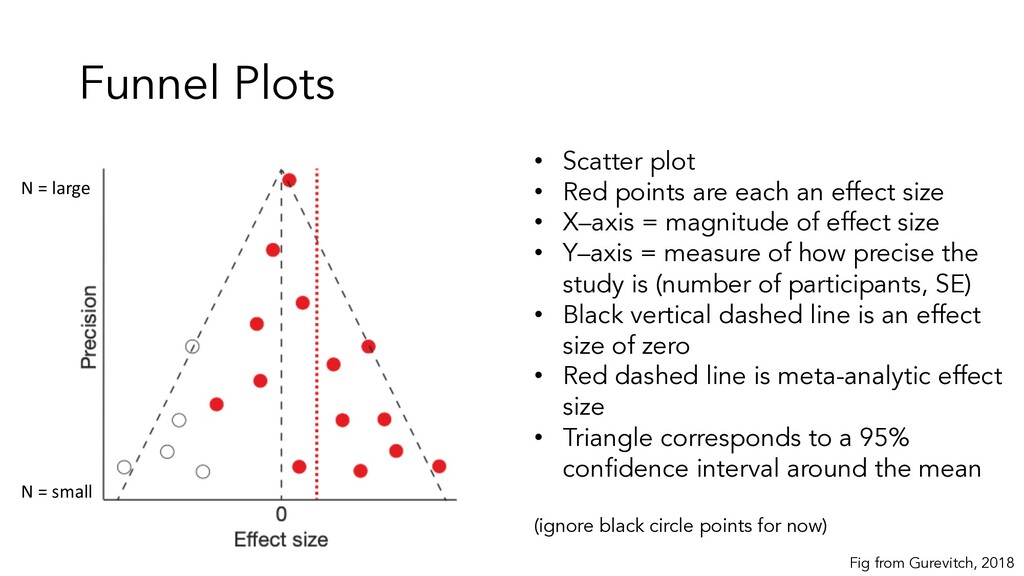
an effect size • X–axis = magnitude of effect size • Y–axis = measure of how precise the study is (number of participants, SE) • Black vertical dashed line is an effect size of zero • Red dashed line is meta-analytic effect size • Triangle corresponds to a 95% confidence interval around the mean (ignore black circle points for now) Fig from Gurevitch, 2018 N = large N = small
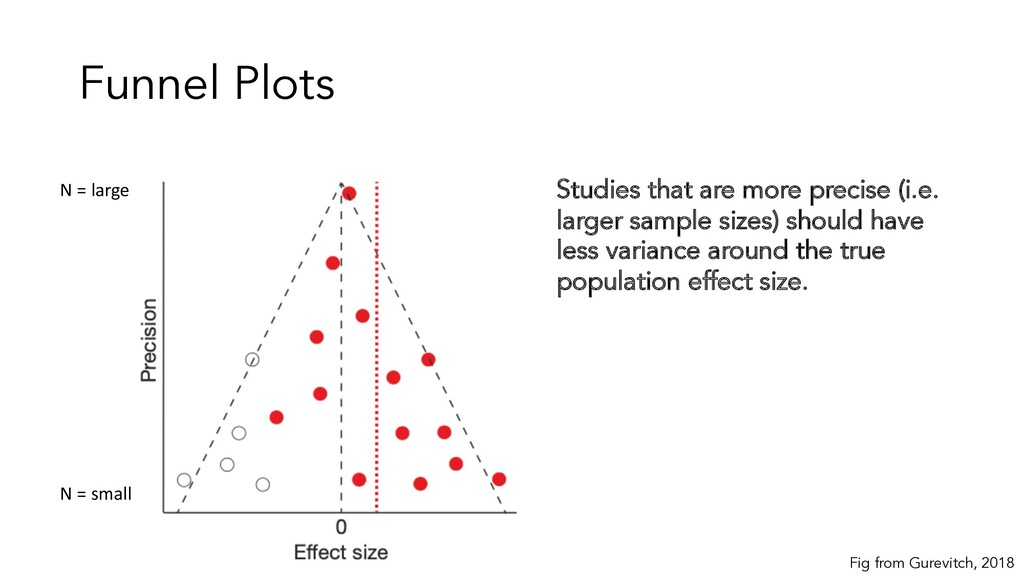
then studies will deviate from mean in either direction (i.e. be symmetrical) If a field of research systematically ignores a certain direction, then this plot can be asymmetrical. If researchers are not publishing studies that have non-significant ES, we should expect a gap in the lower left hand corner Fig from Gurevitch, 2018 N = large N = small
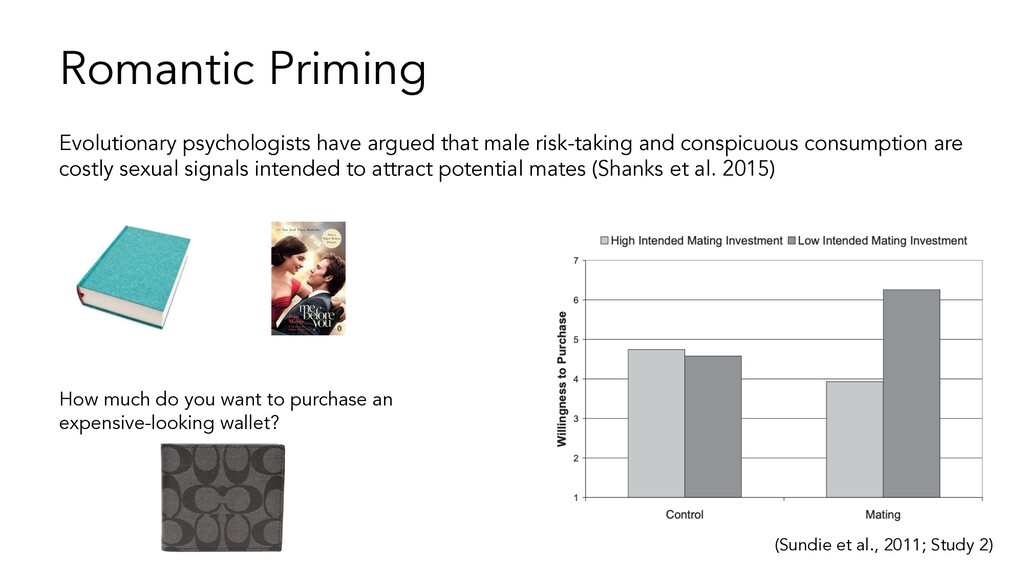
do you want to purchase an expensive-looking wallet? Evolutionary psychologists have argued that male risk-taking and conspicuous consumption are costly sexual signals intended to attract potential mates (Shanks et al. 2015)
2. Literature search 3. Code data reported in papers 4. Calculate study-level effect sizes 5. Pool effect sizes across studies, weighting by sample size
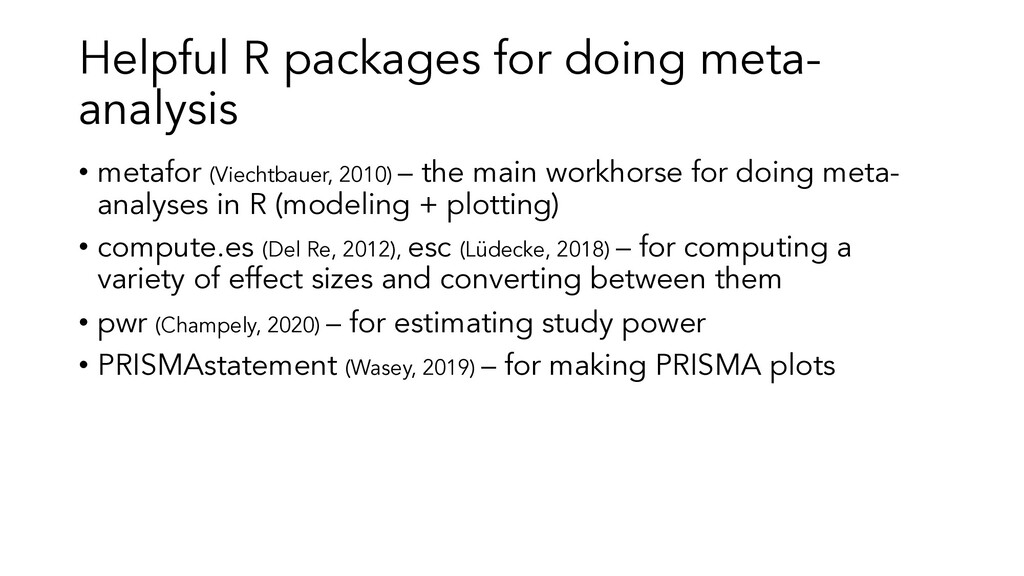
2010) – the main workhorse for doing meta- analyses in R (modeling + plotting) • compute.es (Del Re, 2012), esc (Lüdecke, 2018) – for computing a variety of effect sizes and converting between them • pwr (Champely, 2020) – for estimating study power • PRISMAstatement (Wasey, 2019) – for making PRISMA plots
existing evidence • Assess the evidential value of a literature, the strength of an effect, and moderating influences • Can be used both within a paper and across papers • Great way to start a new project • Reproducibility is important - there are lots of great tools in R for doing MAs • If you’re thinking of doing an MA, I’d be happy to chat with you about it!