Mellon University 23 April 2020 Language as a window into human minds, SFI conference Distributional statistics reflect human knowledge, but do they also shape it?
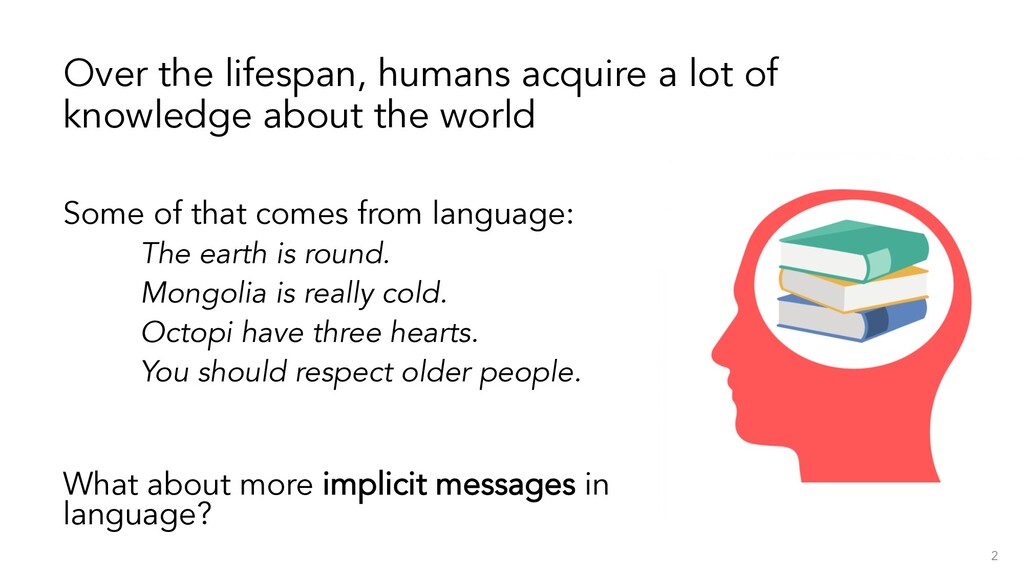
the world Some of that comes from language: The earth is round. Mongolia is really cold. Octopi have three hearts. You should respect older people. What about more implicit messages in language? 2
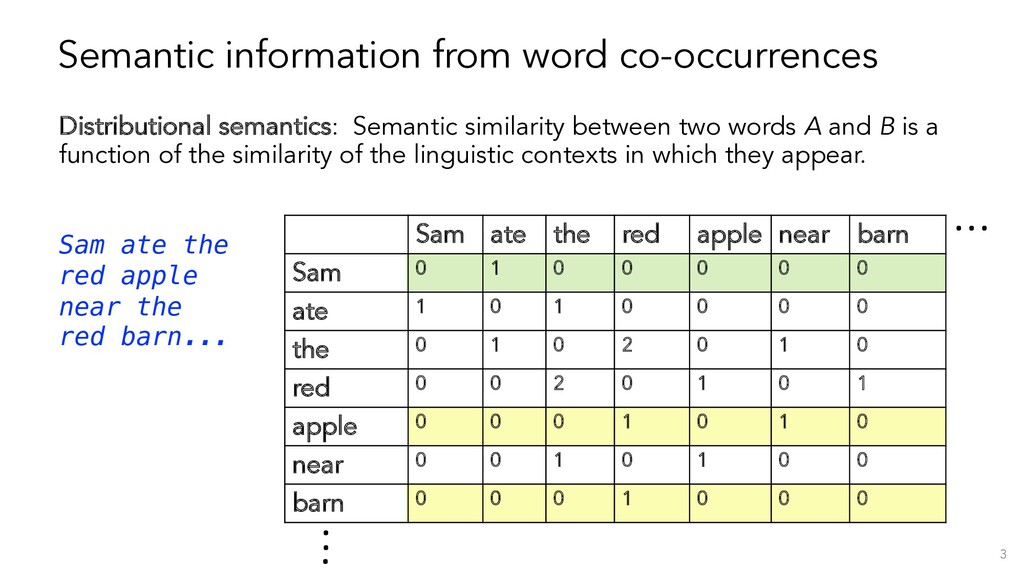
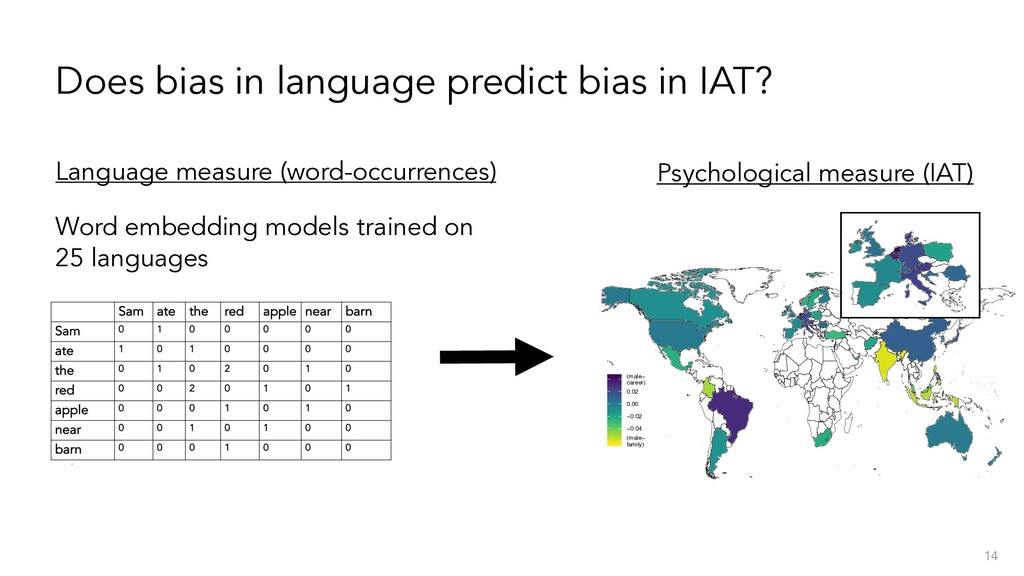
two words A and B is a function of the similarity of the linguistic contexts in which they appear. Sam ate the red apple near the red barn... Sam ate the red apple near barn Sam 0 1 0 0 0 0 0 ate 1 0 1 0 0 0 0 the 0 1 0 2 0 1 0 red 0 0 2 0 1 0 1 apple 0 0 0 1 0 1 0 near 0 0 1 0 1 0 0 barn 0 0 0 1 0 0 0 . . . ... 3
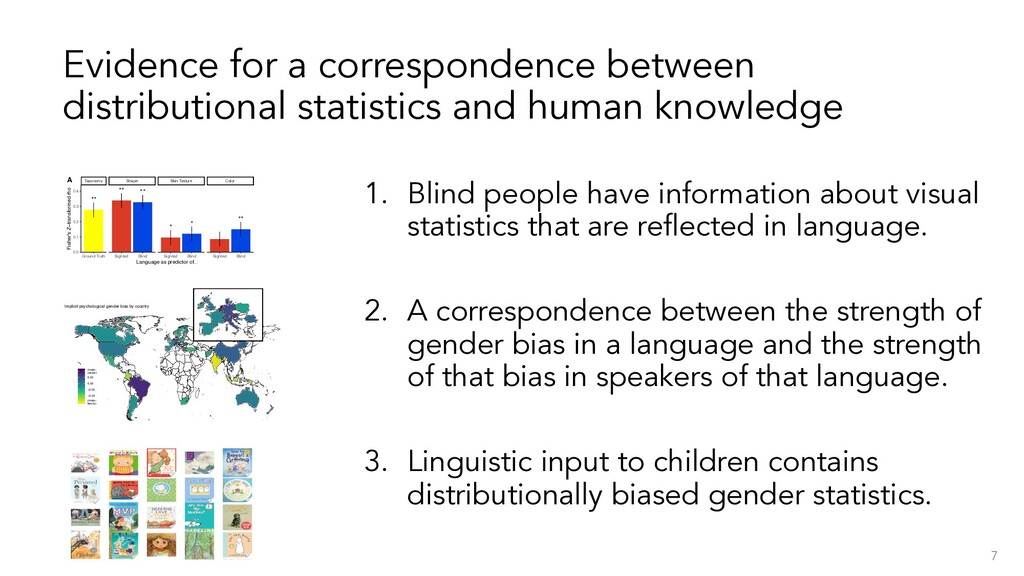
for a correspondence between human semantic knowledge and distributional statistics (necessary but not sufficient) How to test the causal question, and other outstanding issues. 6
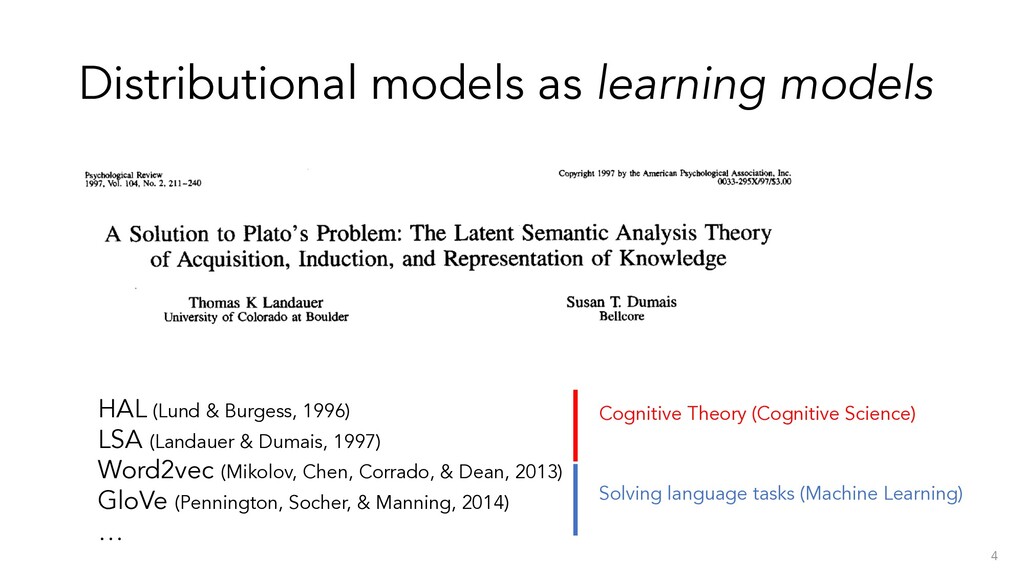
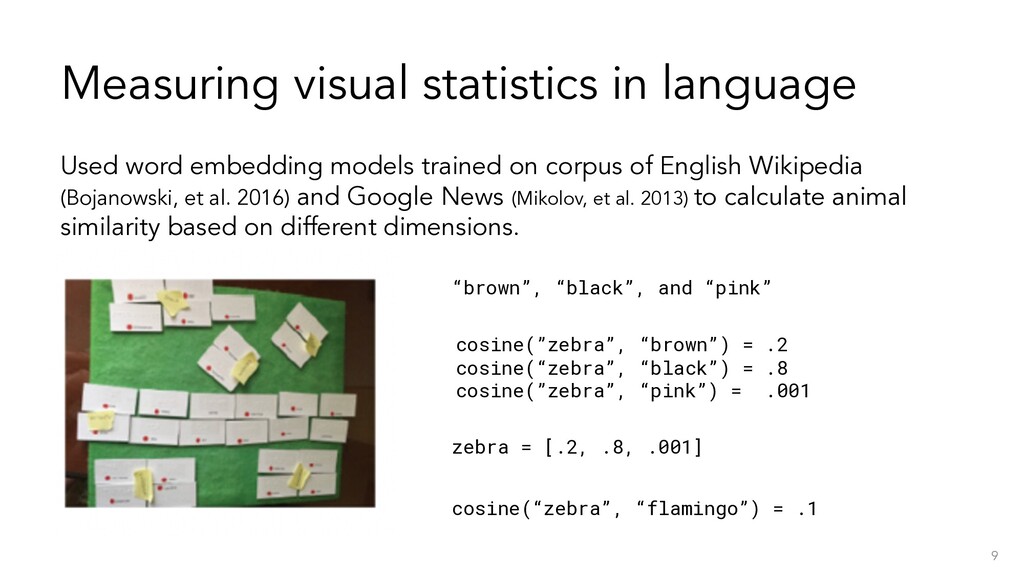
cosine(”zebra”, “brown”) = .2 cosine(“zebra”, “black”) = .8 cosine(”zebra”, “pink”) = .001 zebra = [.2, .8, .001] cosine(“zebra”, “flamingo”) = .1 Used word embedding models trained on corpus of English Wikipedia (Bojanowski, et al. 2016) and Google News (Mikolov, et al. 2013) to calculate animal similarity based on different dimensions.
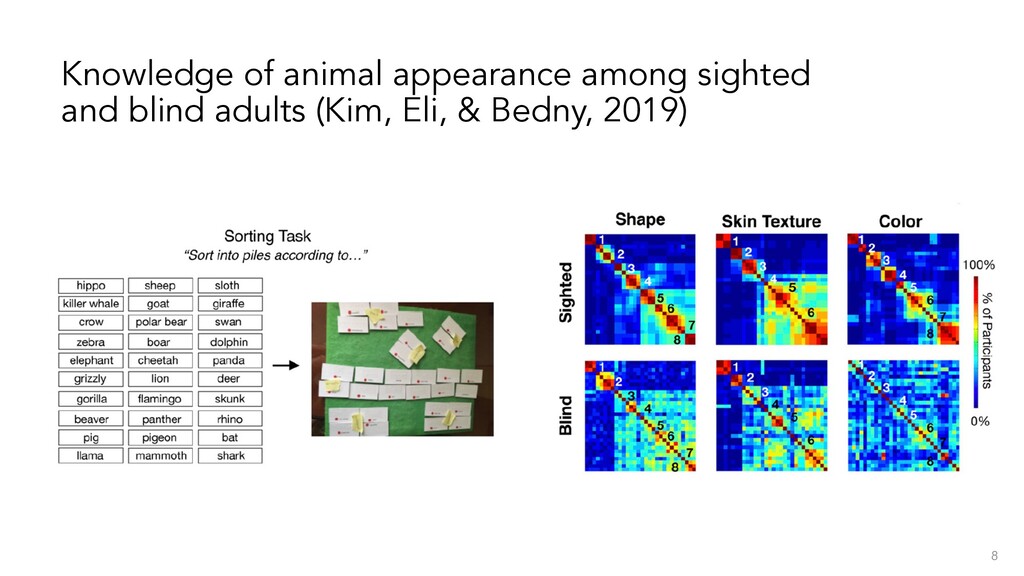
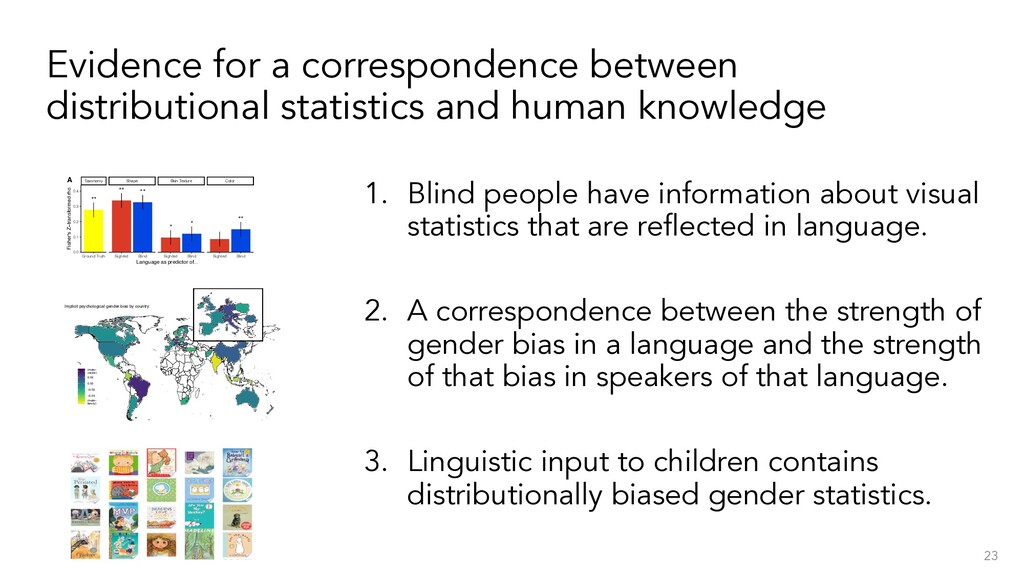
Color Ground Truth Sighted Blind Sighted Blind Sighted Blind 0.0 0.1 0.2 0.3 0.4 Language as predictor of... Fisher's Z−transformed rho A * ** ** 0.0 0.2 0.4 0.6 Ground Truth Sighted Bl Language as predictor Skin Texture Type Proportion Correct B C Language Blind Language Sighted Visual statistics about animals are available in language statistics (Lewis, Zettersten, & Lupyan, 2019, PNAS) Blind people could in principle be learning some visual information from language (to varying degrees).
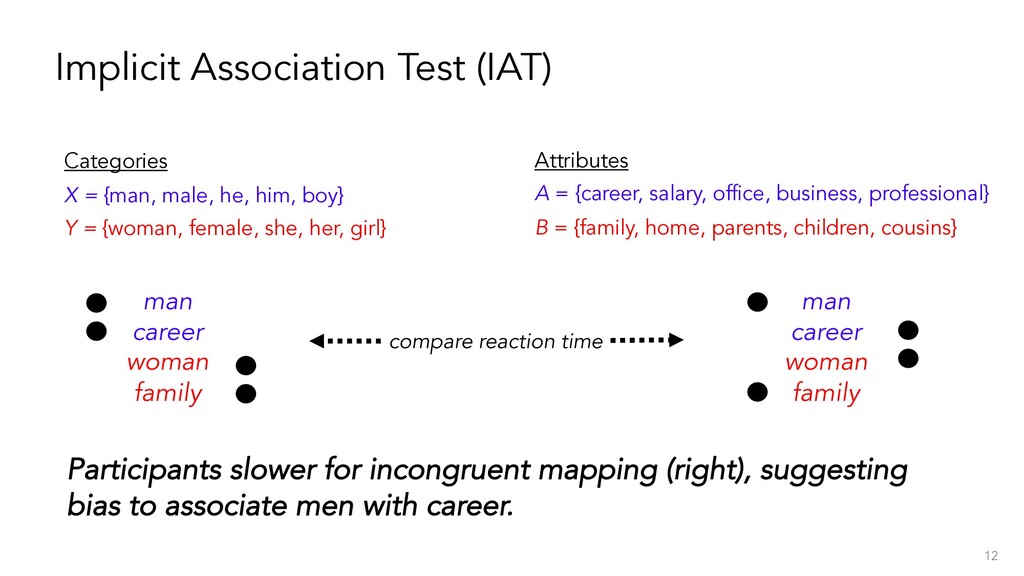
him, boy} Y = {woman, female, she, her, girl} Attributes A = {career, salary, office, business, professional} B = {family, home, parents, children, cousins} Participants slower for incongruent mapping (right), suggesting bias to associate men with career. man career woman family compare reaction time man career woman family 12
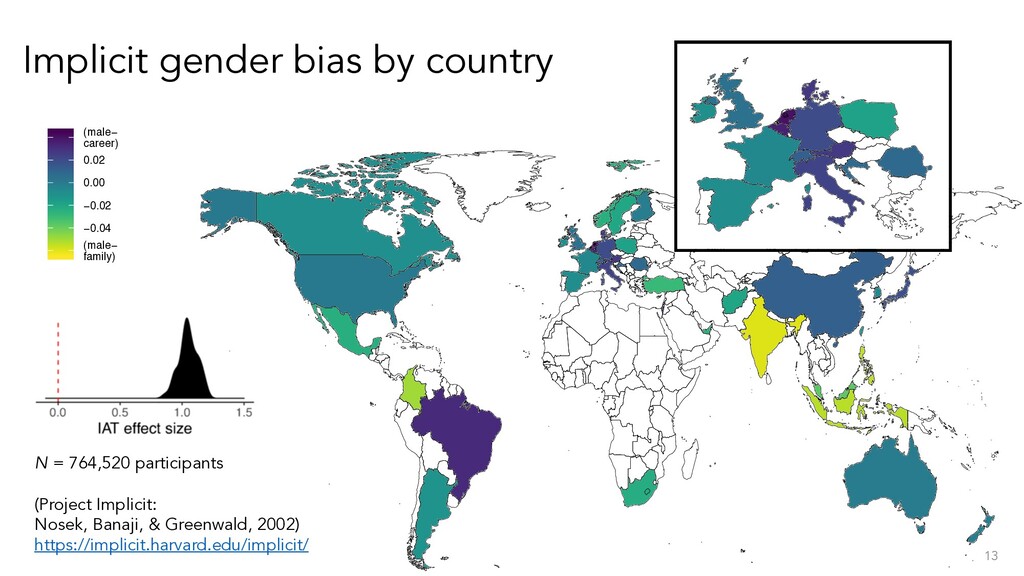
gender bias by country Does bias in language predict bias in IAT? Psychological measure (IAT) Language measure (word-occurrences) Word embedding models trained on 25 languages 14
him, boy} Y = {woman, female, she, her, girl} Attributes A = {career, salary, office, business, professional} B = {family, home, parents, children, cousins} man career woman family compare reaction time man career woman family …based on word co-occurrences (using the same method as Caliskan, Bryson, & Narayanan, 2017) compare distance in semantic space 15
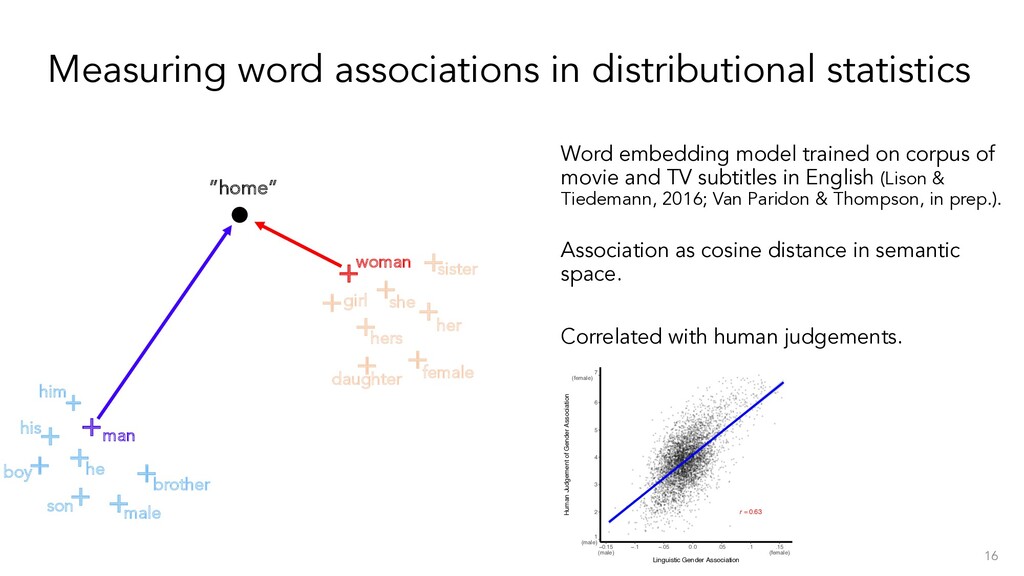
TV subtitles in English (Lison & Tiedemann, 2016; Van Paridon & Thompson, in prep.). Association as cosine distance in semantic space. Correlated with human judgements. Measuring word associations in distributional statistics + + + + + he son male boy his him brother ”home” + + man + + + + + hers daughter female girl she her sister + + woman + 16 r = 0.63 1 (male) 2 3 4 5 6 7 (female) −0.15 (male) −.1 −.05 0.0 .05 .1 .15 (female) Linguistic Gender Association Human Judgement of Gender Association
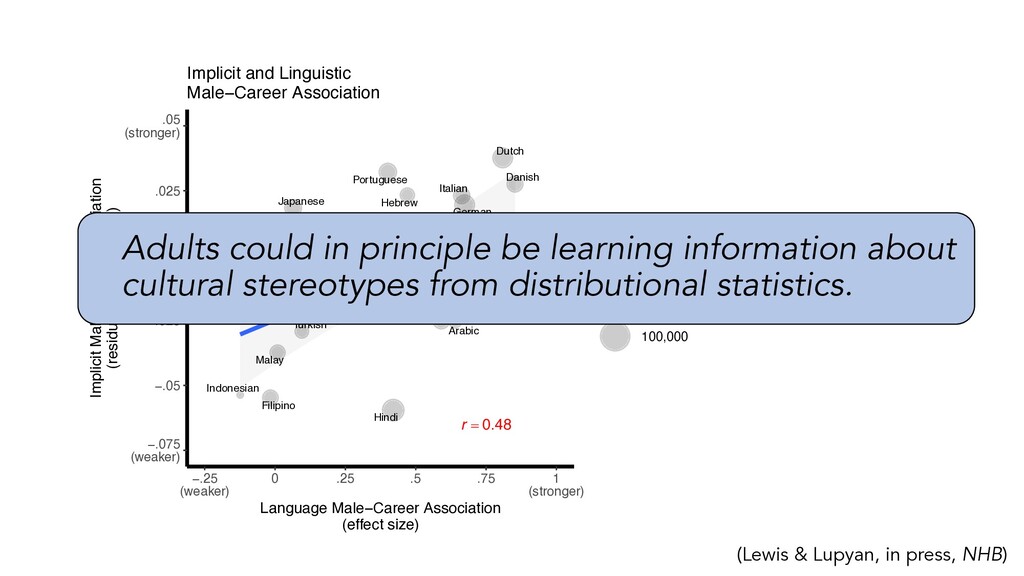
Spanish Persian Finnish French Hebrew Hindi Croatian Indonesian Italian Japanese Korean Malay Dutch Norwegian Polish Portuguese Romanian Swedish Filipino Turkish Mandarin r = 0.48 −.075 (weaker) −.05 −.025 0 .025 .05 (stronger) −.25 (weaker) 0 .25 .5 .75 1 (stronger) Language Male−Career Association (effect size) Implicit Male−Career Association (residualized effect size) N participants 1,000 10,000 100,000 Implicit and Linguistic Male−Career Association a Athletic−Intelligent Avoiding−Approaching Career−Family Cold−Hot Friends−Family Helpers−Leaders Innocence−Wisdom Jocks−Nerd Lawyers−Po Money−Love Defense−E Labor−Management Protein−Carbs. Punishment−Forgiveness Rebellious−Conforming Security−Freedom Skeptical−Tru State−Church Tall−Short Team−Individual Technology−Nature Urban−Rural • • • • • • • • • • • • • • • • • • • • • −.2 (US Greater) −.1 0 .1 .2 .3 (UK Greater) −1.5 (US Greater) −1 −.5 0 Language Association (effect size) Implicit Association Difference (residualized effect size) Implicit and Linguistic Associa in British and American Partic b Adults could in principle be learning information about cultural stereotypes from distributional statistics.
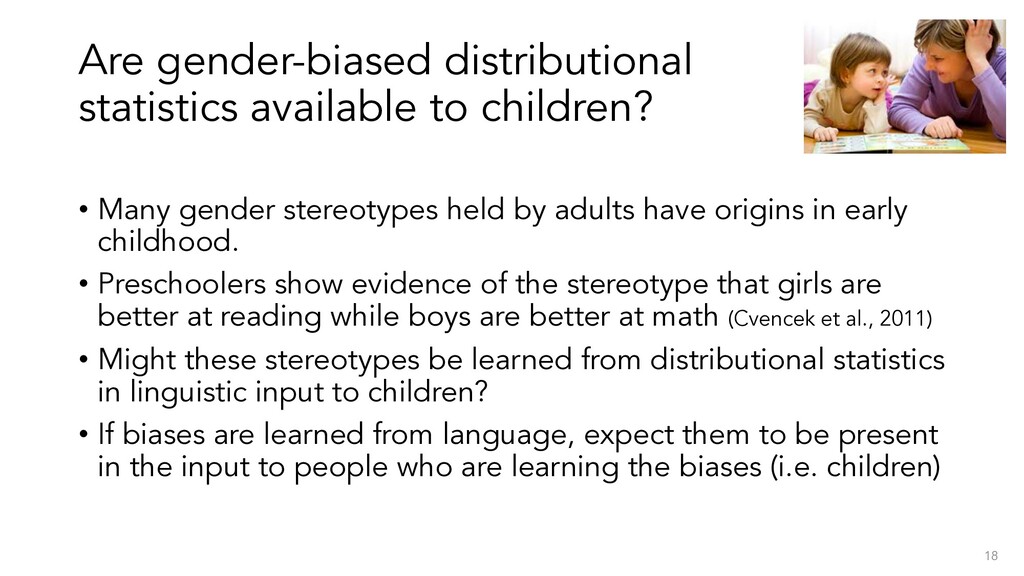
stereotypes held by adults have origins in early childhood. • Preschoolers show evidence of the stereotype that girls are better at reading while boys are better at math (Cvencek et al., 2011) • Might these stereotypes be learned from distributional statistics in linguistic input to children? • If biases are learned from language, expect them to be present in the input to people who are learning the biases (i.e. children) 18
in their gender associations Triangle Katy And The Big Snow Today I'll Be A Princess Good Dog, Carl Ten Little Ladybugs Goodnight, Goodnight, Construction Site Rain Makes Applesauce Brave Irene Dear Zoo Chrysanthemum The Little Engine That Could Curious George Takes A Job Llama Llama Red Pajama Maisy Goes Camping Trashy Town r = 0.27 (male− biased) 2.8 3.0 3.2 3.4 (female− biased) 1 (male− biased) 2 3 4 5 (female− biased) Character Gender Score Content Gender Score Book Content vs. Book Character Gender Scores
for a correspondence between human semantic knowledge and distributional statistics (necessary but not sufficient) How to test the causal question, and other outstanding issues. 24
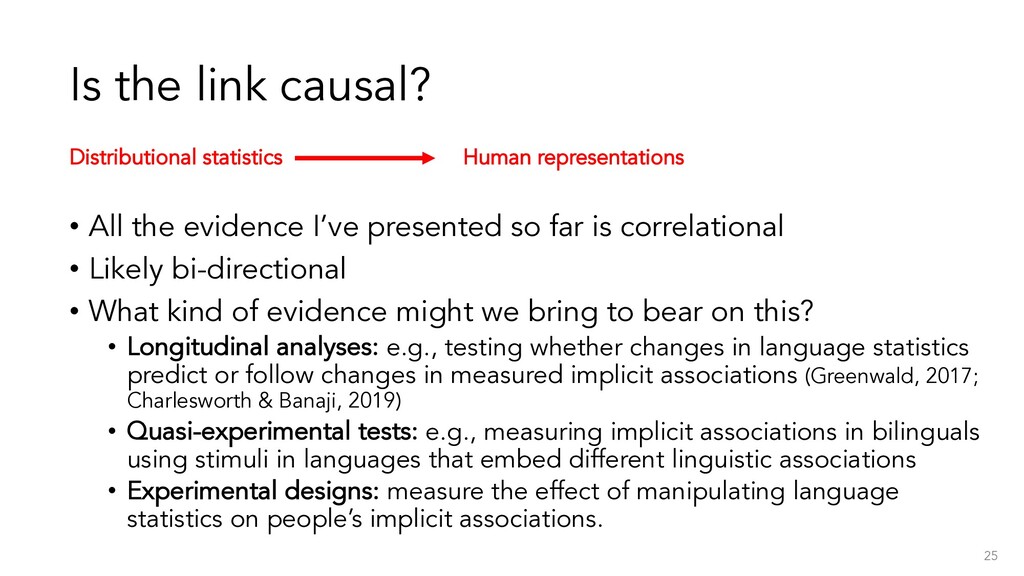
so far is correlational • Likely bi-directional • What kind of evidence might we bring to bear on this? • Longitudinal analyses: e.g., testing whether changes in language statistics predict or follow changes in measured implicit associations (Greenwald, 2017; Charlesworth & Banaji, 2019) • Quasi-experimental tests: e.g., measuring implicit associations in bilinguals using stimuli in languages that embed different linguistic associations • Experimental designs: measure the effect of manipulating language statistics on people’s implicit associations. 25 Distributional statistics Human representations
compare/interact with other routes of learning? • Observational learning • Explicit teaching, etc. 2. Does the source of the language matter? (Xu & Tenenbaum, 2007) • Make stronger inferences about information when its from a knowledgeable source (“strongly sampled”) • Does speech from respected source vs. overheard speech matter for distributional learning? Or speech from an ingroup vs. outgroup member? • Or, is it purely bottom-up associative learning? 26
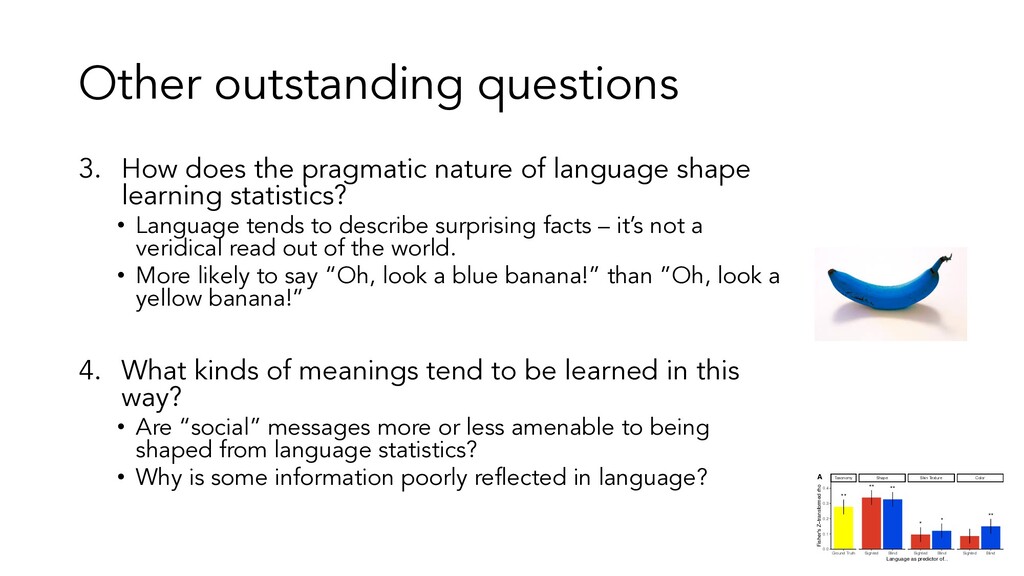
language shape learning statistics? • Language tends to describe surprising facts – it’s not a veridical read out of the world. • More likely to say “Oh, look a blue banana!” than ”Oh, look a yellow banana!” 4. What kinds of meanings tend to be learned in this way? • Are “social” messages more or less amenable to being shaped from language statistics? • Why is some information poorly reflected in language? 27 ** ** ** * * ** Taxonomy Shape Skin Texture Color Ground Truth Sighted Blind Sighted Blind Sighted Blind 0.0 0.1 0.2 0.3 0.4 Language as predictor of... Fisher's Z−transformed rho A 0.0 0.2 0.4 0.6 Skin Texture Type Proportion Correct B C Language Language Sighted
Wisconsin-Madison) Matt Cooper-Borkenhagen (U. of Wisconsin-Madison) Martin Zettersten (U. of Wisconsin-Madison) Papers: Lewis, M., Zettersten, M. & Lupyan, G. (2019). Distributional semantics as a source of visual knowledge: Commentary on Kim, Elli, and Bedny (2019). PNAS. https://psyarxiv.com/cau95/ Lewis, M. & Lupyan, G. (in press). What are we learning from language? Gender stereotypes are reflected in the distributional structure of 25 languages. Nature Human Behavior. https://psyarxiv.com/7qd3g Lewis, M., Cooper Borkenhagen, M., Converse, E., Lupyan, G. and Seidenberg, M. S. (under review). What might books be teaching young children about gender? https://psyarxiv.com/ntgfe