Francisco, CA An Approach to Fitting Transmission Models to Seriations for Regional-Scale Analysis Mark E. Madsen Carl P. Lipo University of Washington CSU Long Beach
population • Finer grained compared to largest-scale phylogenetic models • Basic question is: can we infer changing patterns of interaction within an evolving settlement system? • PILOT STUDY: Can we recover the overall interaction pattern from time-averaged type frequencies, using a diachronic tool like seriation? Regional Scale CT Models
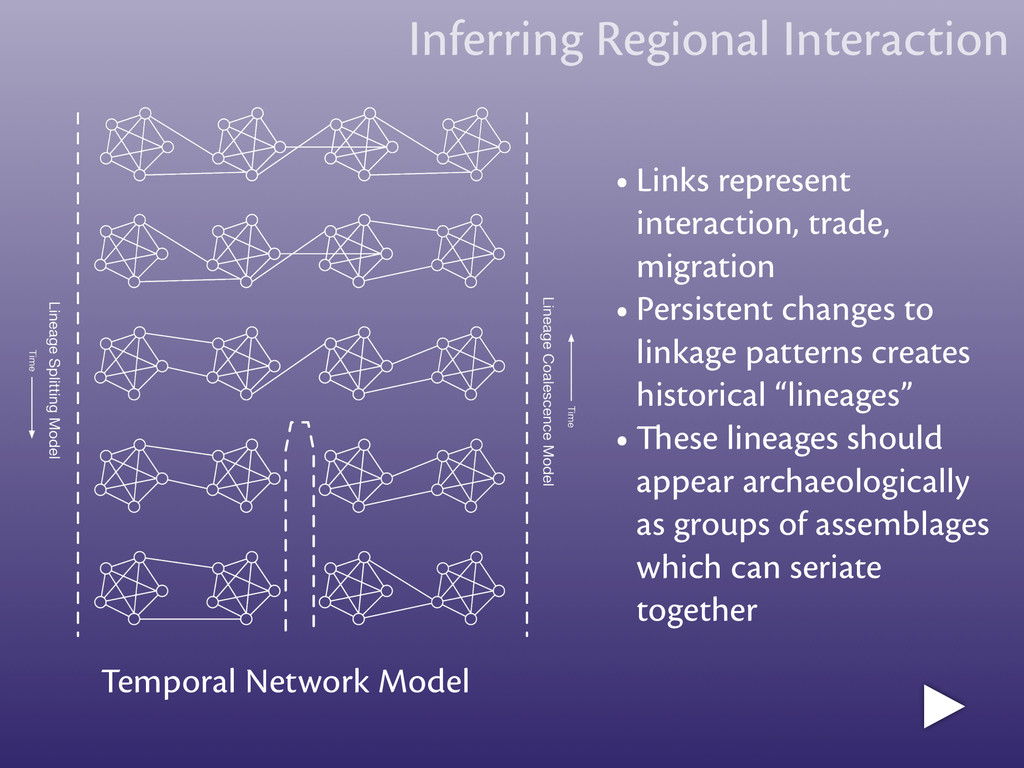
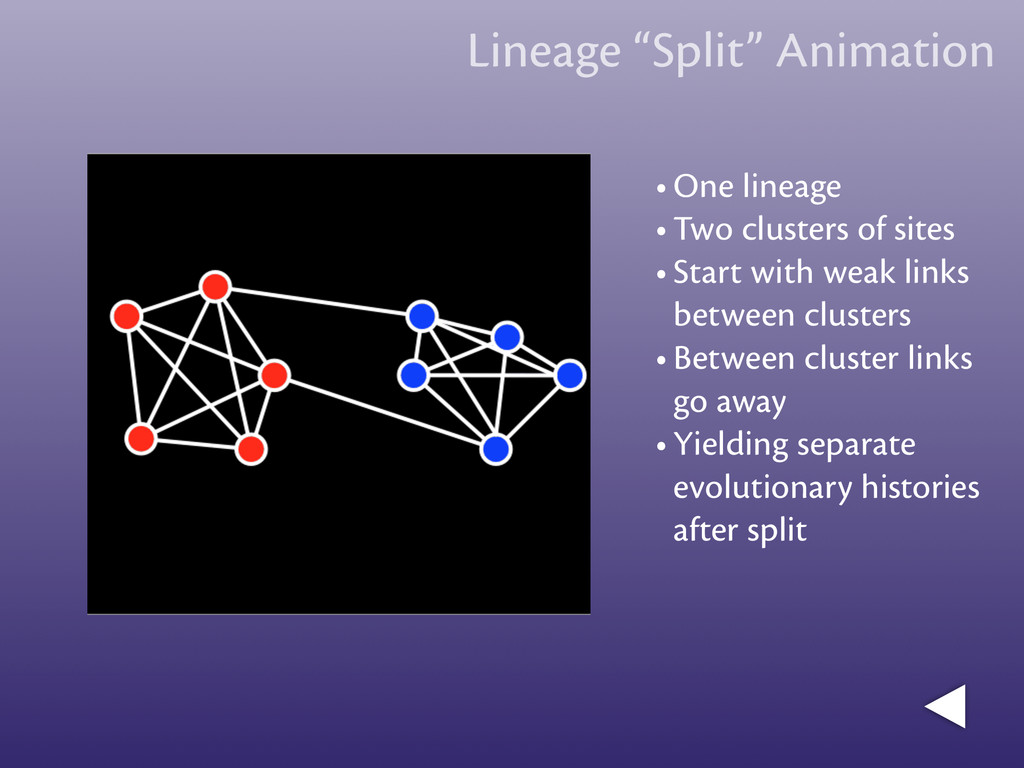
trade, migration • Persistent changes to linkage patterns creates historical “lineages” • These lineages should appear archaeologically as groups of assemblages which can seriate together
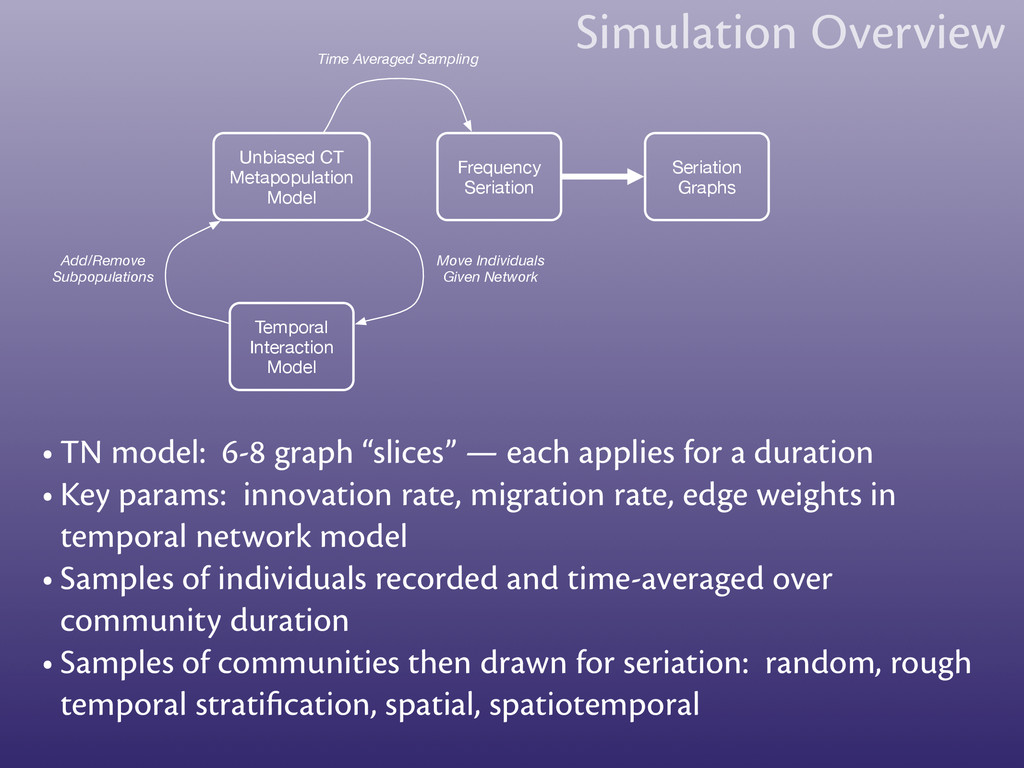
Graphs Time Averaged Sampling Add/Remove Subpopulations Move Individuals Given Network Simulation Overview • TN model: 6-8 graph “slices” — each applies for a duration • Key params: innovation rate, migration rate, edge weights in temporal network model • Samples of individuals recorded and time-averaged over community duration • Samples of communities then drawn for seriation: random, rough temporal stratification, spatial, spatiotemporal
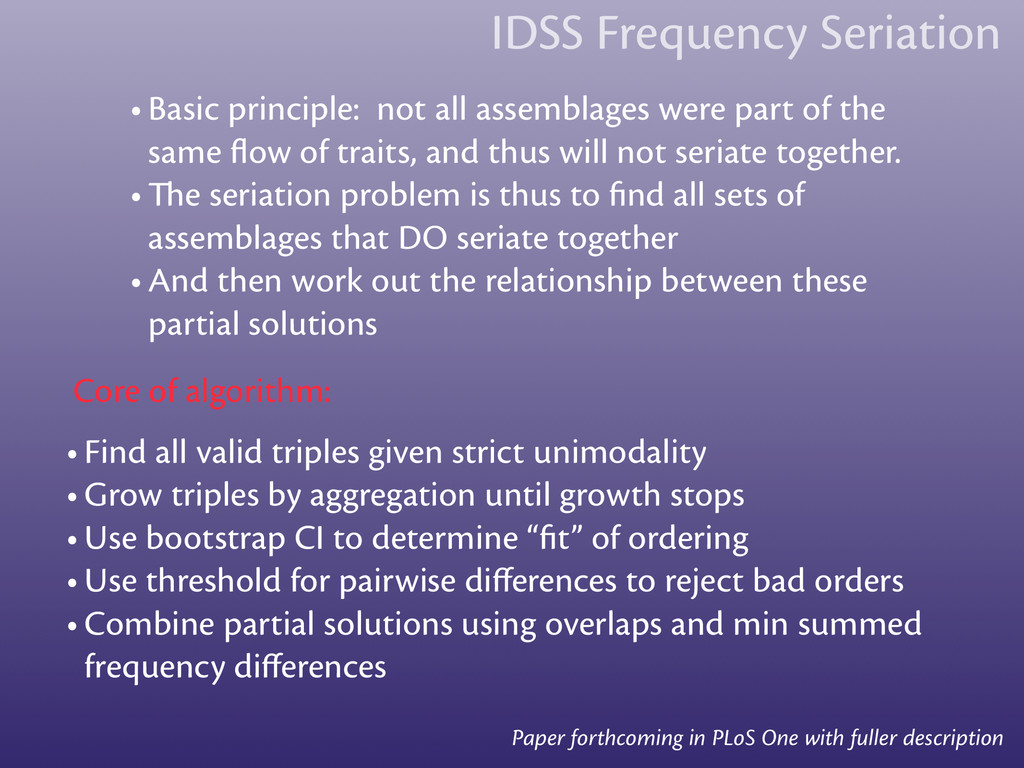
same flow of traits, and thus will not seriate together. • The seriation problem is thus to find all sets of assemblages that DO seriate together • And then work out the relationship between these partial solutions IDSS Frequency Seriation • Find all valid triples given strict unimodality • Grow triples by aggregation until growth stops • Use bootstrap CI to determine “fit” of ordering • Use threshold for pairwise differences to reject bad orders • Combine partial solutions using overlaps and min summed frequency differences Core of algorithm: Paper forthcoming in PLoS One with fuller description
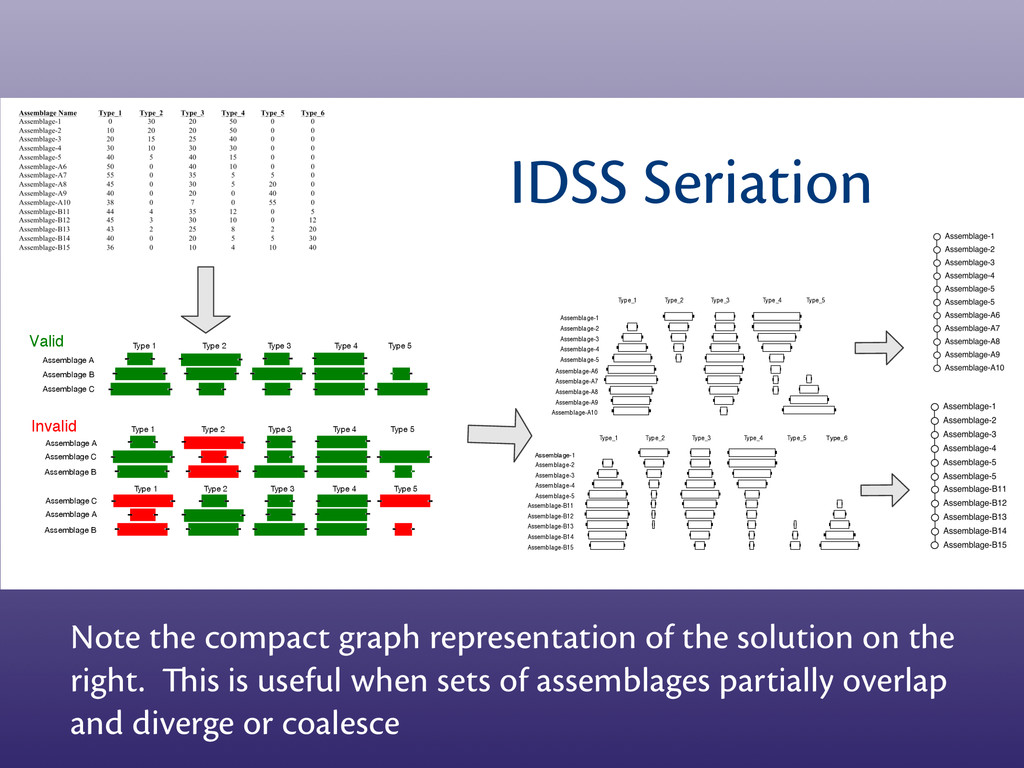
Type_2 Type_3 Type_4 Type_5 Assemblage-1 Assemblage-1 Assemblage-2 Assemblage-3 Assemblage-4 Assemblage-5 Assemblage-A6 Assemblage-A7 Assemblage-A8 Assemblage-A9 Assemblage-A10 Type_1 Type_2 Type_3 Type_4 Type_5 Type_6 Assemblage A Type 1 Type 2 Type 3 Type 4 Type 5 Assemblage C Assemblage B Type 1 Type 2 Type 3 Type 4 Assemblage A Assemblage C Assemblage B Type 5 Type 1 Type 2 Type 3 Type 4 Assemblage A Assemblage C Assemblage B Type 5 Valid Invalid IDSS Seriation Note the compact graph representation of the solution on the right. This is useful when sets of assemblages partially overlap and diverge or coalesce
the vertices in the partial solutions (1-5, A6-10, B11-15) • Edges are kept which have the smallest total frequency differences between vertices • Creates branching points and tree-like solutions, preserving overlapping portions. • Result is the “maximal” size solution with the “minimal” total frequency distance, hence “minmax” graph
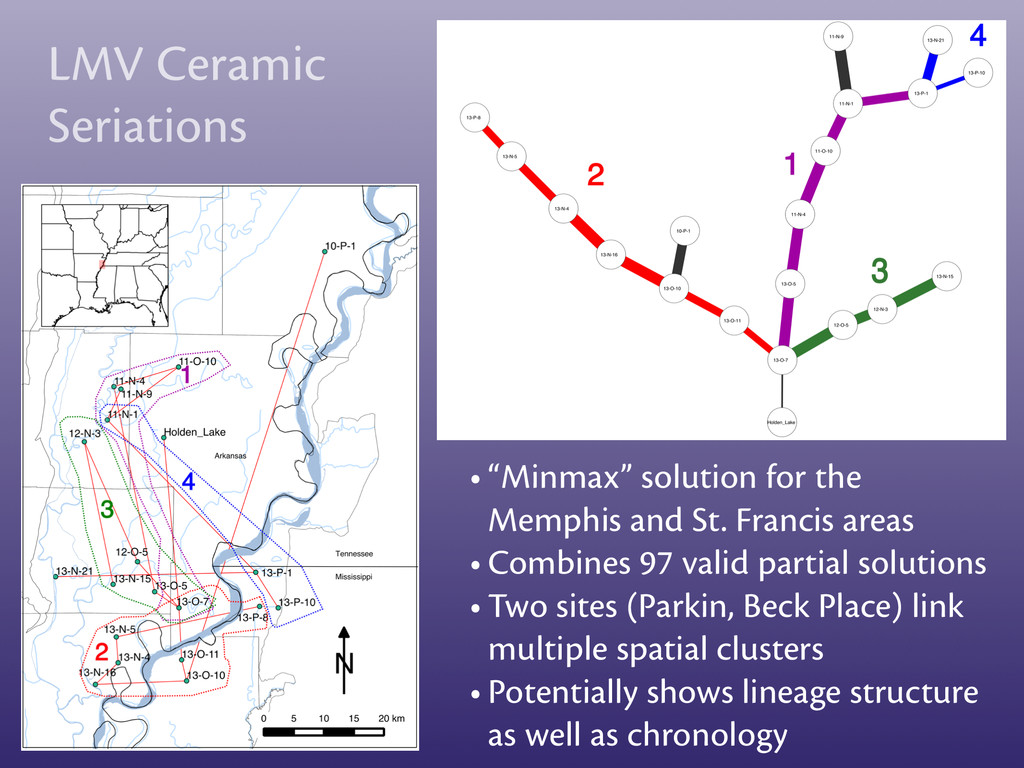
St. Francis areas • Combines 97 valid partial solutions • Two sites (Parkin, Beck Place) link multiple spatial clusters • Potentially shows lineage structure as well as chronology
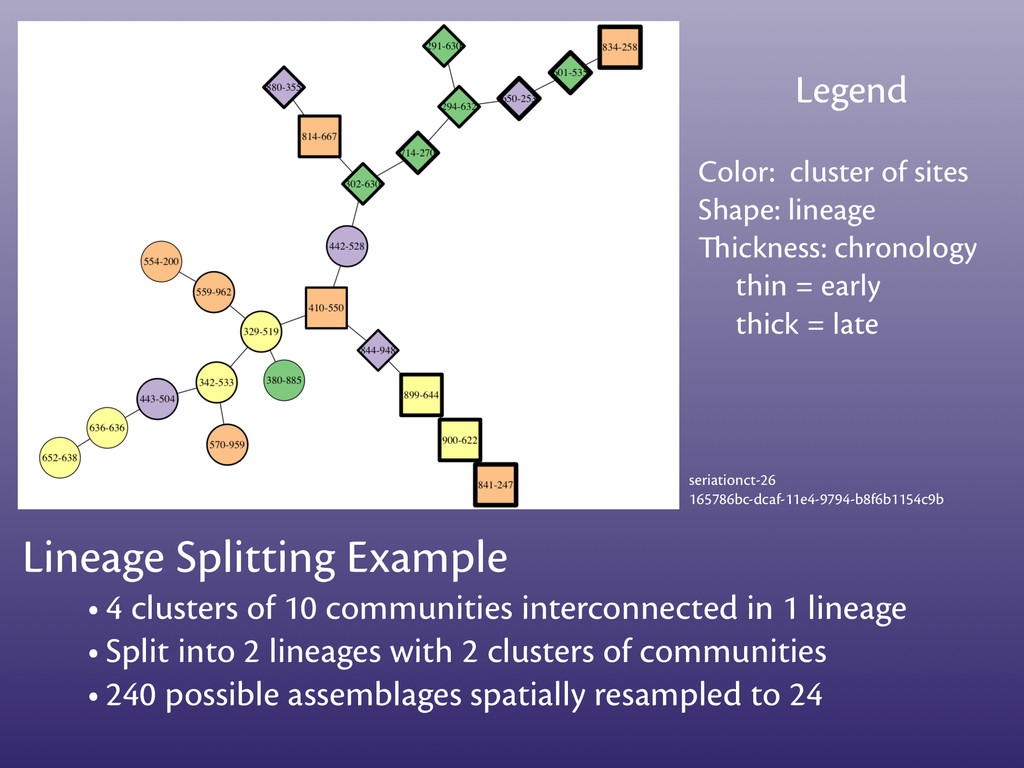
= early thick = late Lineage Splitting Example seriationct-26 165786bc-dcaf-11e4-9794-b8f6b1154c9b • 4 clusters of 10 communities interconnected in 1 lineage • Split into 2 lineages with 2 clusters of communities • 240 possible assemblages spatially resampled to 24
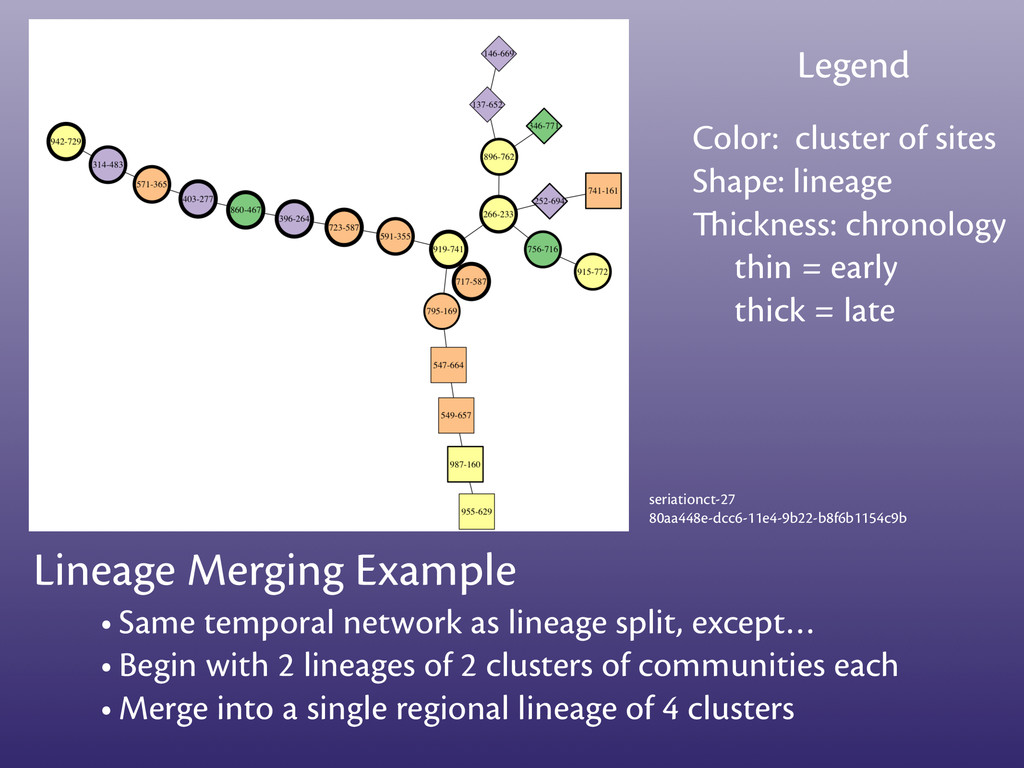
= early thick = late Lineage Merging Example • Same temporal network as lineage split, except… • Begin with 2 lineages of 2 clusters of communities each • Merge into a single regional lineage of 4 clusters seriationct-27 80aa448e-dcc6-11e4-9b22-b8f6b1154c9b
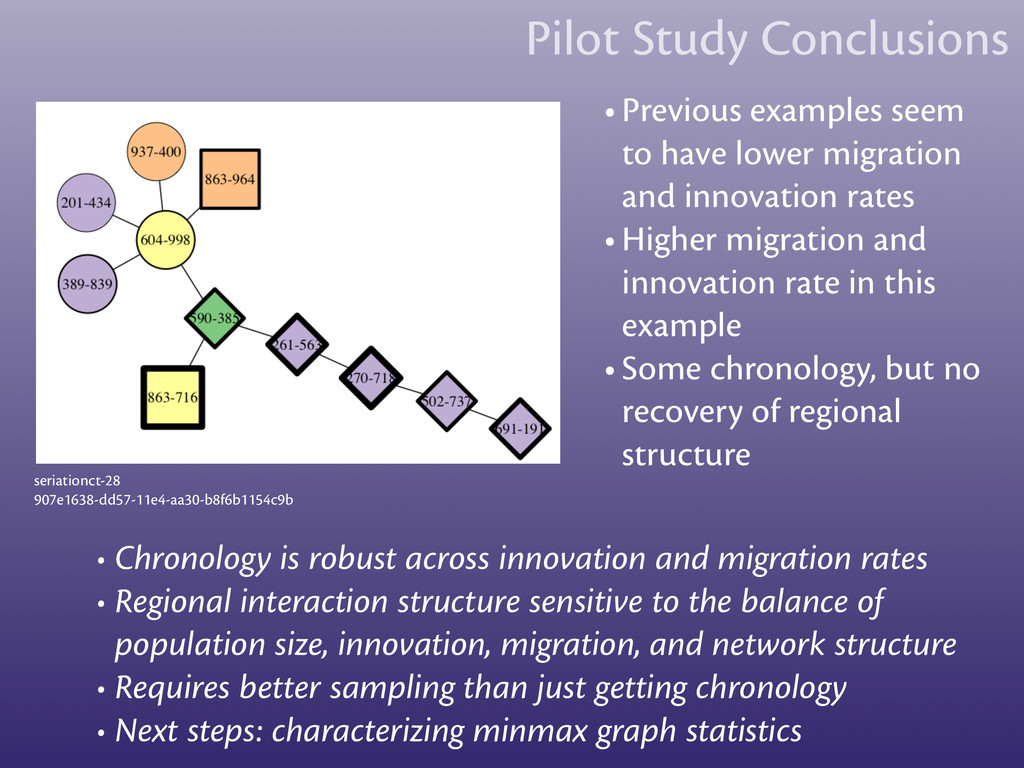
have lower migration and innovation rates • Higher migration and innovation rate in this example • Some chronology, but no recovery of regional structure • Chronology is robust across innovation and migration rates • Regional interaction structure sensitive to the balance of population size, innovation, migration, and network structure • Requires better sampling than just getting chronology • Next steps: characterizing minmax graph statistics
• Analysis: https://github.com/mmadsen/experiment-seriationct and https://github.com/mmadsen/experiment-seriationct-2 • Notes: http://notebook.madsenlab.org THANK YOU