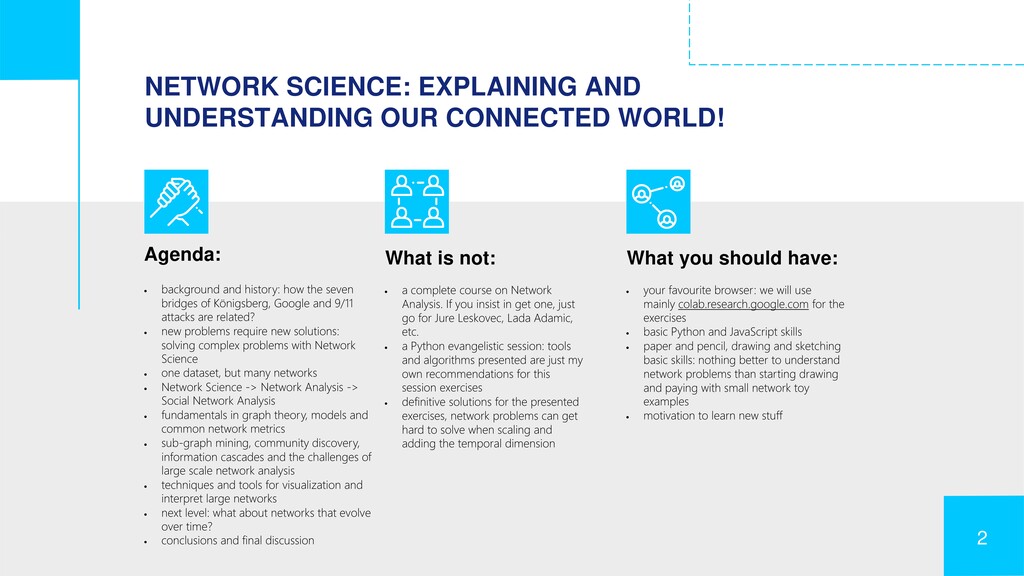
Agenda:
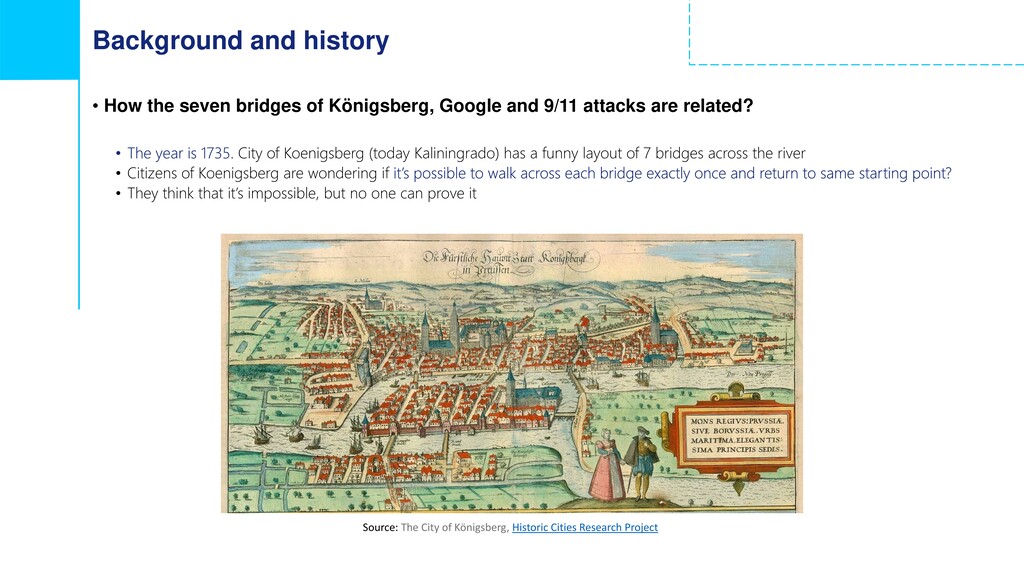
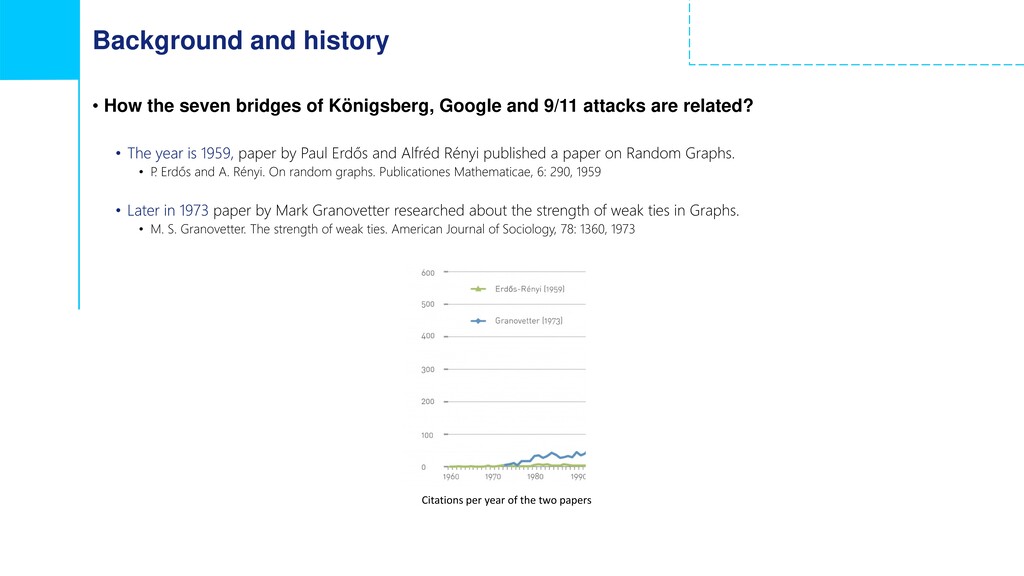
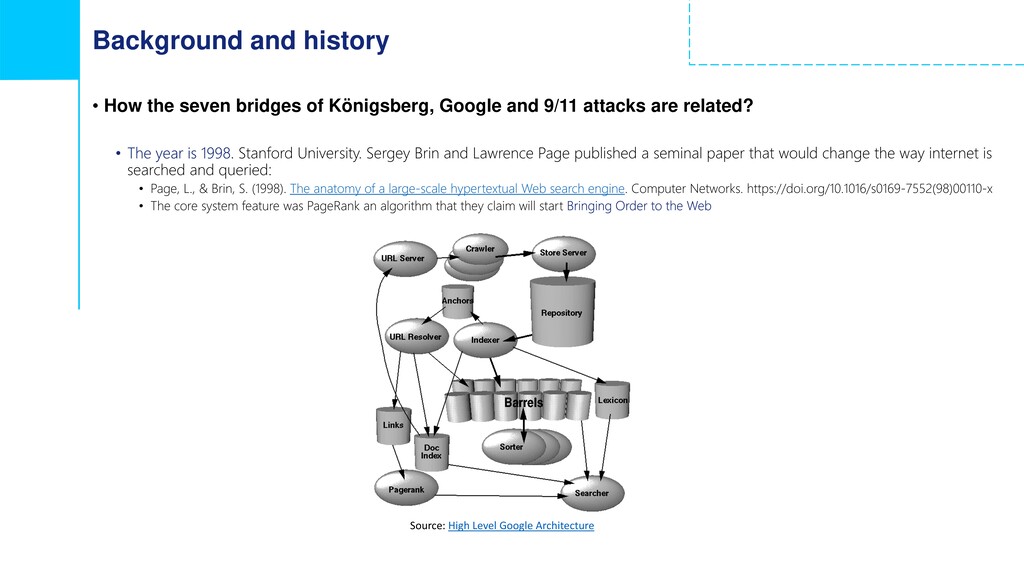
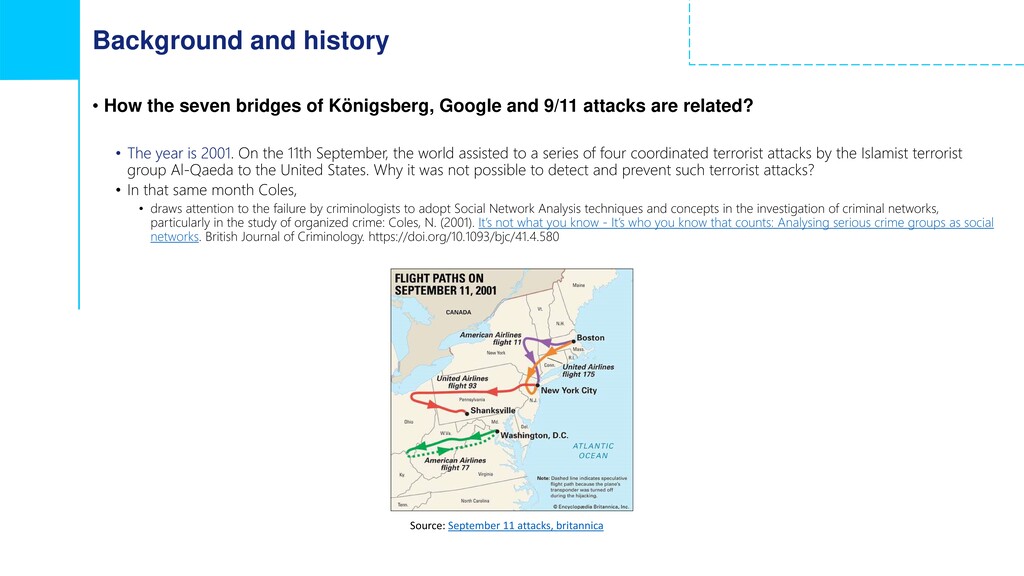
- background and history: how the seven bridges of Königsberg, Google and 9/11 attacks are related?
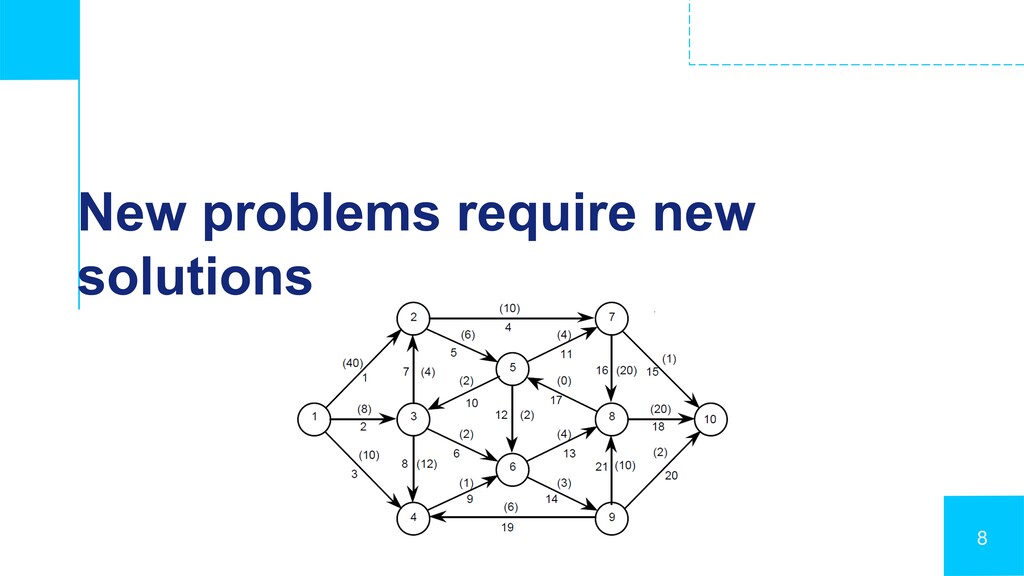
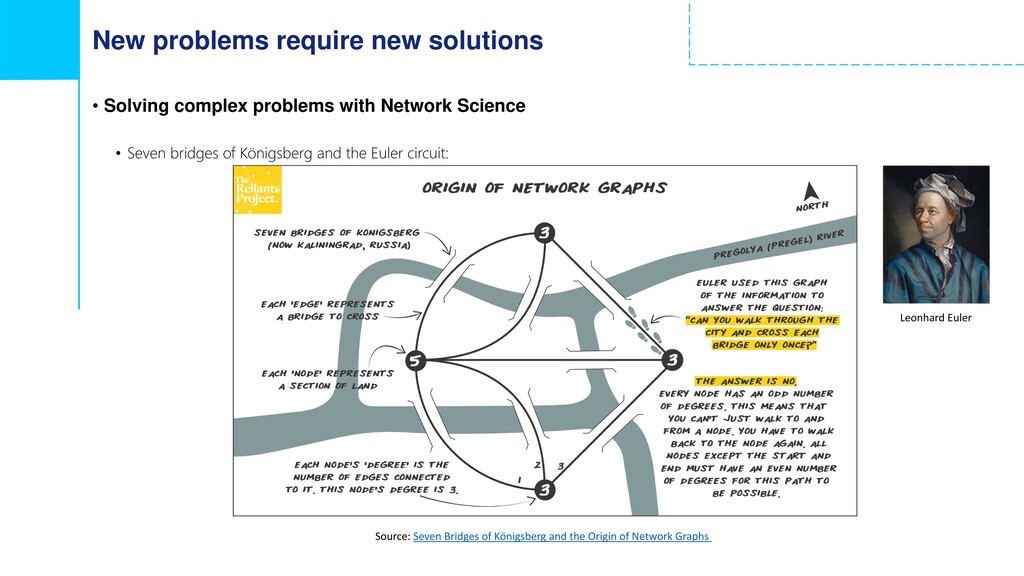
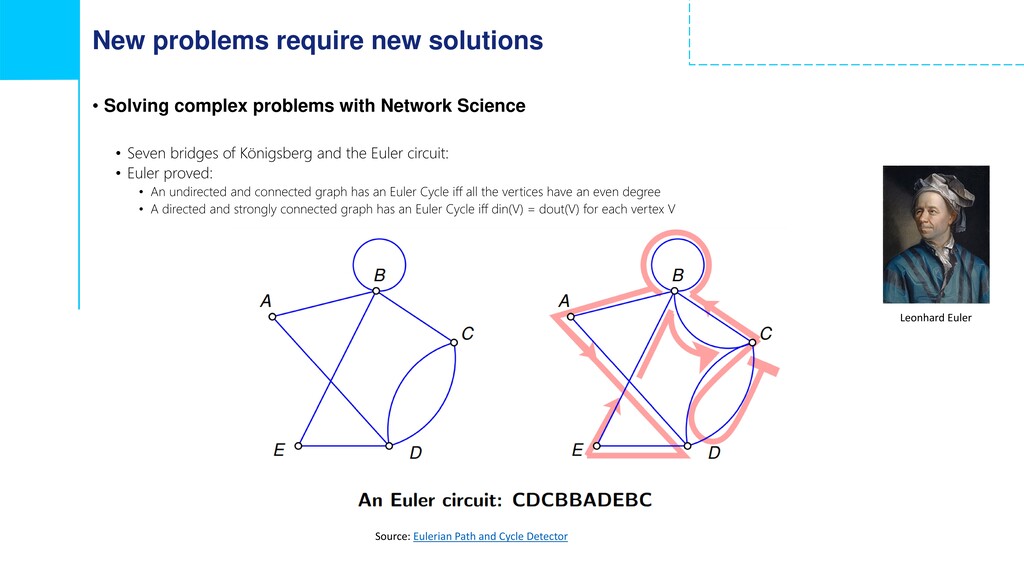
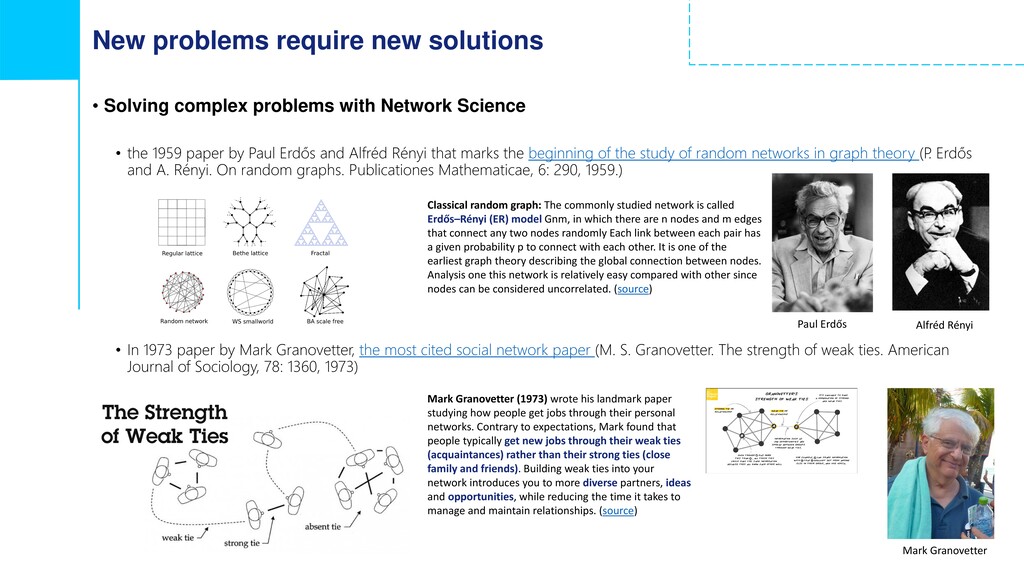
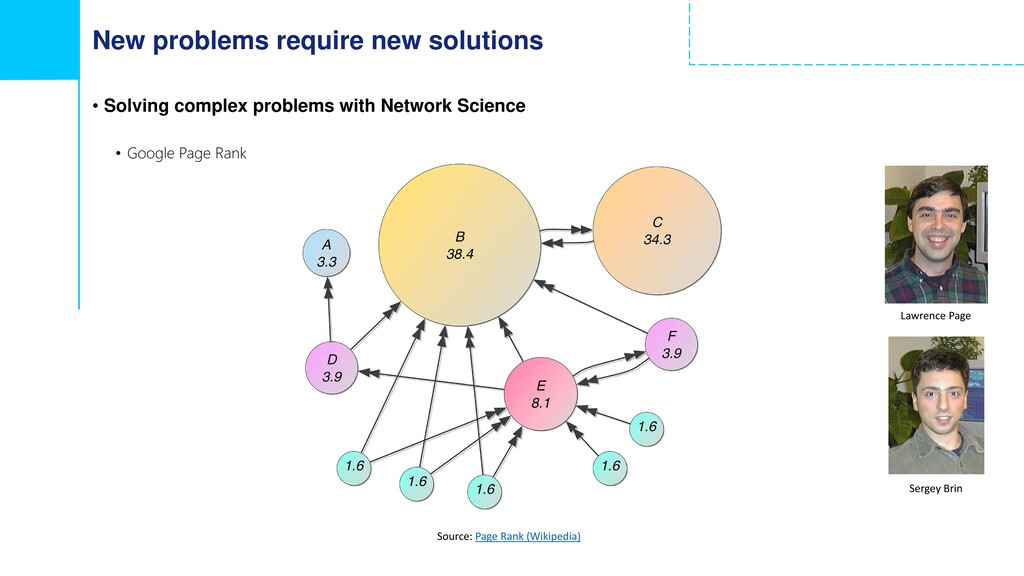
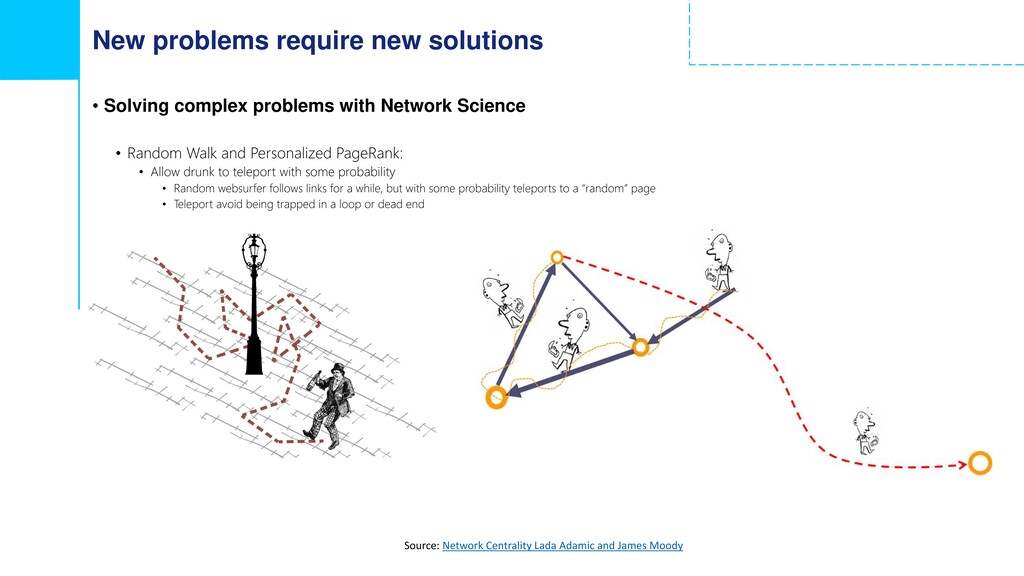
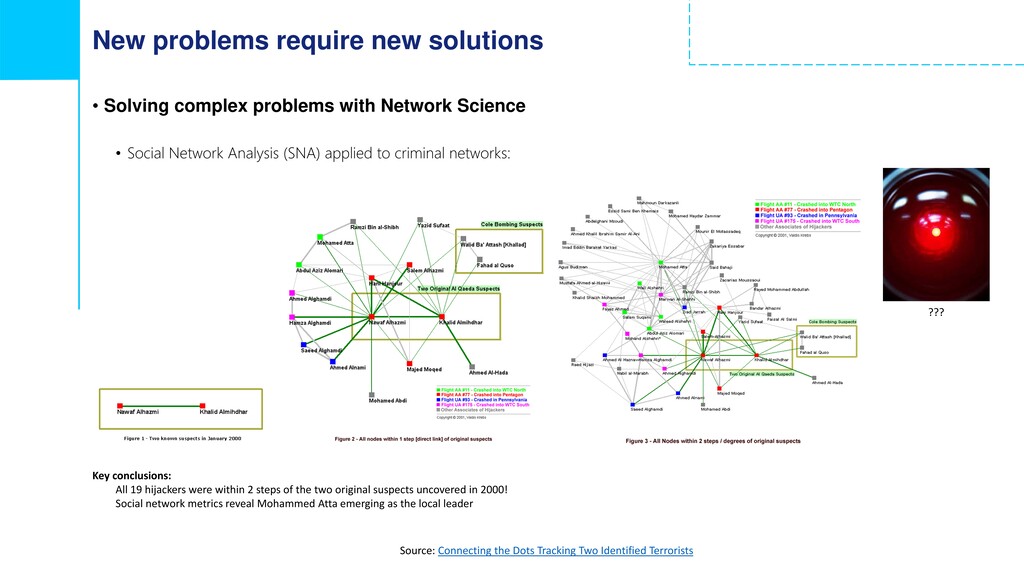
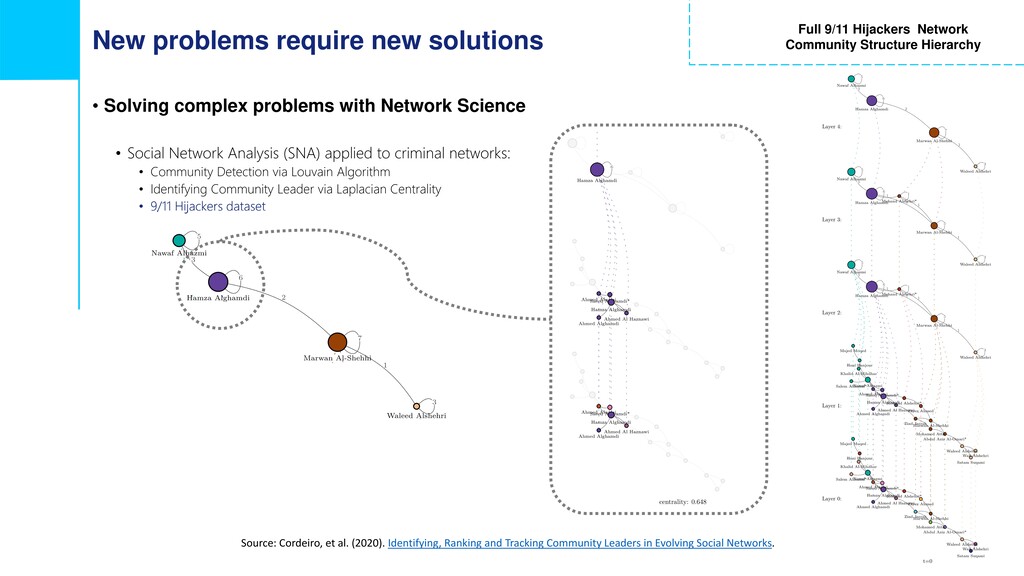
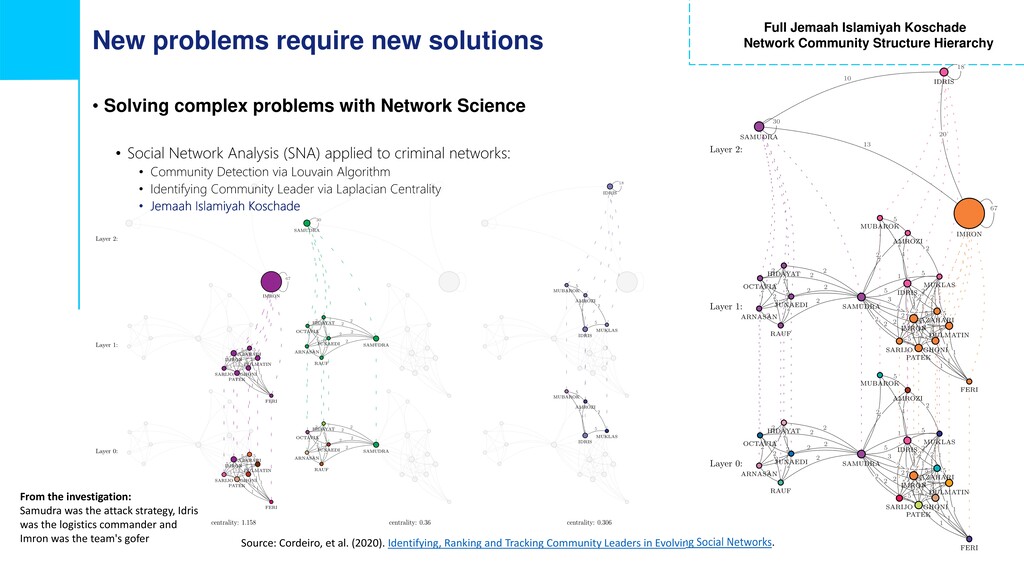
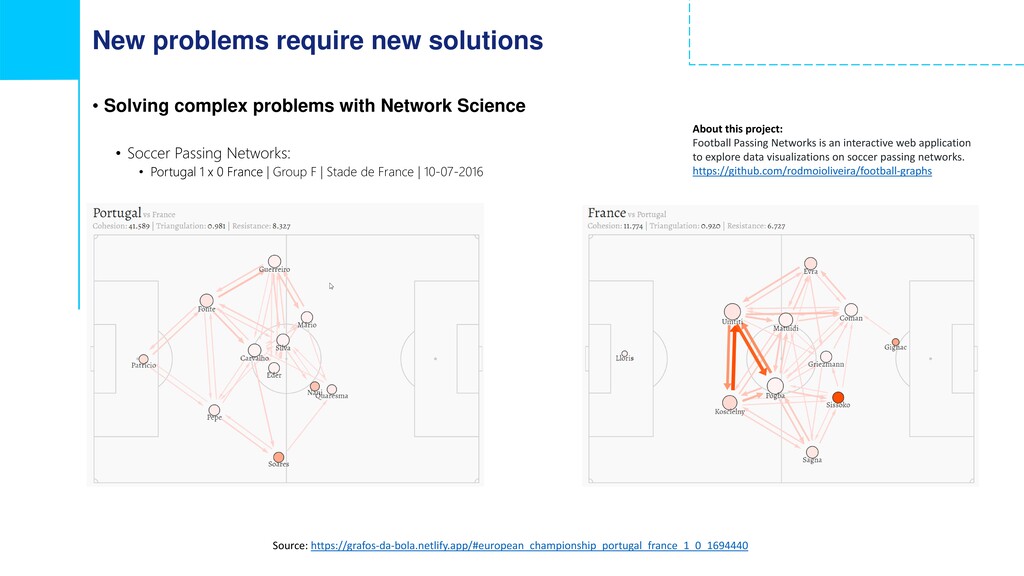
- new problems require new solutions: solving complex problems with Network Science
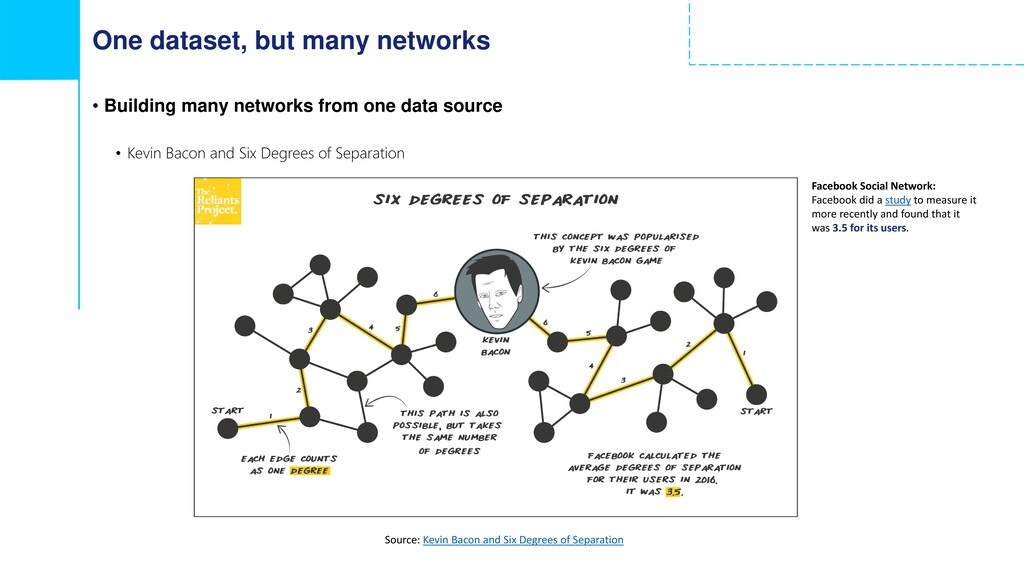
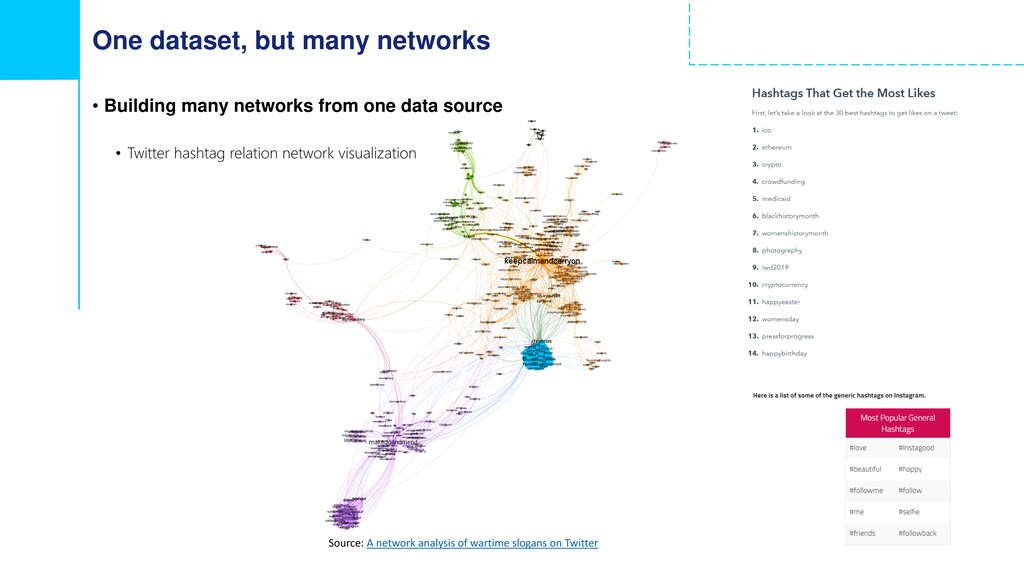
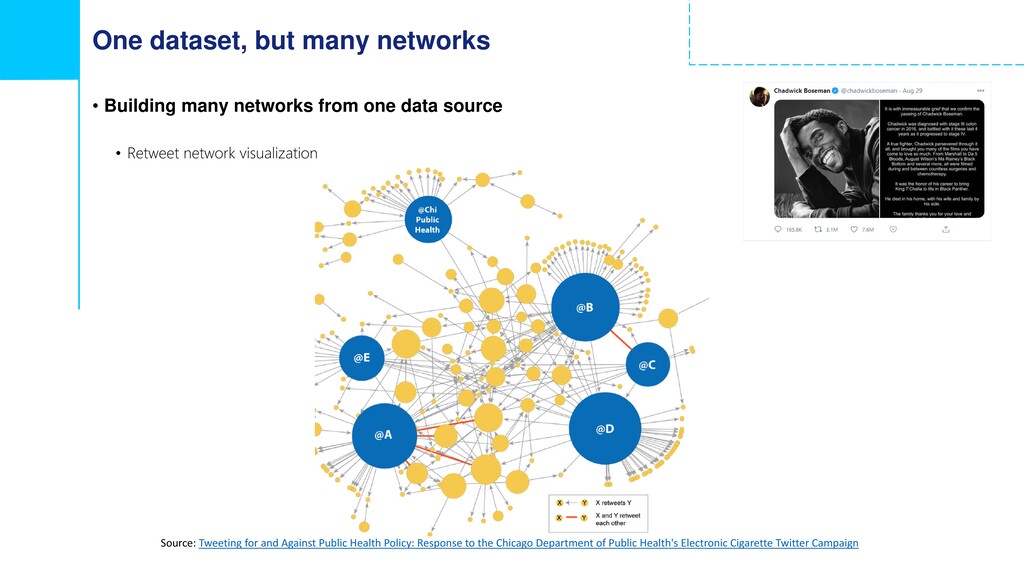
- one dataset, but many networks
- Network Science -> Network Analysis -> Social Network Analysis
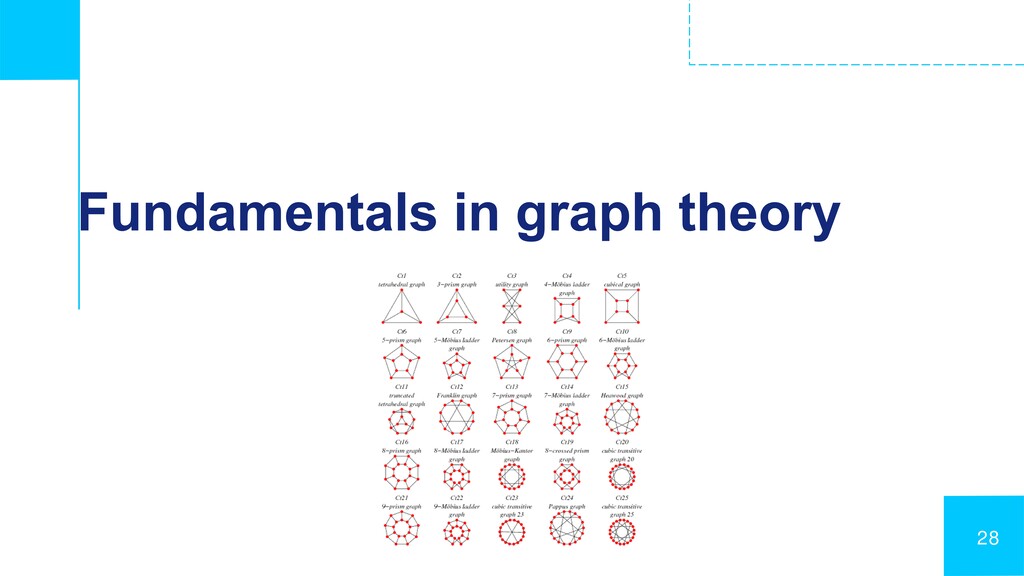
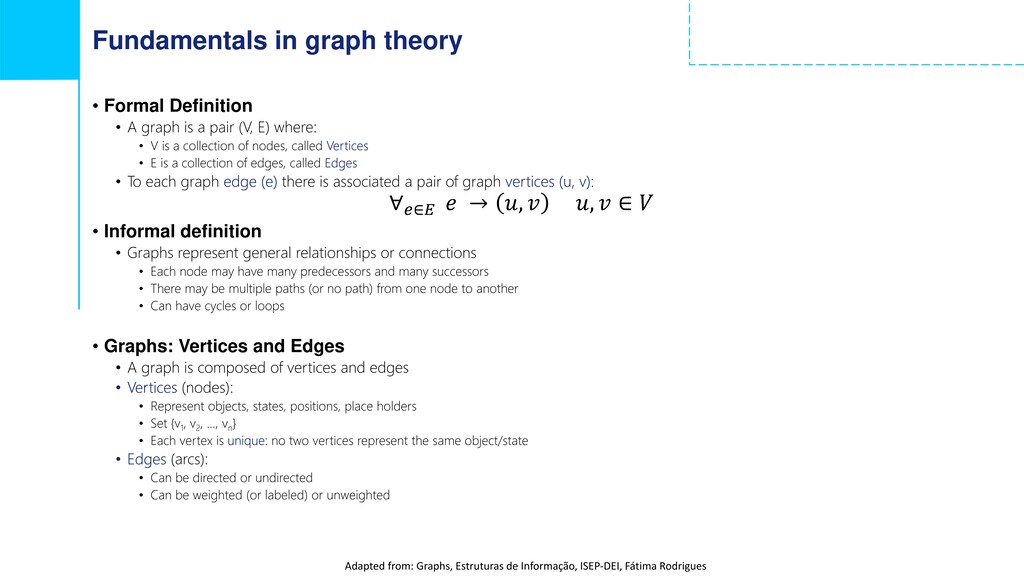
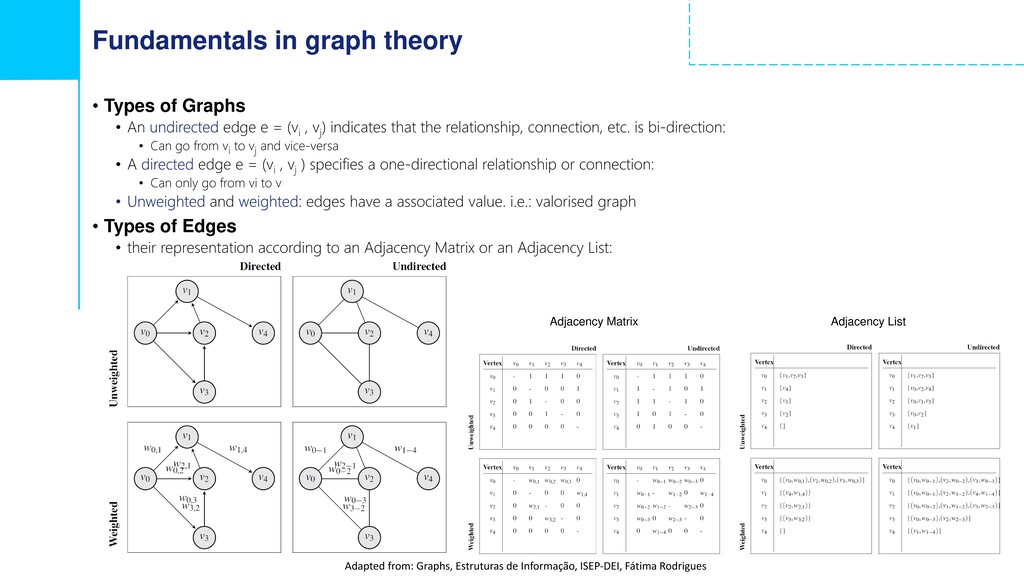
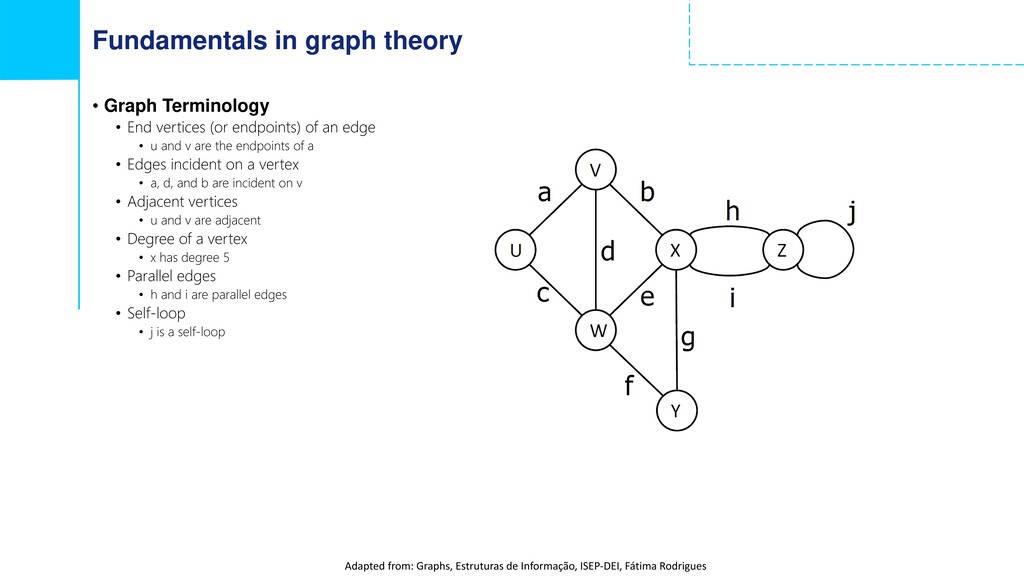
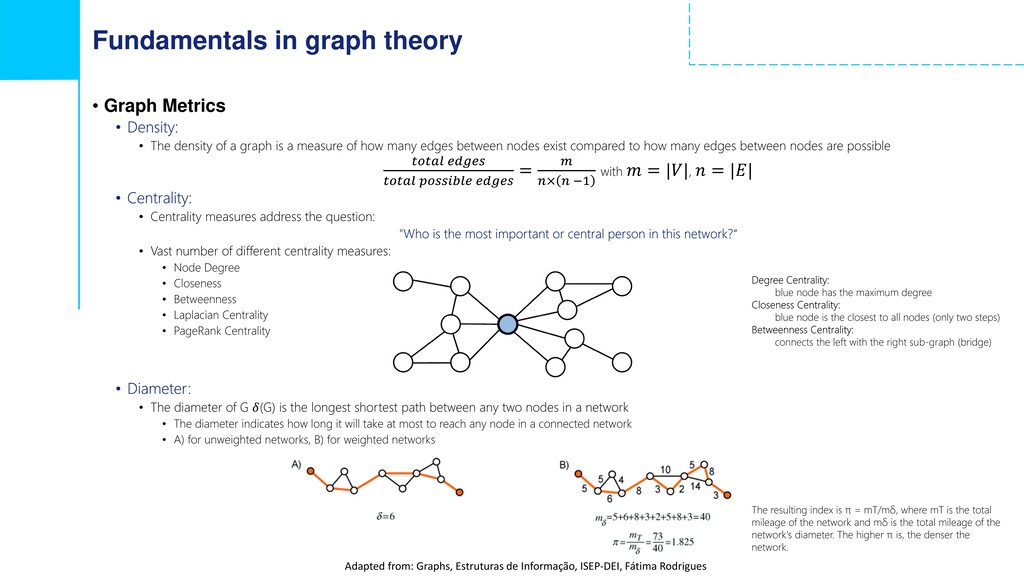
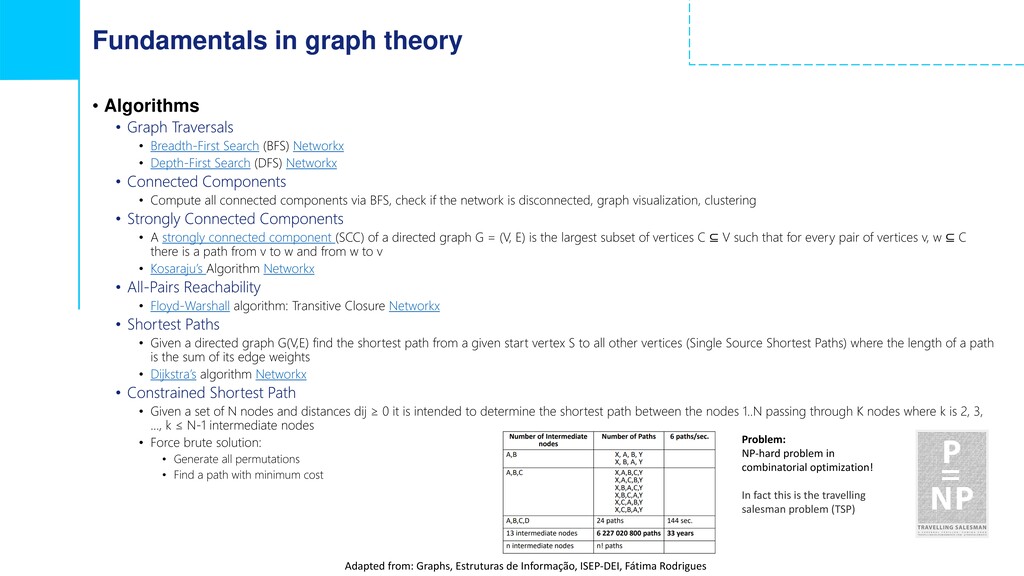
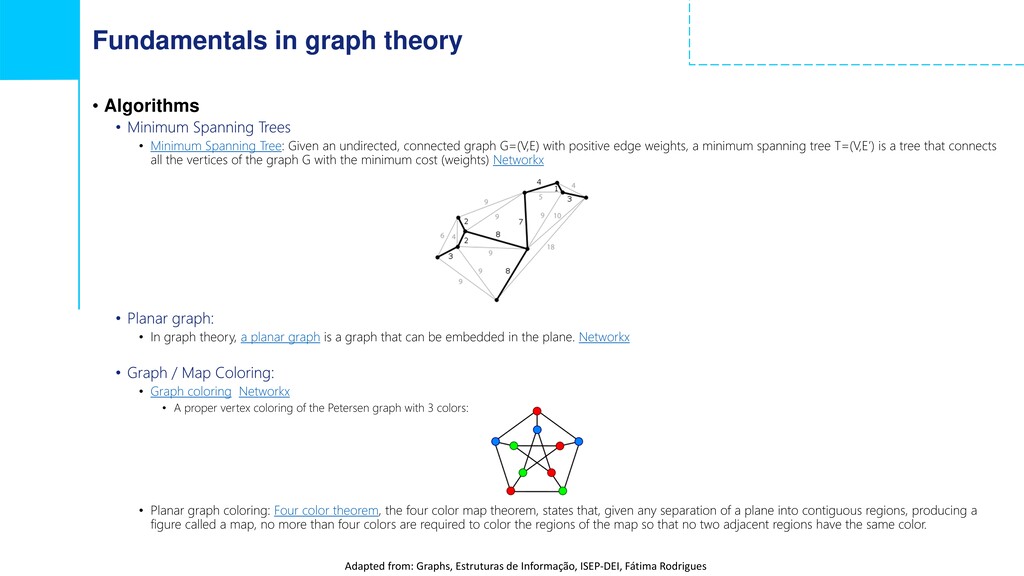
- fundamentals in graph theory, models and common network metrics
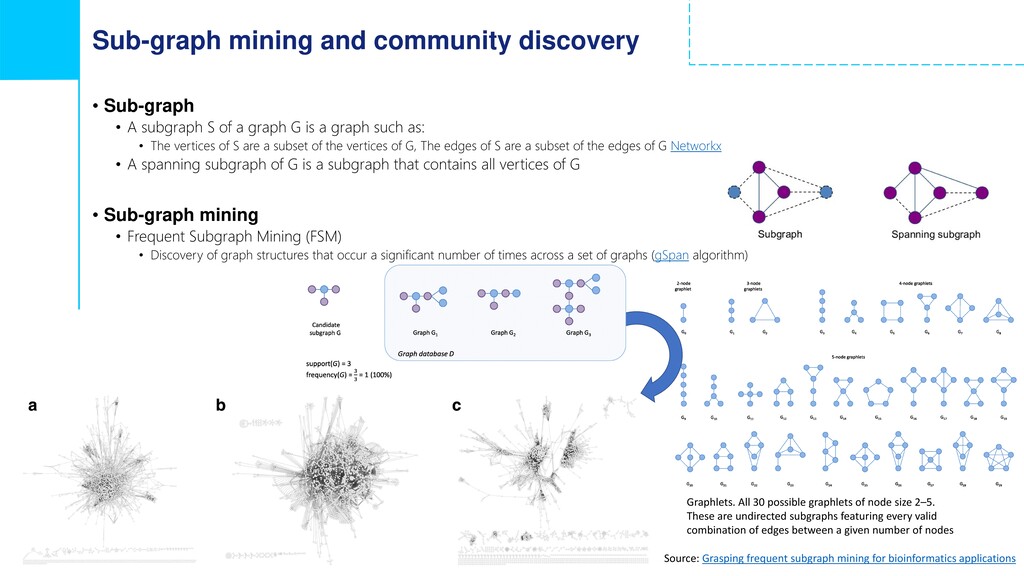
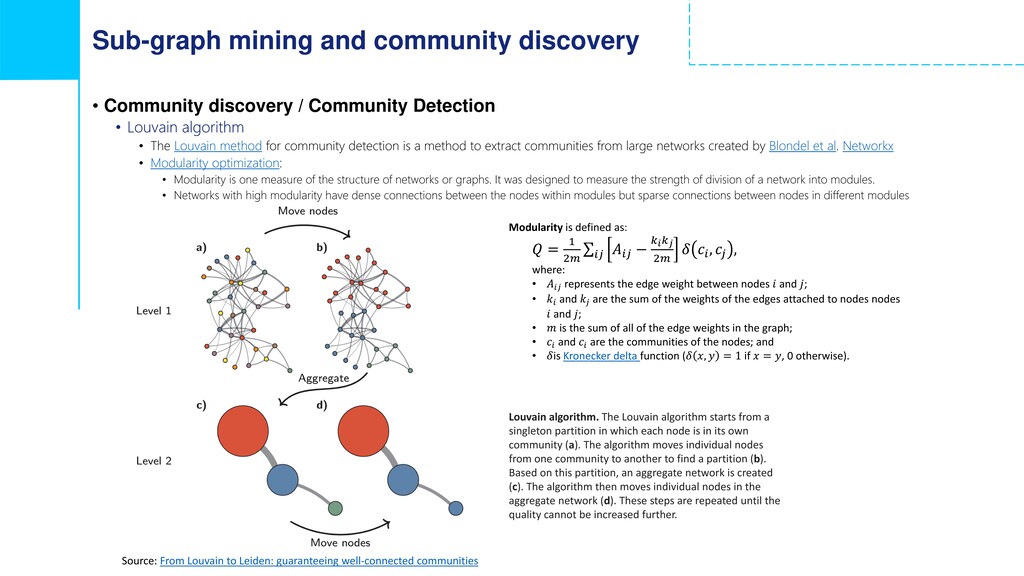
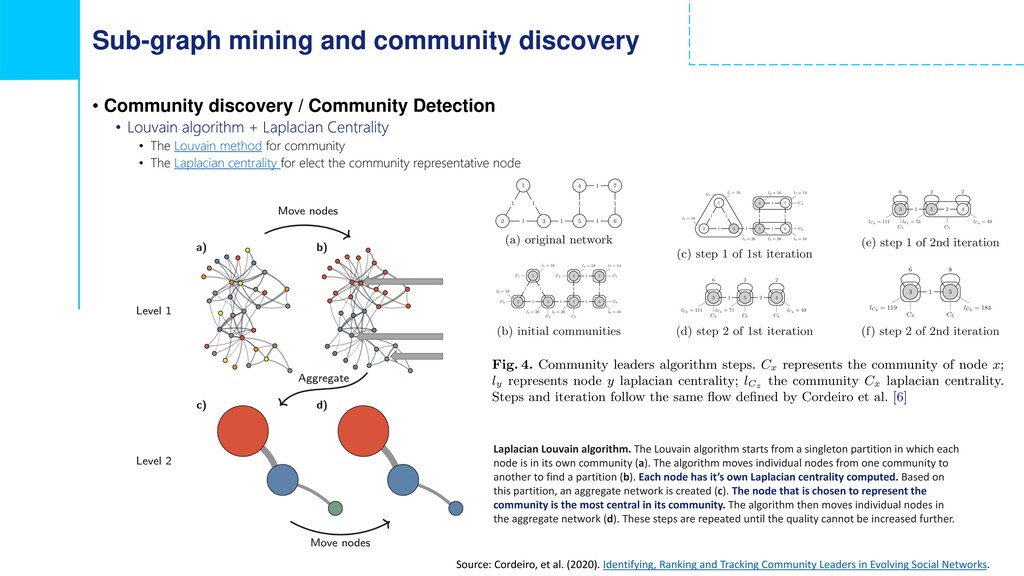
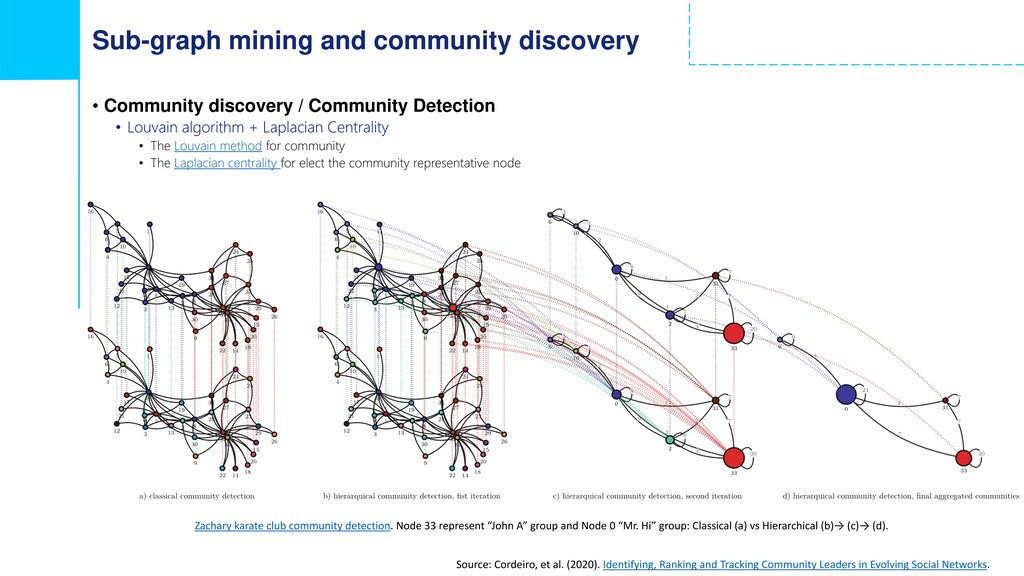
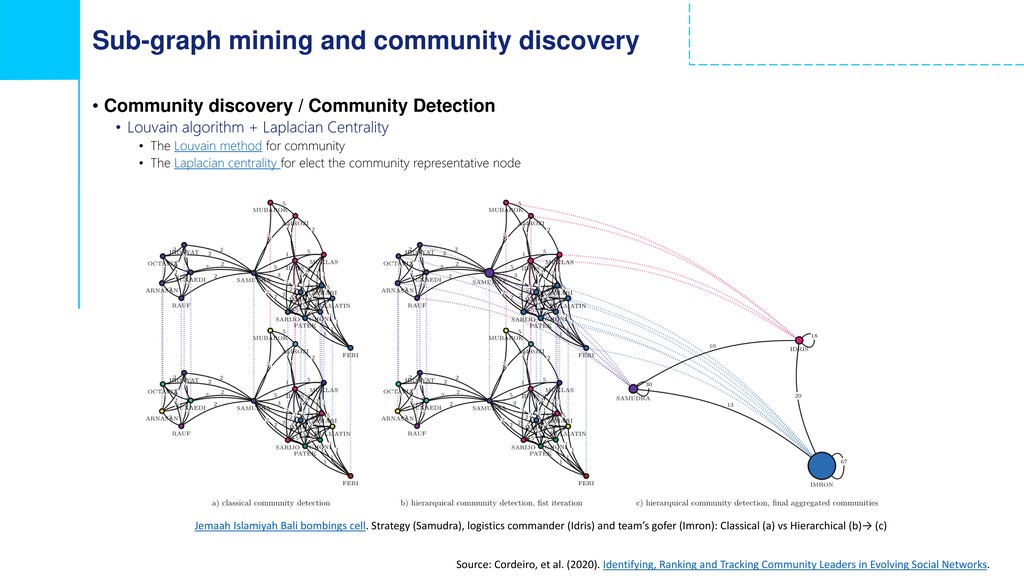
- sub-graph mining, community discovery, information cascades and the challenges of large scale network analysis
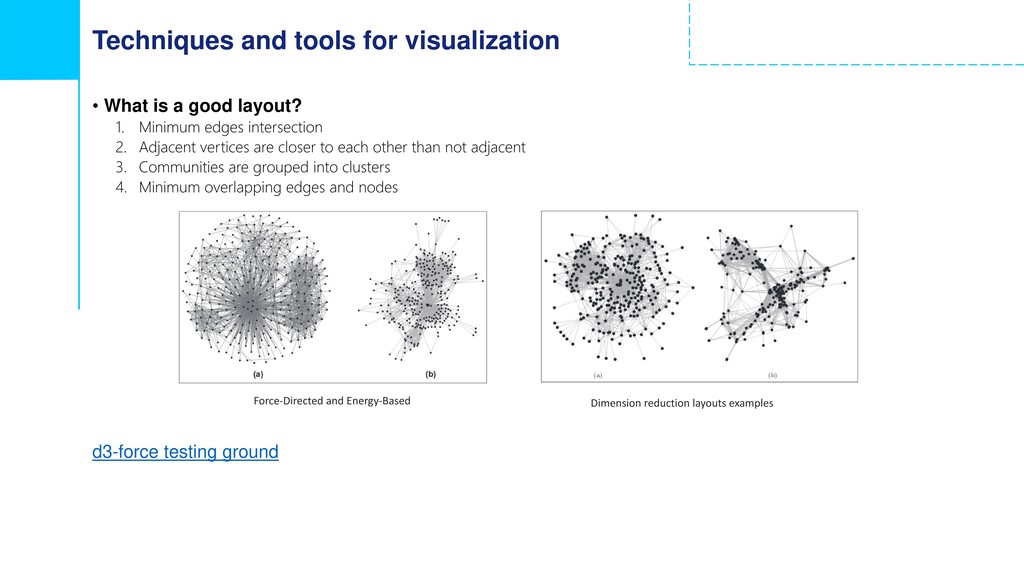
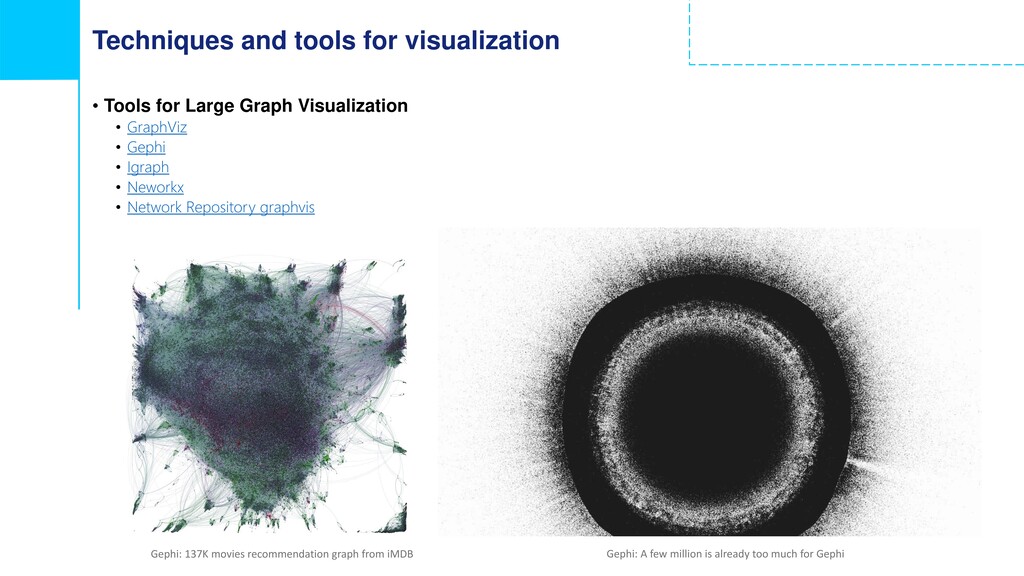
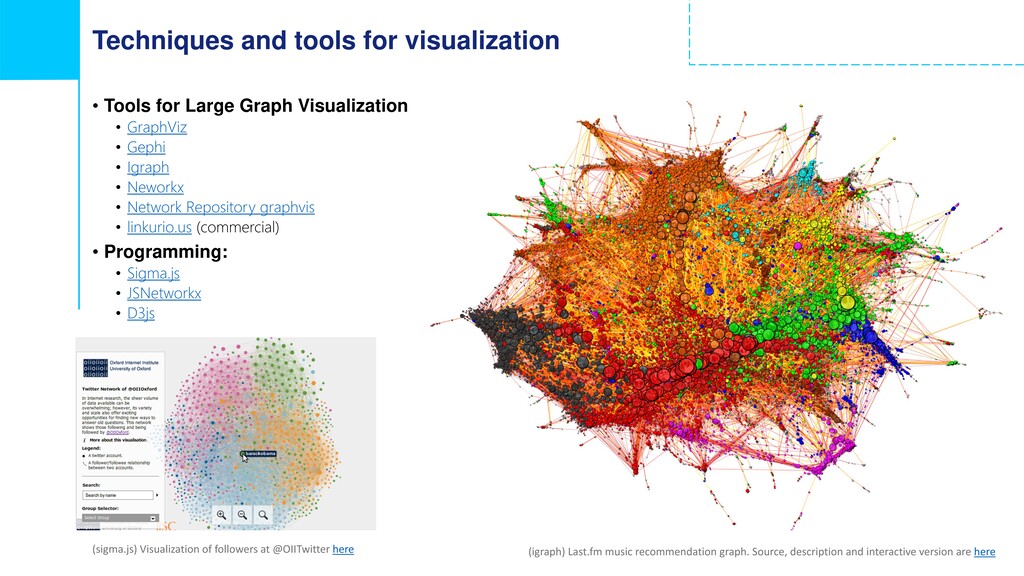
- techniques and tools for visualization and interpret large networks
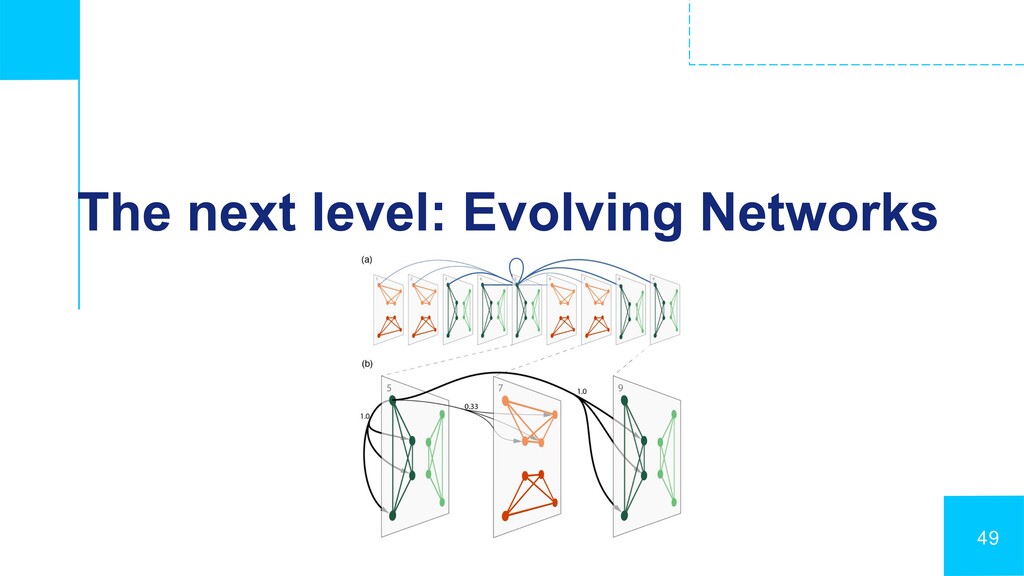
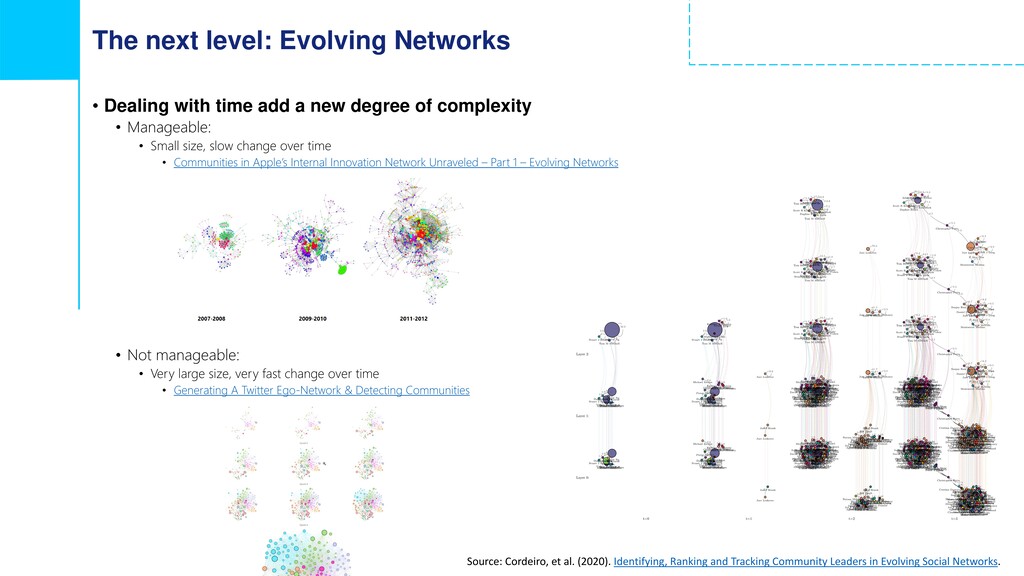
- next level: what about networks that evolve over time?
What is not:
- a complete course on Network Analysis. If you insist in get one, just go for Jure Leskovec, Lada Adamic, etc.
- a Python evangelistic session: tools and algorithms presented are just my own recommendations for this session exercises
- definitive solutions for the presented exercises, network problems can get hard to solve when scaling and adding the temporal dimension
What you should have:
- your favourite browser: we will use mainly colab.research.google.com for the exercises
- basic Python and JavaScript skills
- paper and pencil, drawing and sketching basic skills: nothing better to understand network problems than starting drawing and paying with small network toy examples
- motivation to learn new stuff
![Do you have any questions? [email protected] 05 5 #cmfempoweryourskills](https://files.speakerdeck.com/presentations/d58bf1f697974ce5b875787f42fb37b4/slide_54.jpg)