ML-assisted Listing and Search backend. Chin-Ming Huang Software engineer at Mercari since 2019, primarily focusing on ML price and Search backend. Mohit Pokharna
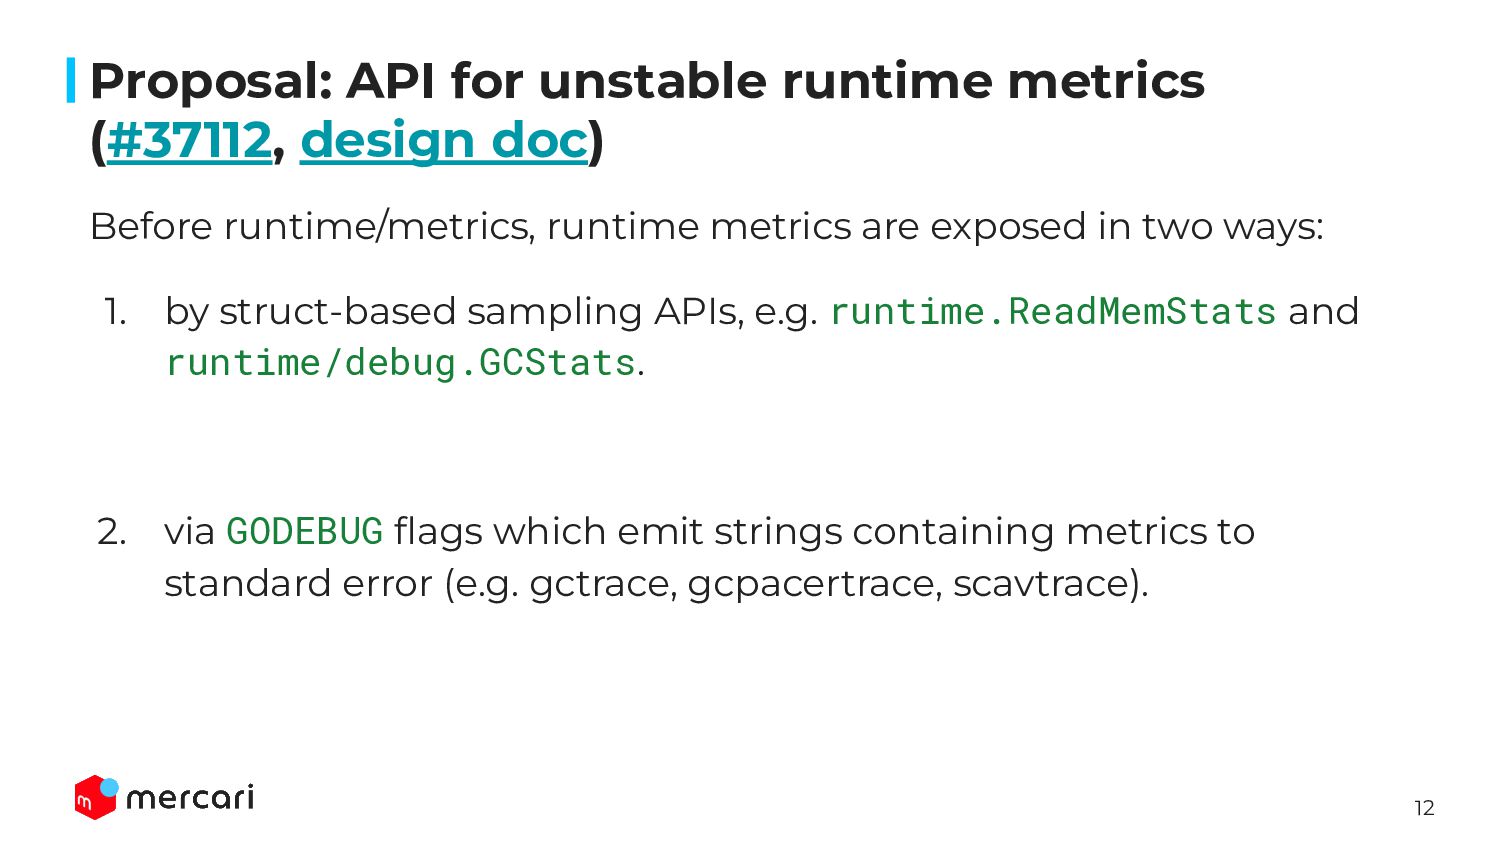
Before runtime/metrics, runtime metrics are exposed in two ways: 1. by struct-based sampling APIs, e.g. runtime.ReadMemStats and runtime/debug.GCStats. 2. via GODEBUG flags which emit strings containing metrics to standard error (e.g. gctrace, gcpacertrace, scavtrace).
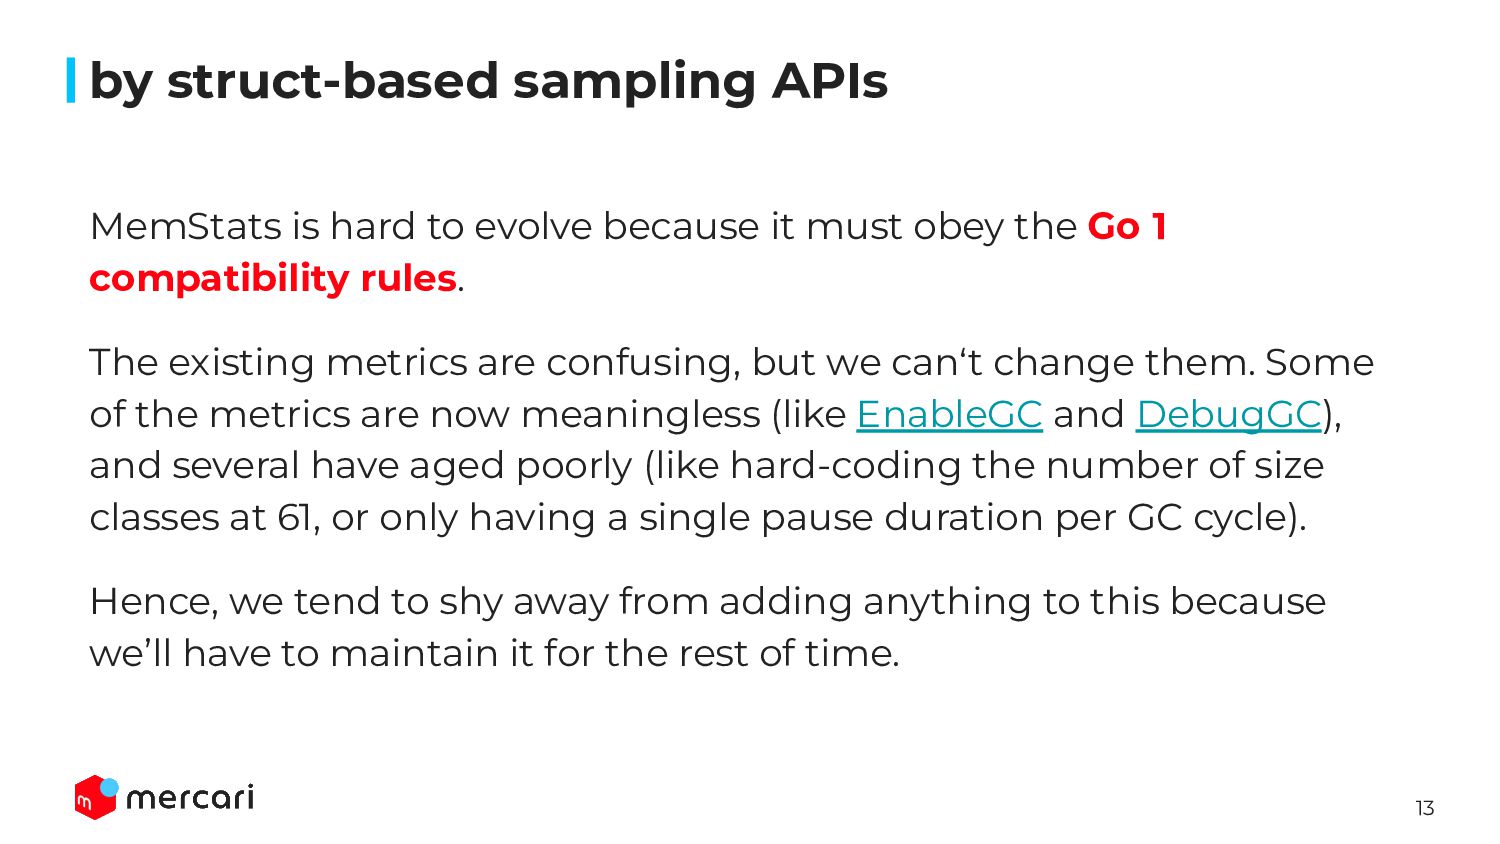
the Go 1 compatibility rules. The existing metrics are confusing, but we can‘t change them. Some of the metrics are now meaningless (like EnableGC and DebugGC), and several have aged poorly (like hard-coding the number of size classes at 61, or only having a single pause duration per GC cycle). Hence, we tend to shy away from adding anything to this because we’ll have to maintain it for the rest of time. by struct-based sampling APIs
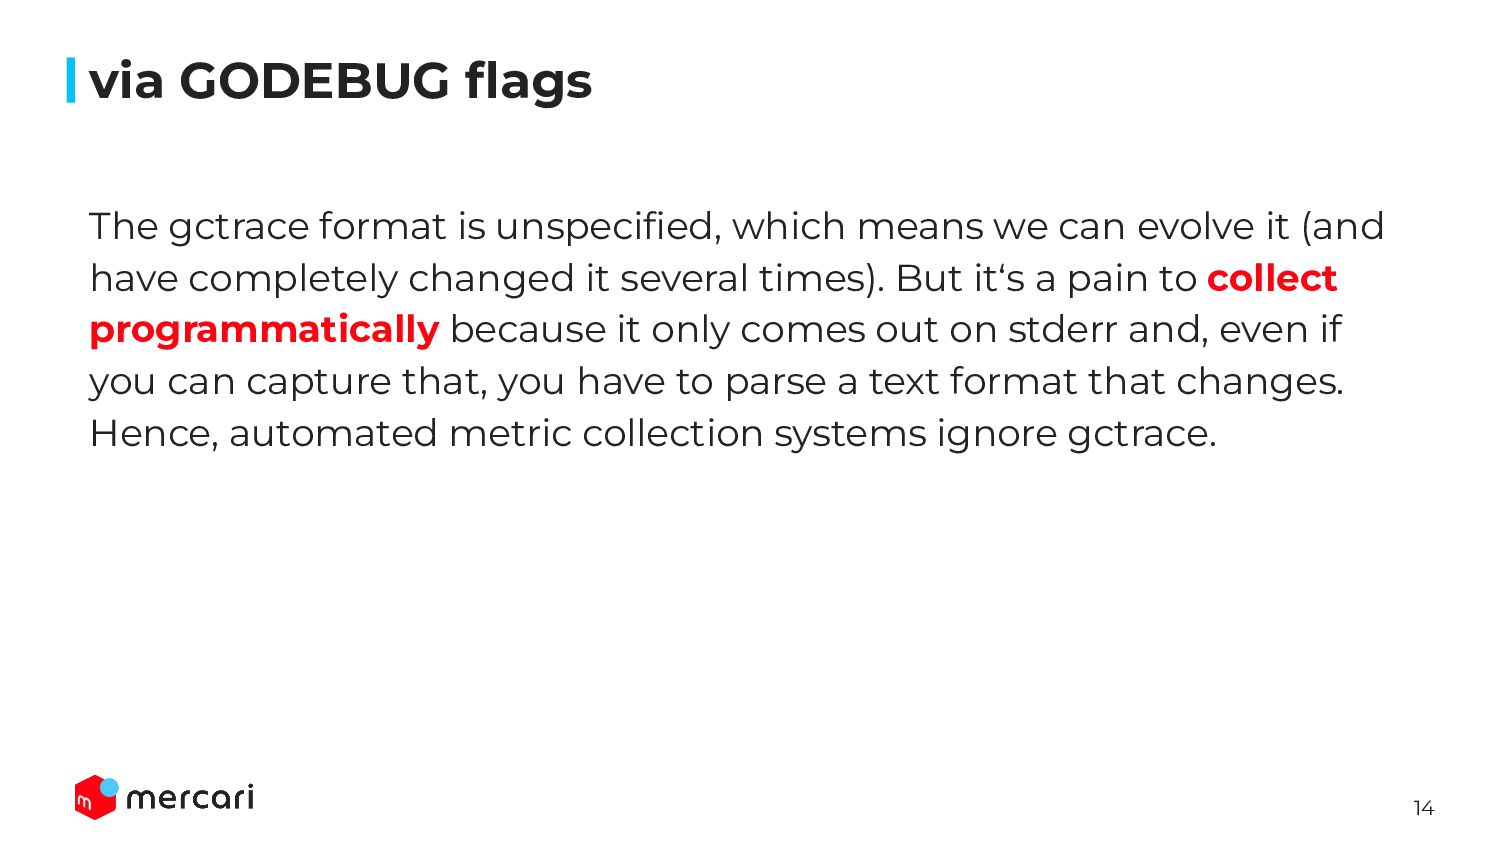
evolve it (and have completely changed it several times). But it‘s a pain to collect programmatically because it only comes out on stderr and, even if you can capture that, you have to parse a text format that changes. Hence, automated metric collection systems ignore gctrace. via GODEBUG flags
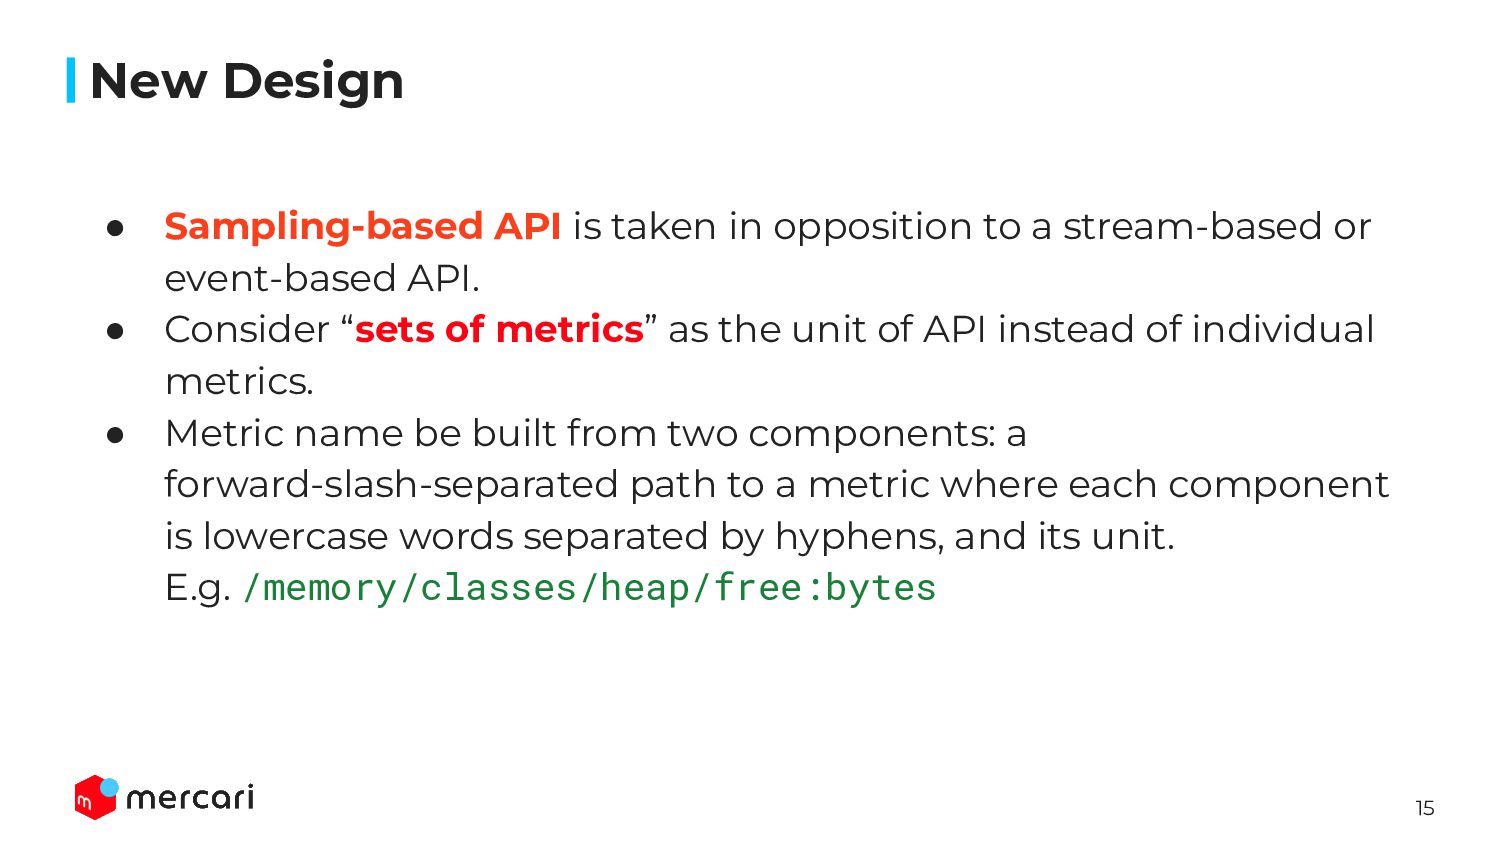
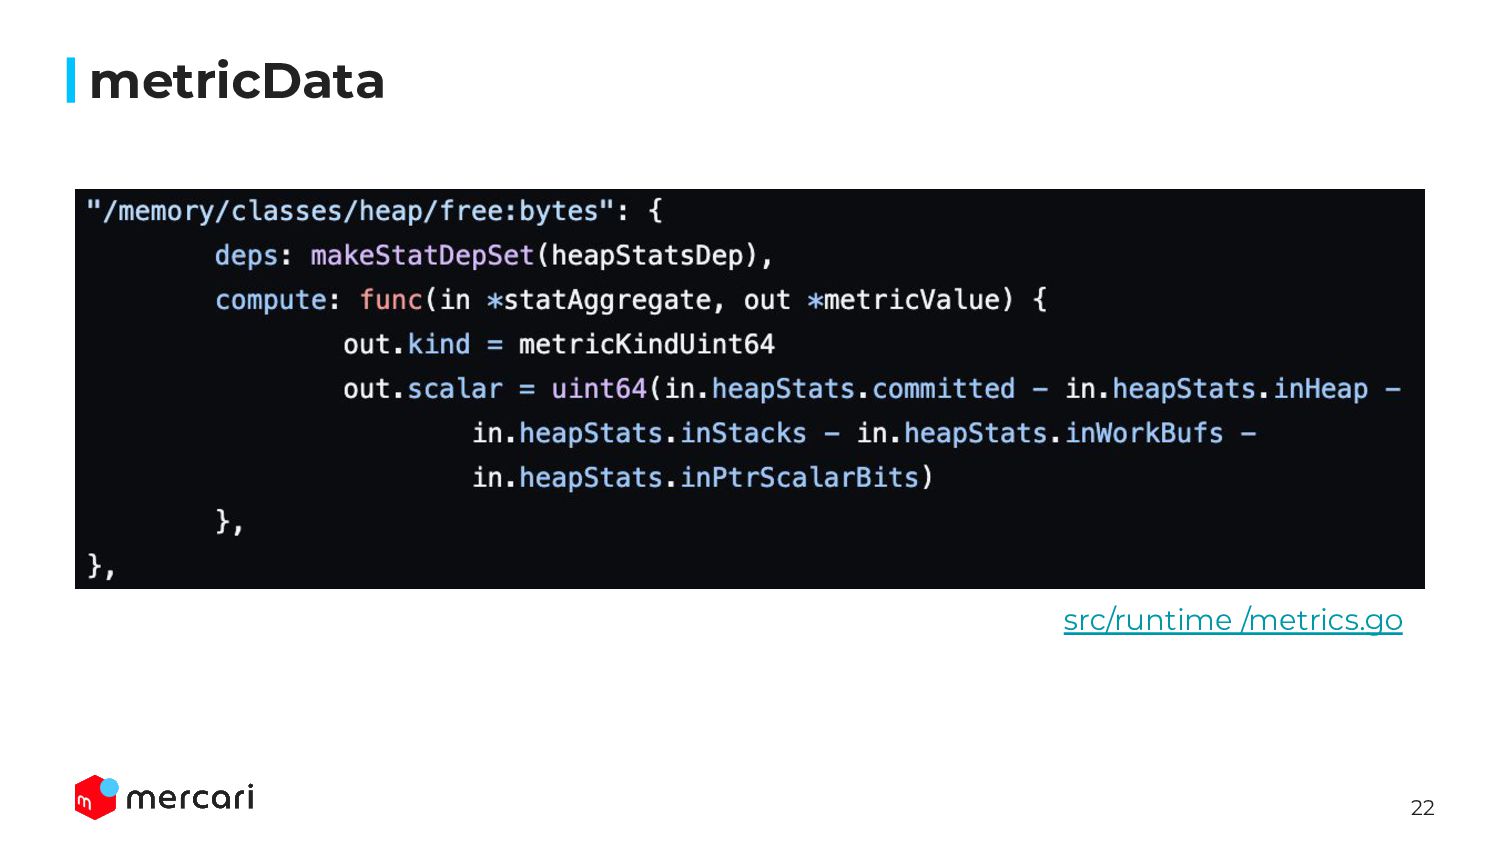
stream-based or event-based API. • Consider “sets of metrics” as the unit of API instead of individual metrics. • Metric name be built from two components: a forward-slash-separated path to a metric where each component is lowercase words separated by hyphens, and its unit. E.g. /memory/classes/heap/free:bytes New Design
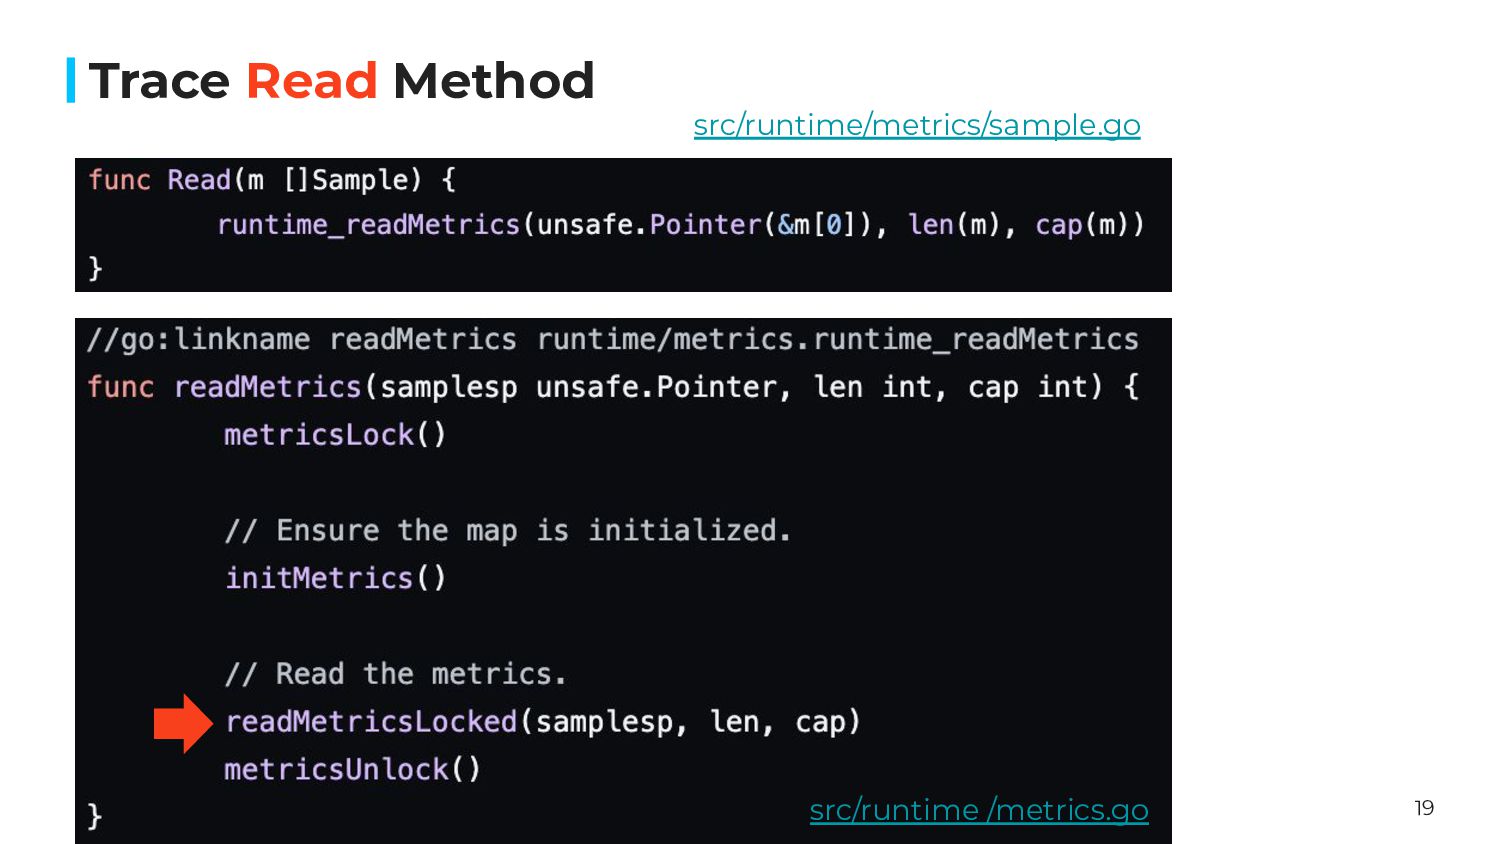
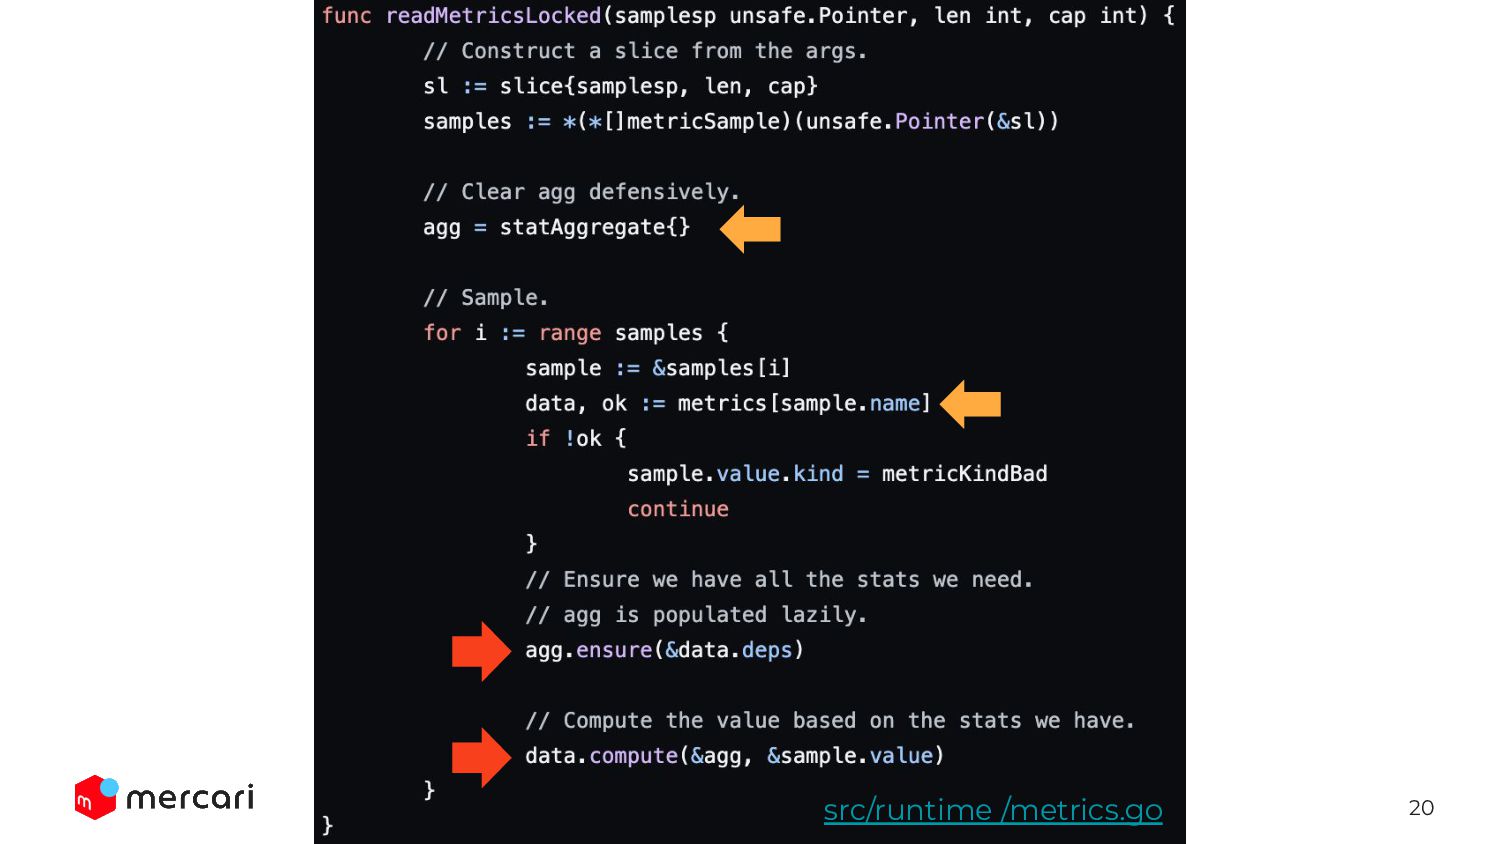
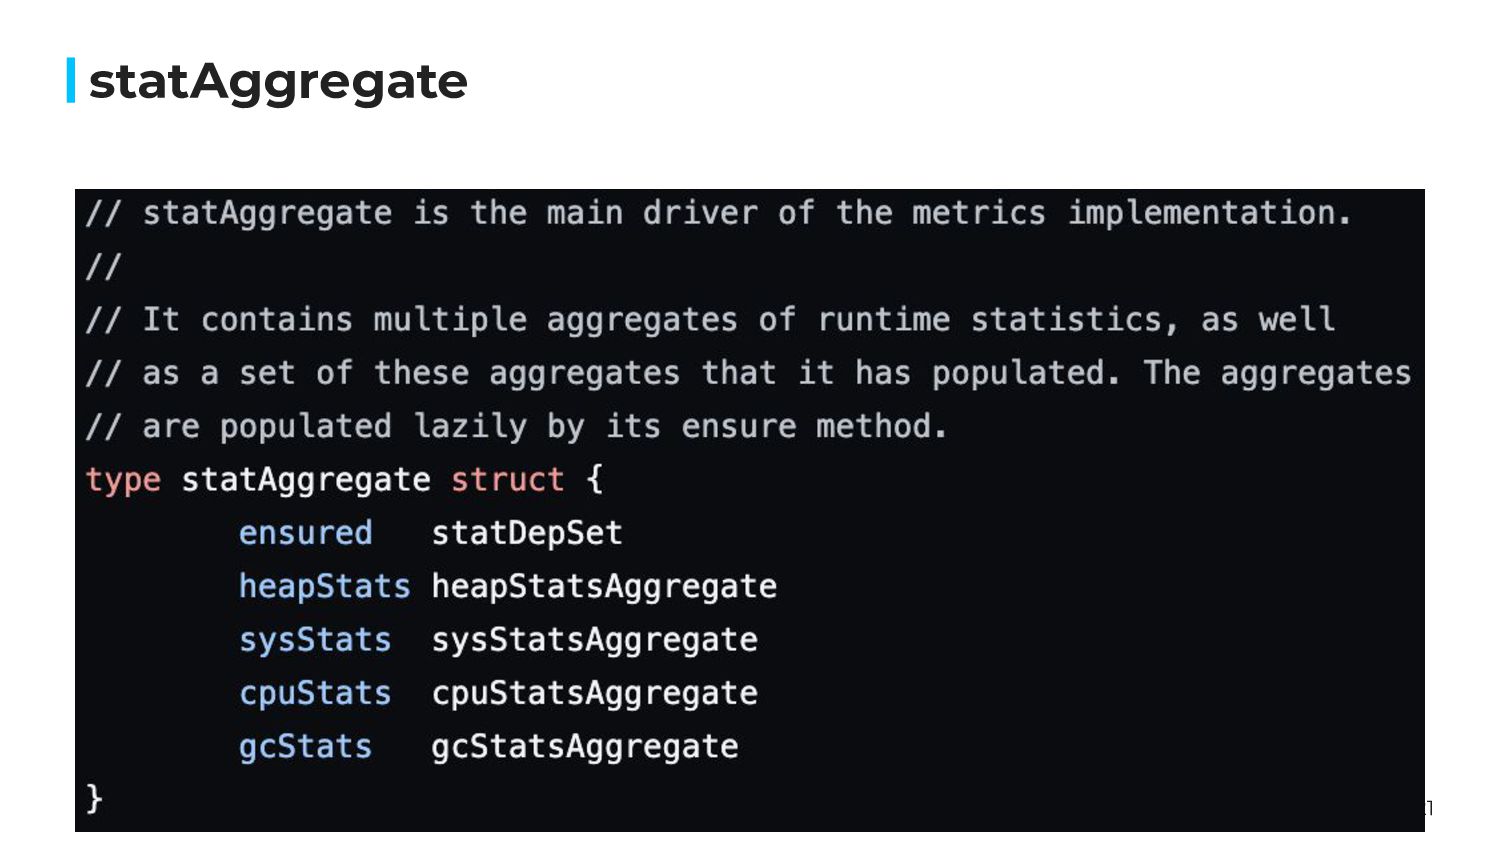
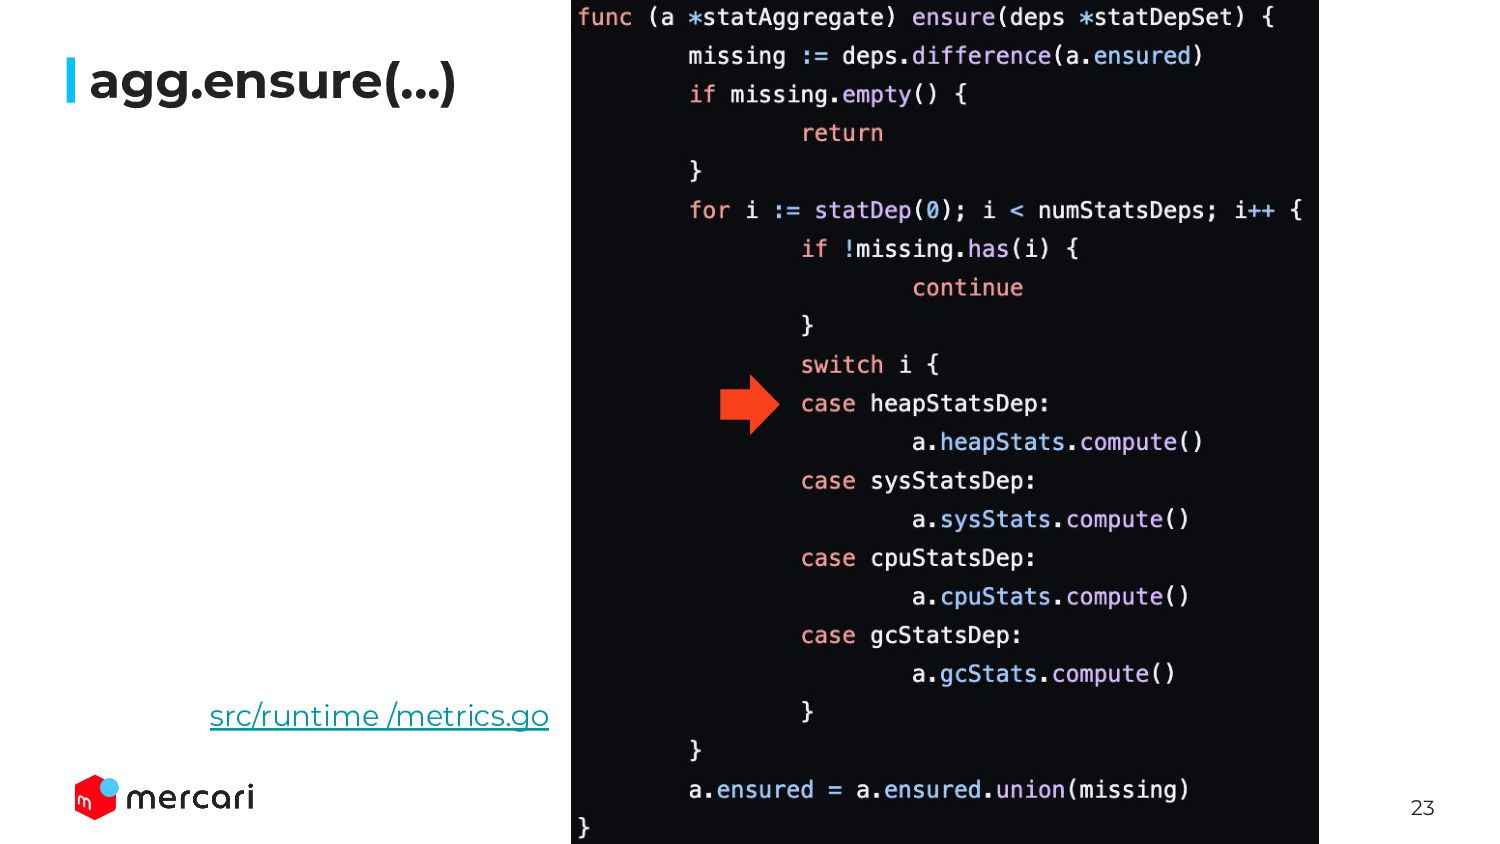
metrics, including heap, sys, cpu and gc stats. • Underneath, each metric is corrected from different part of runtime, so 2 steps are performed for metrics reading: ensure & compute. Remarks
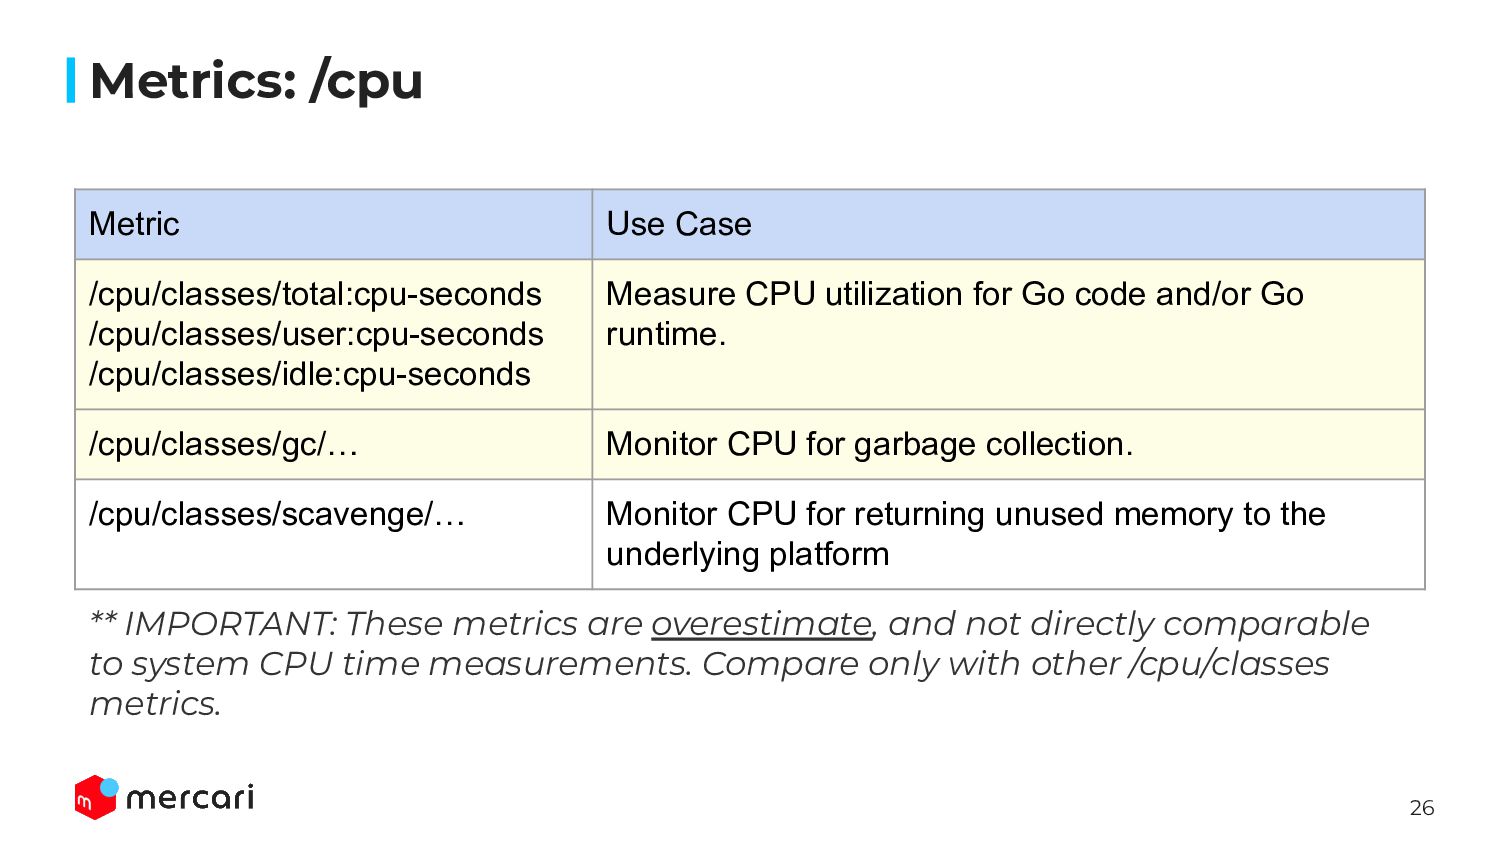
CPU utilization for Go code and/or Go runtime. /cpu/classes/gc/… Monitor CPU for garbage collection. /cpu/classes/scavenge/… Monitor CPU for returning unused memory to the underlying platform ** IMPORTANT: These metrics are overestimate, and not directly comparable to system CPU time measurements. Compare only with other /cpu/classes metrics.
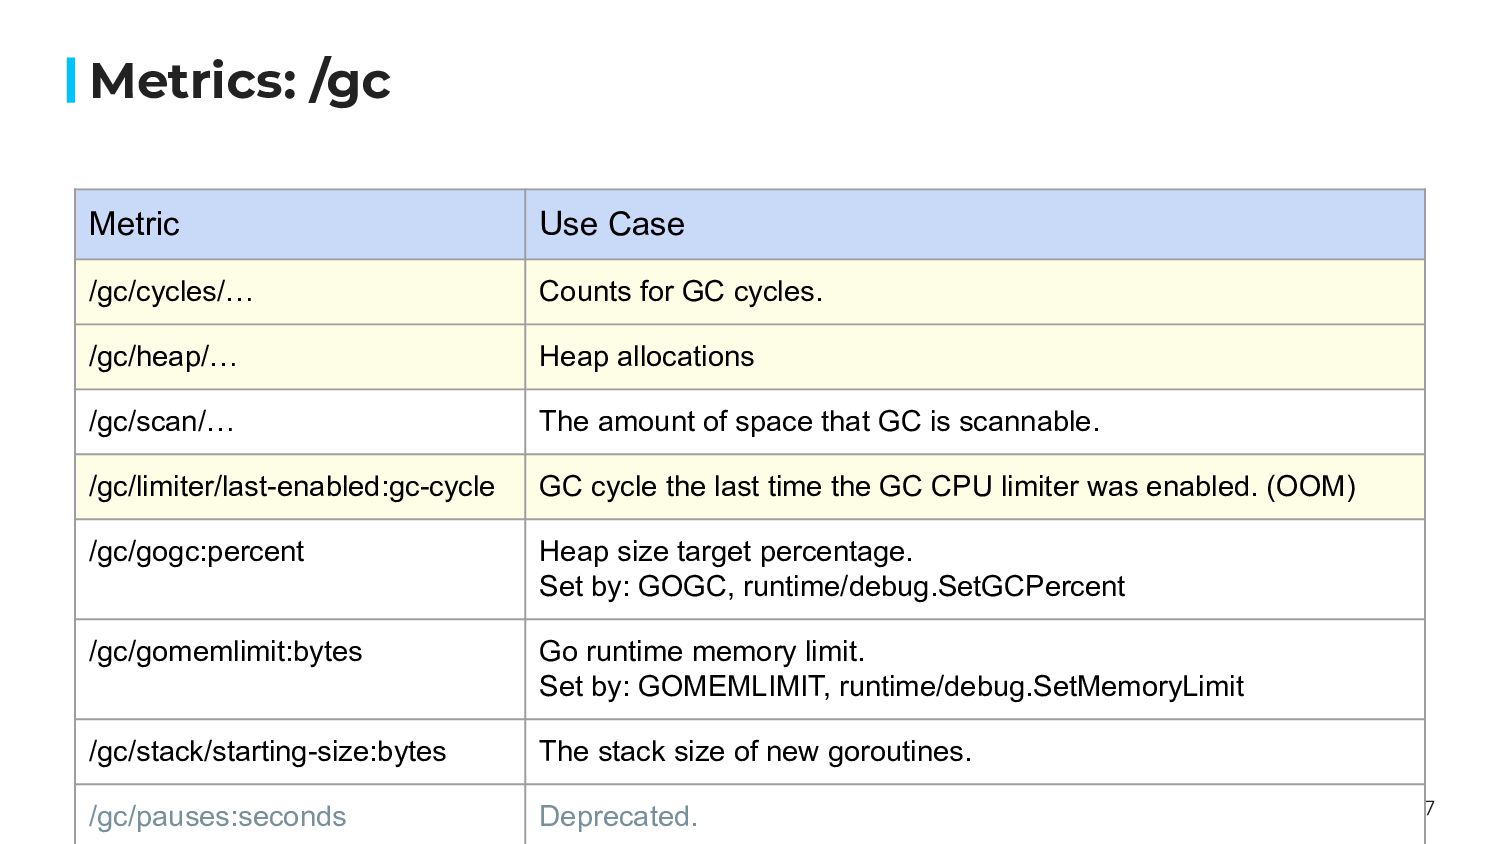
cycles. /gc/heap/… Heap allocations /gc/scan/… The amount of space that GC is scannable. /gc/limiter/last-enabled:gc-cycle GC cycle the last time the GC CPU limiter was enabled. (OOM) /gc/gogc:percent Heap size target percentage. Set by: GOGC, runtime/debug.SetGCPercent /gc/gomemlimit:bytes Go runtime memory limit. Set by: GOMEMLIMIT, runtime/debug.SetMemoryLimit /gc/stack/starting-size:bytes The stack size of new goroutines. /gc/pauses:seconds Deprecated.
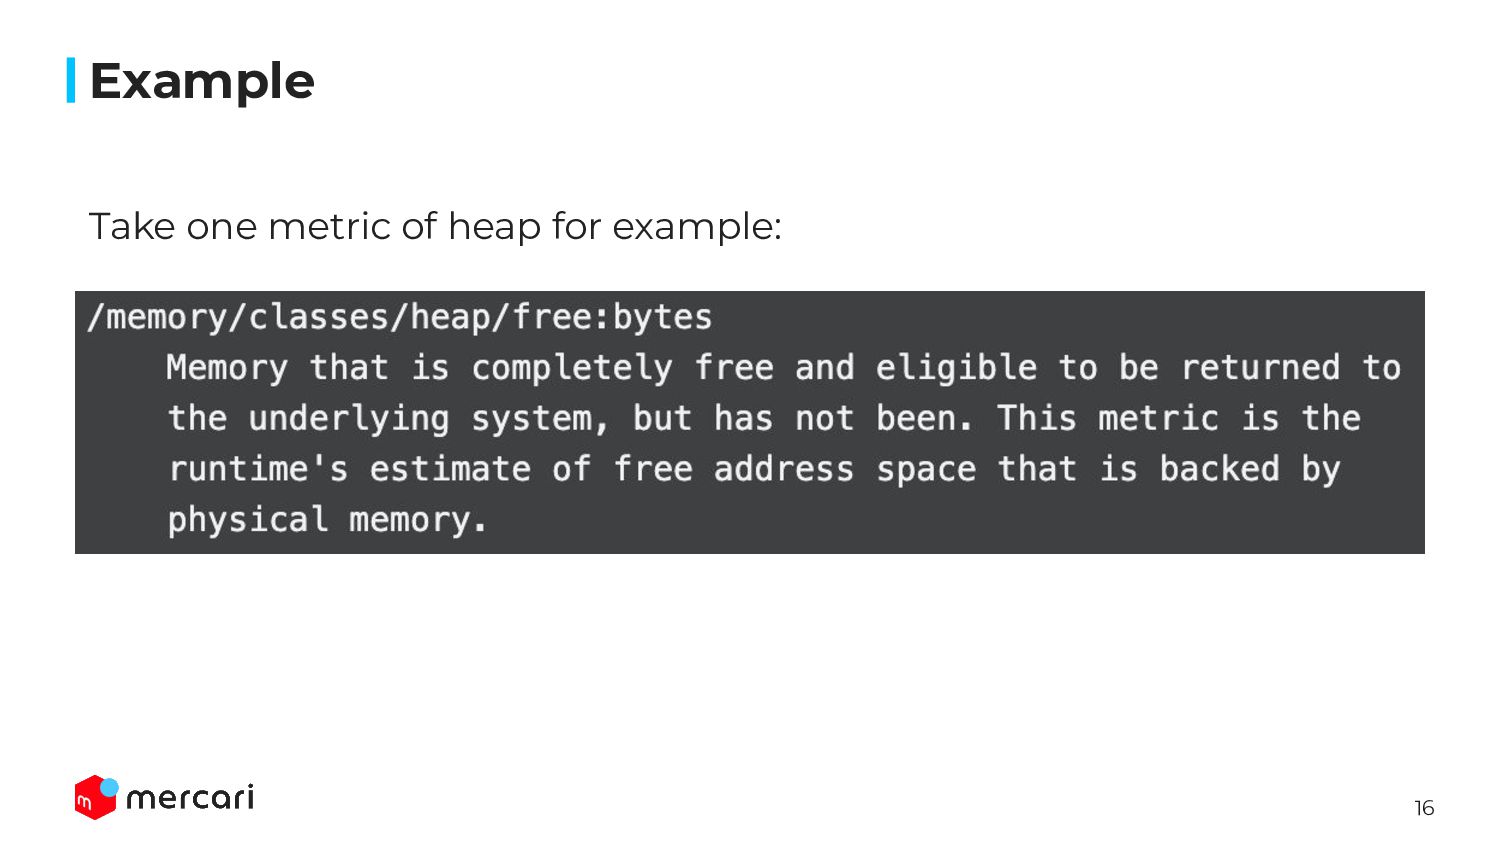
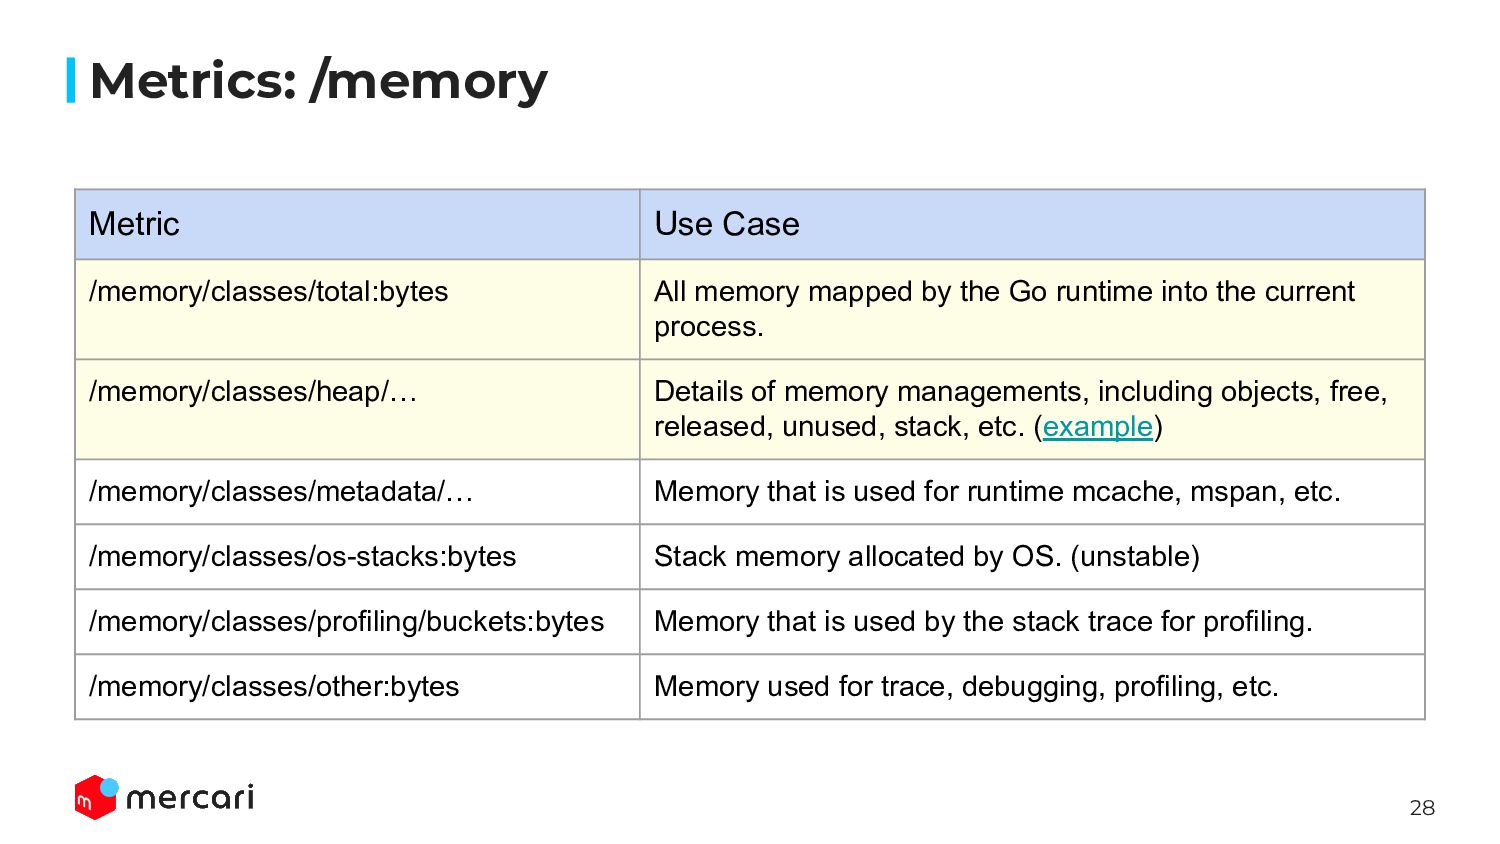
by the Go runtime into the current process. /memory/classes/heap/… Details of memory managements, including objects, free, released, unused, stack, etc. (example) /memory/classes/metadata/… Memory that is used for runtime mcache, mspan, etc. /memory/classes/os-stacks:bytes Stack memory allocated by OS. (unstable) /memory/classes/profiling/buckets:bytes Memory that is used by the stack trace for profiling. /memory/classes/other:bytes Memory used for trace, debugging, profiling, etc.
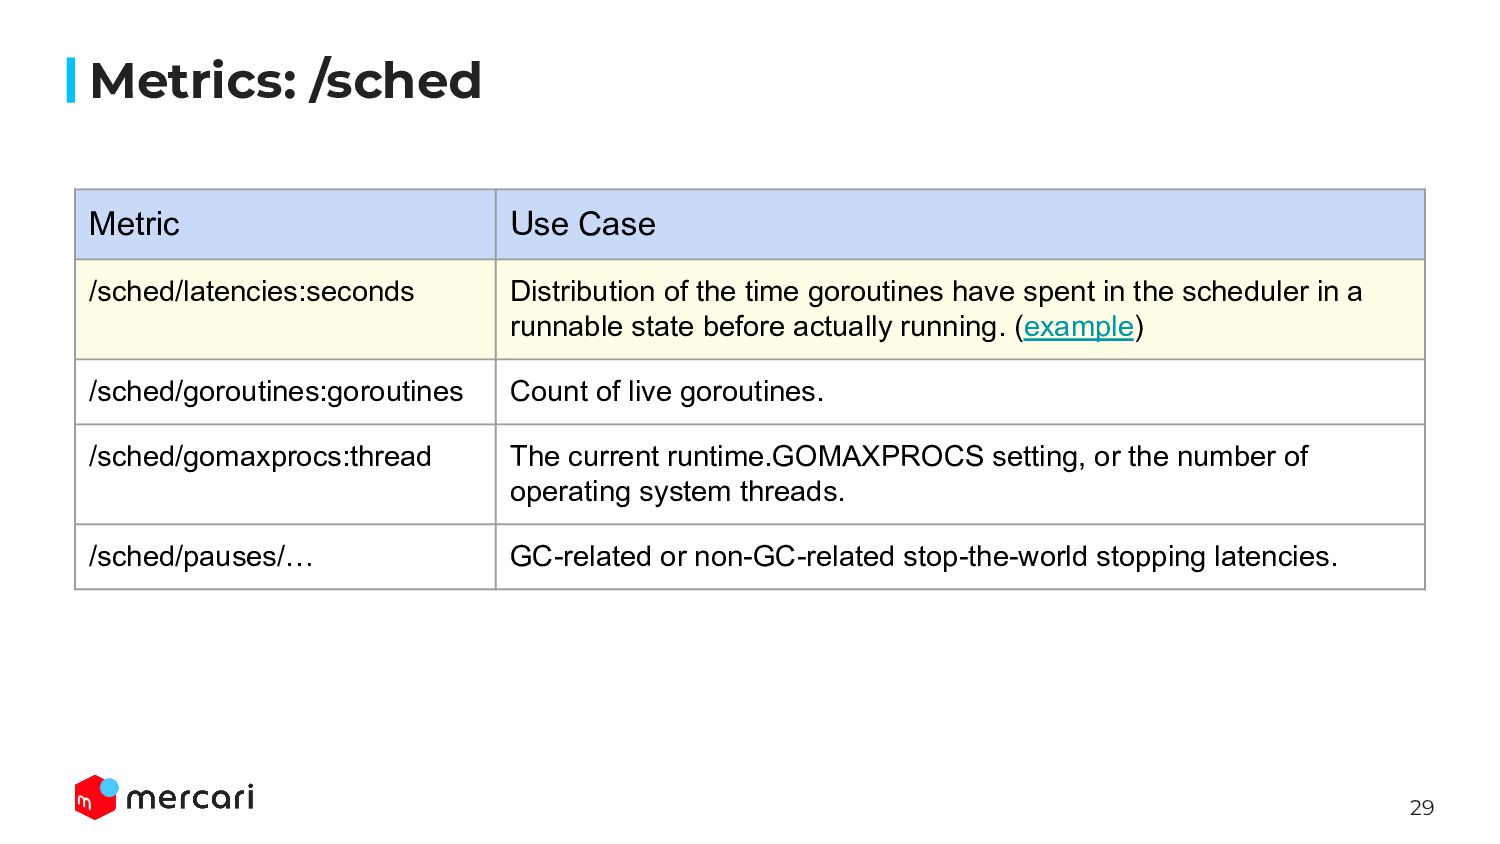
time goroutines have spent in the scheduler in a runnable state before actually running. (example) /sched/goroutines:goroutines Count of live goroutines. /sched/gomaxprocs:thread The current runtime.GOMAXPROCS setting, or the number of operating system threads. /sched/pauses/… GC-related or non-GC-related stop-the-world stopping latencies.
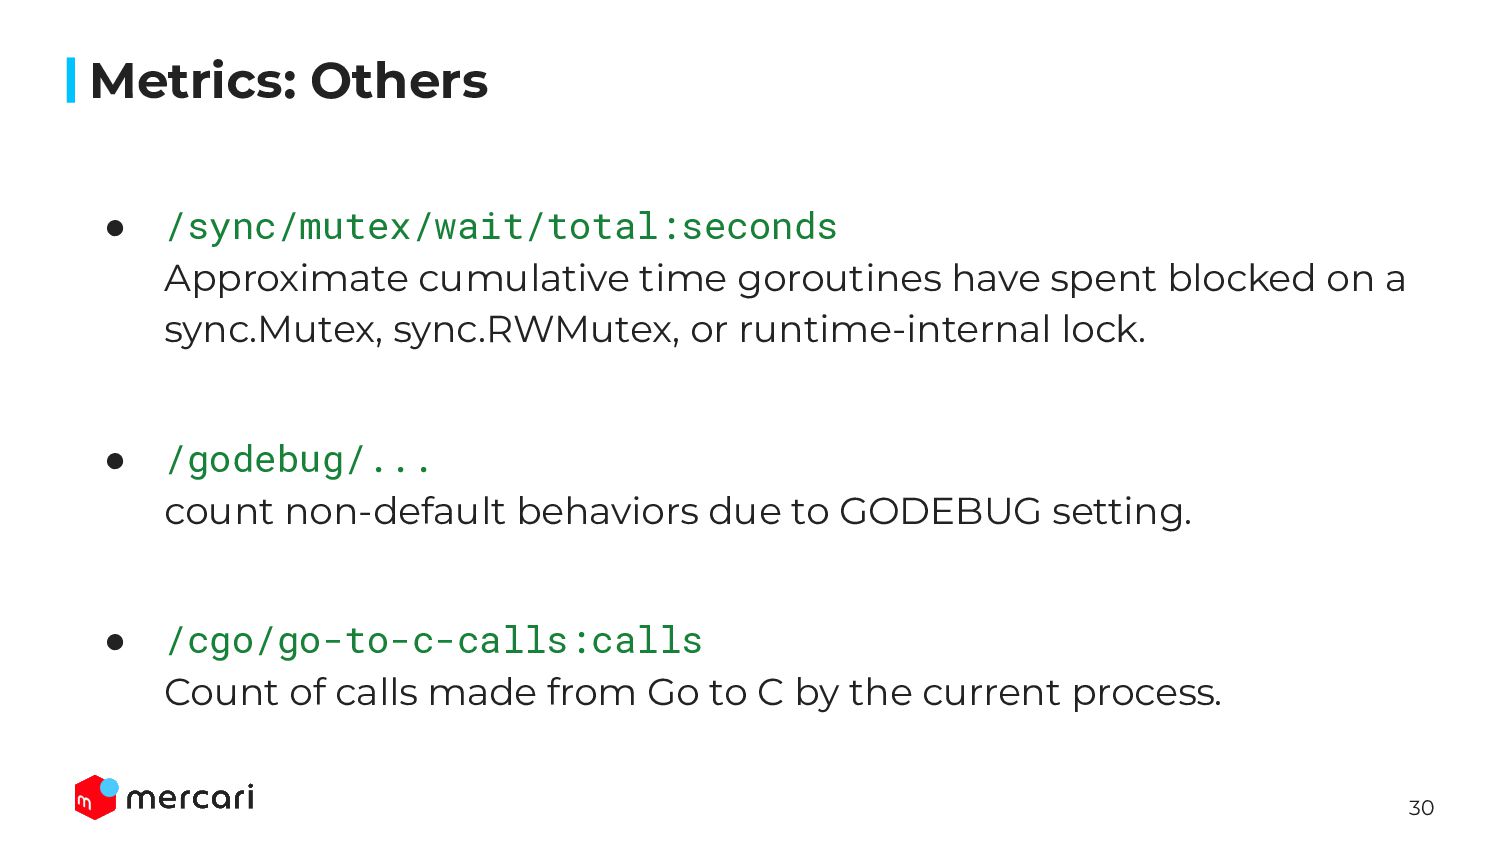
on a sync.Mutex, sync.RWMutex, or runtime-internal lock. • /godebug/... count non-default behaviors due to GODEBUG setting. • /cgo/go-to-c-calls:calls Count of calls made from Go to C by the current process. Metrics: Others