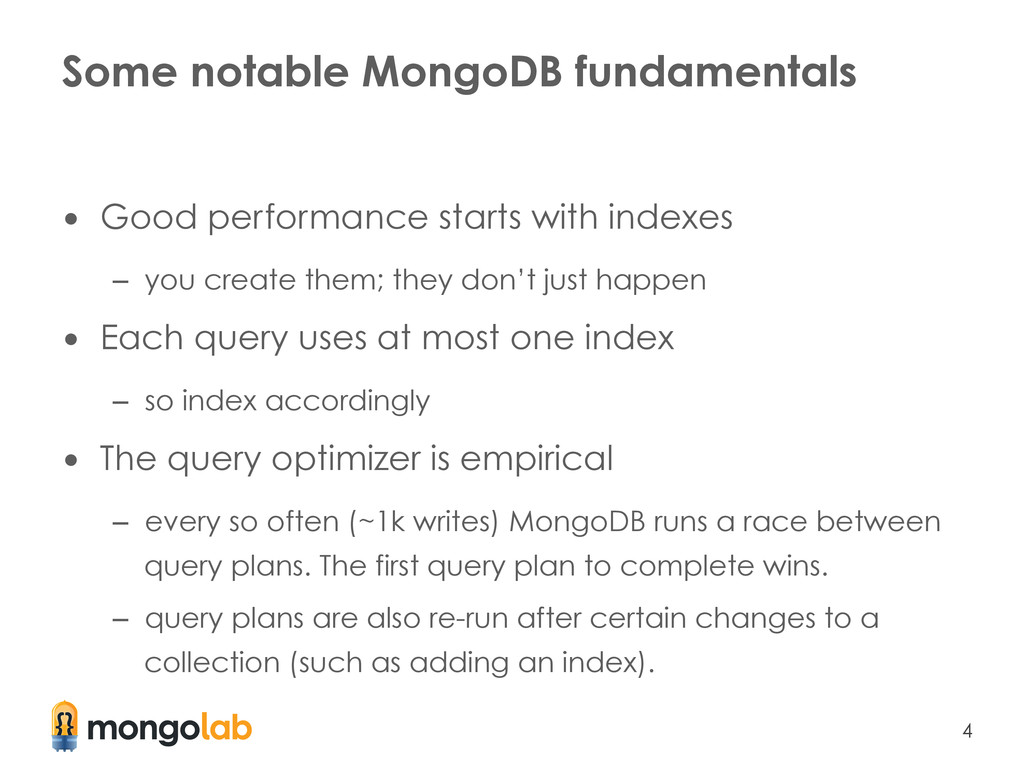
indexes – you create them; they don’t just happen • Each query uses at most one index – so index accordingly • The query optimizer is empirical – every so often (~1k writes) MongoDB runs a race between query plans. The first query plan to complete wins. – query plans are also re-run after certain changes to a collection (such as adding an index).
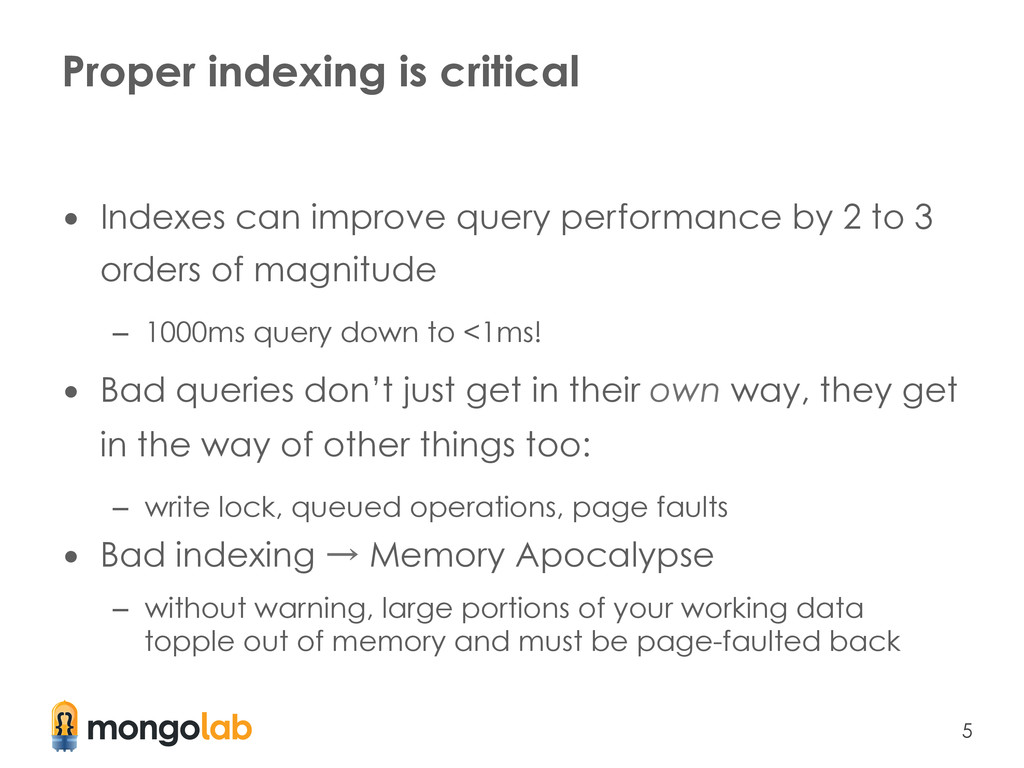
performance by 2 to 3 orders of magnitude – 1000ms query down to <1ms! • Bad queries don’t just get in their own way, they get in the way of other things too: – write lock, queued operations, page faults • Bad indexing → Memory Apocalypse – without warning, large portions of your working data topple out of memory and must be page-faulted back
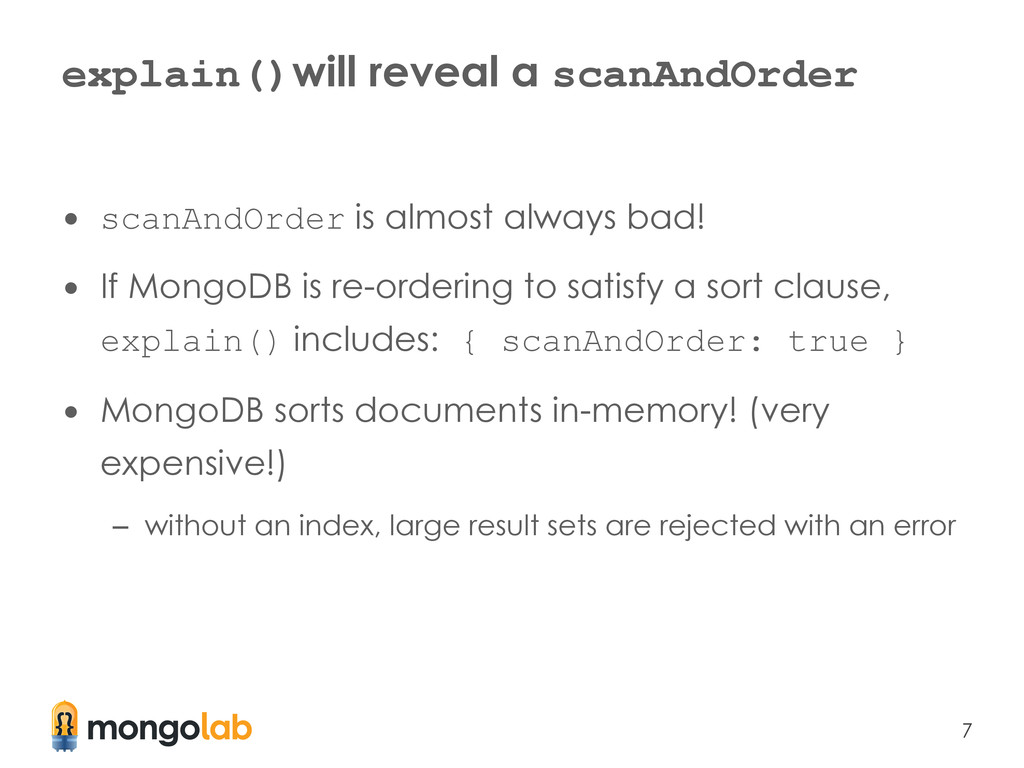
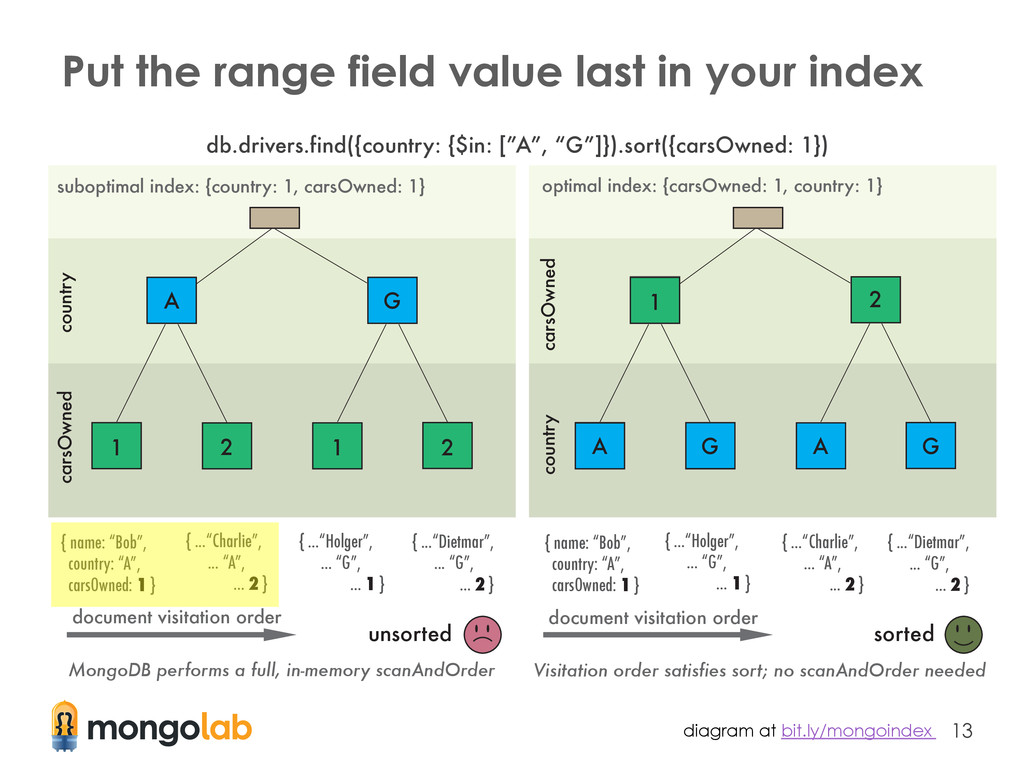
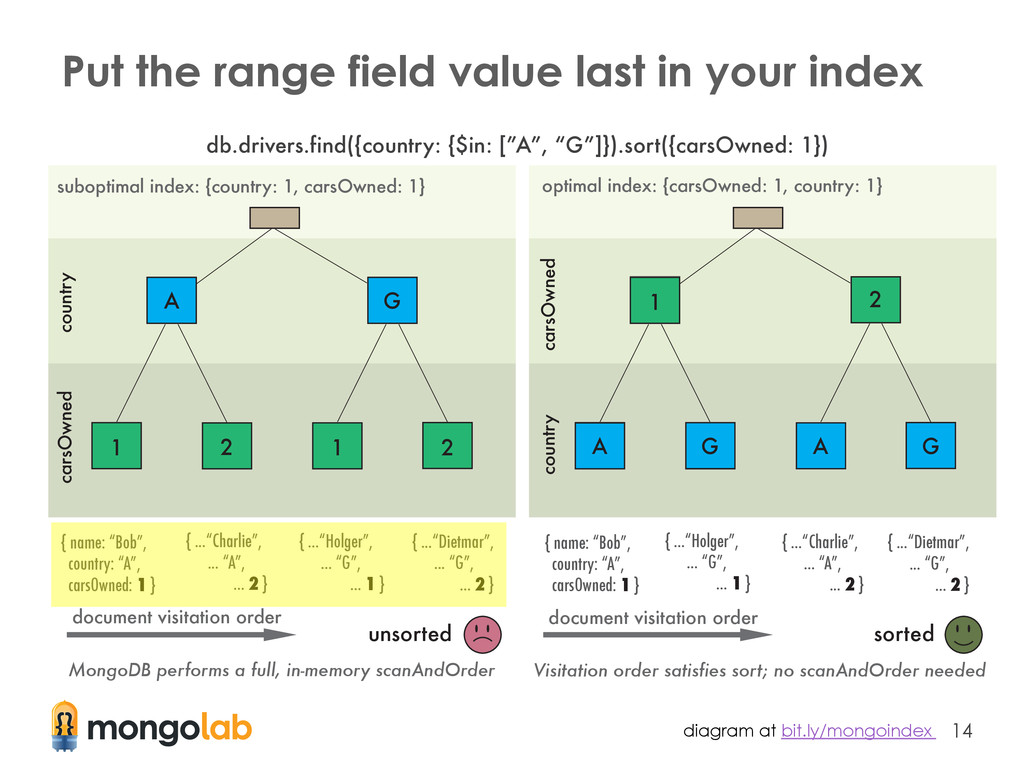
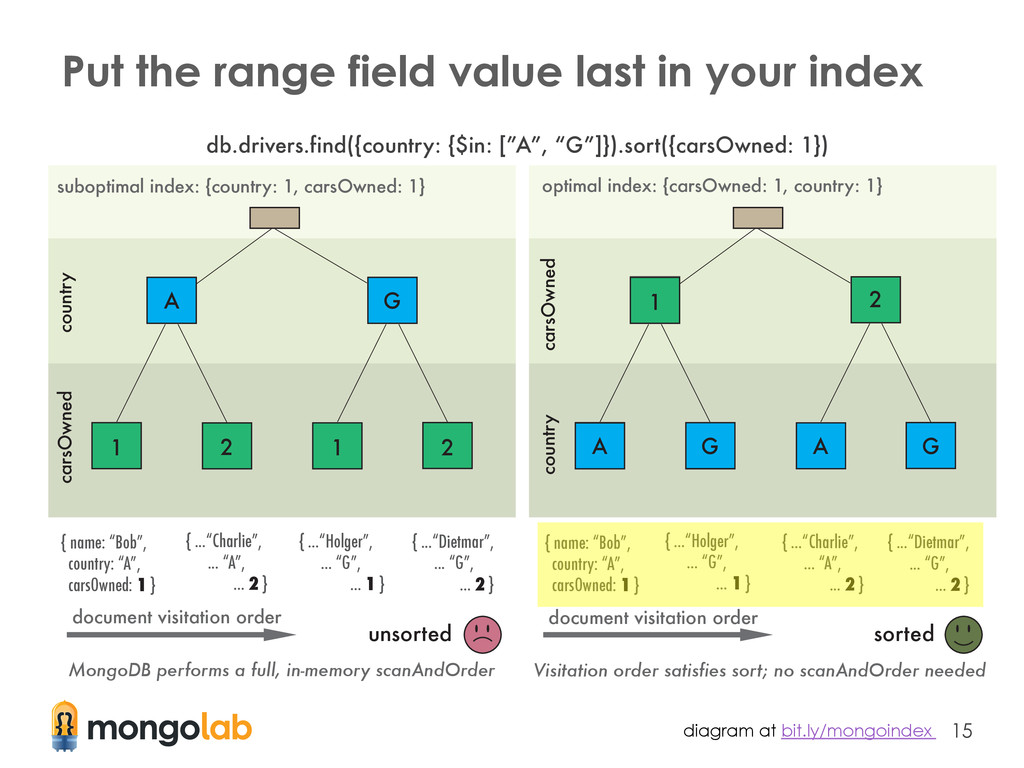
bad! • If MongoDB is re-ordering to satisfy a sort clause, explain() includes: { scanAndOrder: true } • MongoDB sorts documents in-memory! (very expensive!) – without an index, large result sets are rejected with an error
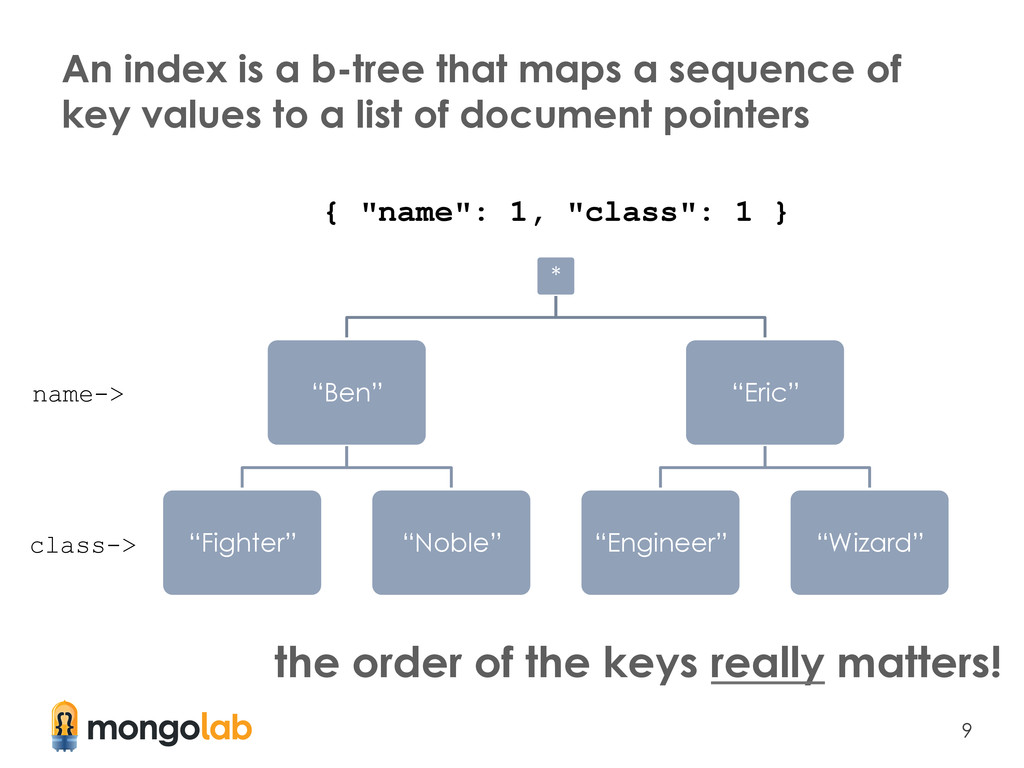
of key values to a list of document pointers * “Ben” “Fighter” “Noble” “Eric” “Engineer” “Wizard” { "name": 1, "class": 1 } name-> class-> the order of the keys really matters!
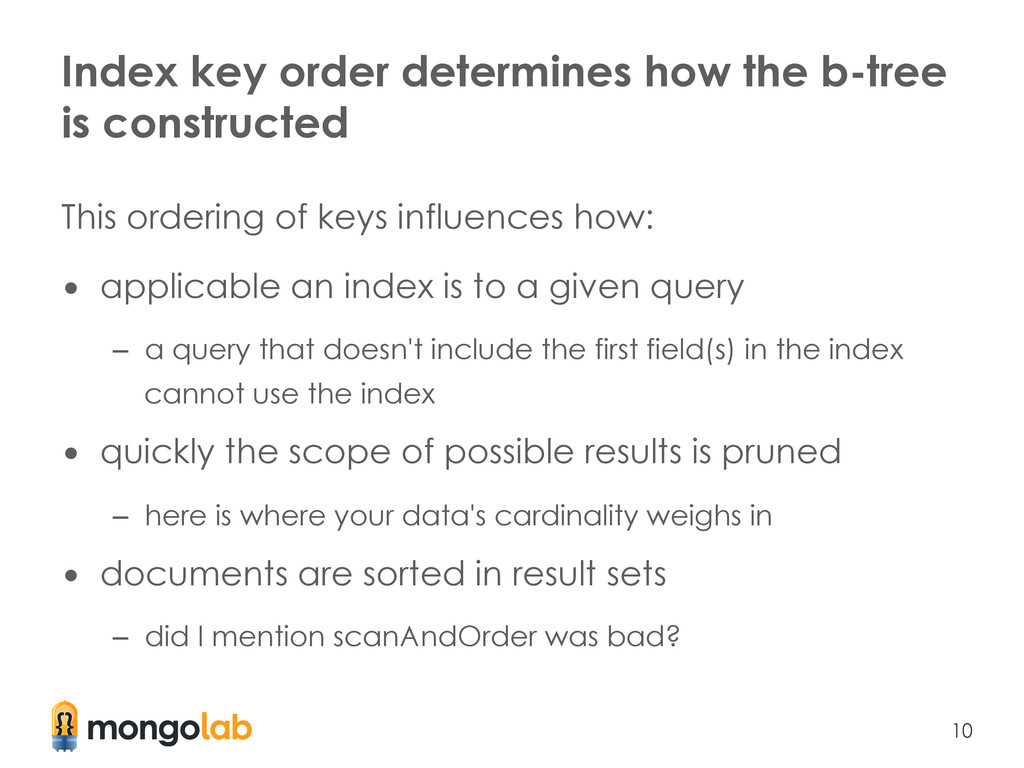
This ordering of keys influences how: • applicable an index is to a given query – a query that doesn't include the first field(s) in the index cannot use the index • quickly the scope of possible results is pruned – here is where your data's cardinality weighs in • documents are sorted in result sets – did I mention scanAndOrder was bad?
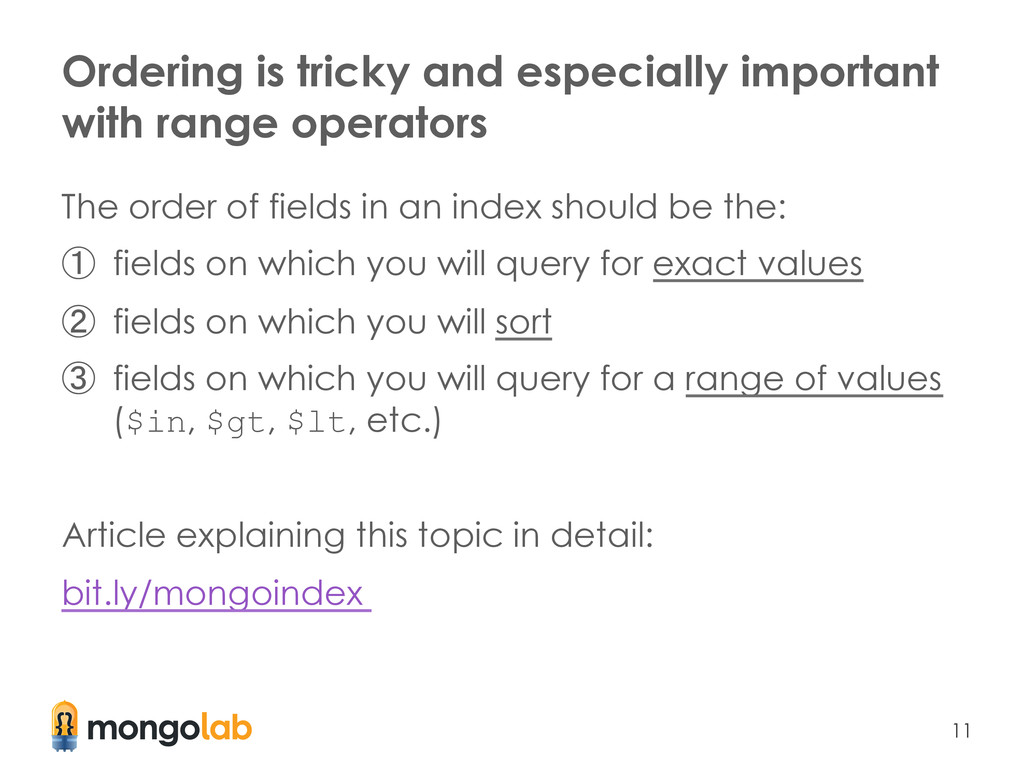
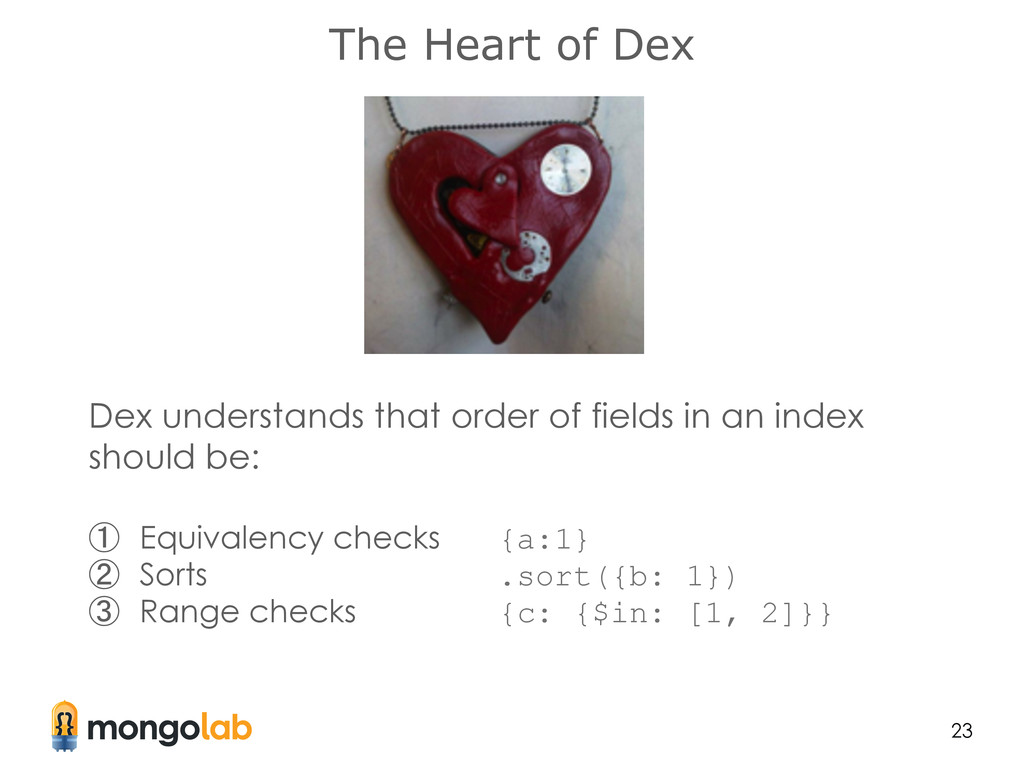
The order of fields in an index should be the: ① fields on which you will query for exact values ② fields on which you will sort ③ fields on which you will query for a range of values ($in, $gt, $lt, etc.) Article explaining this topic in detail: bit.ly/mongoindex
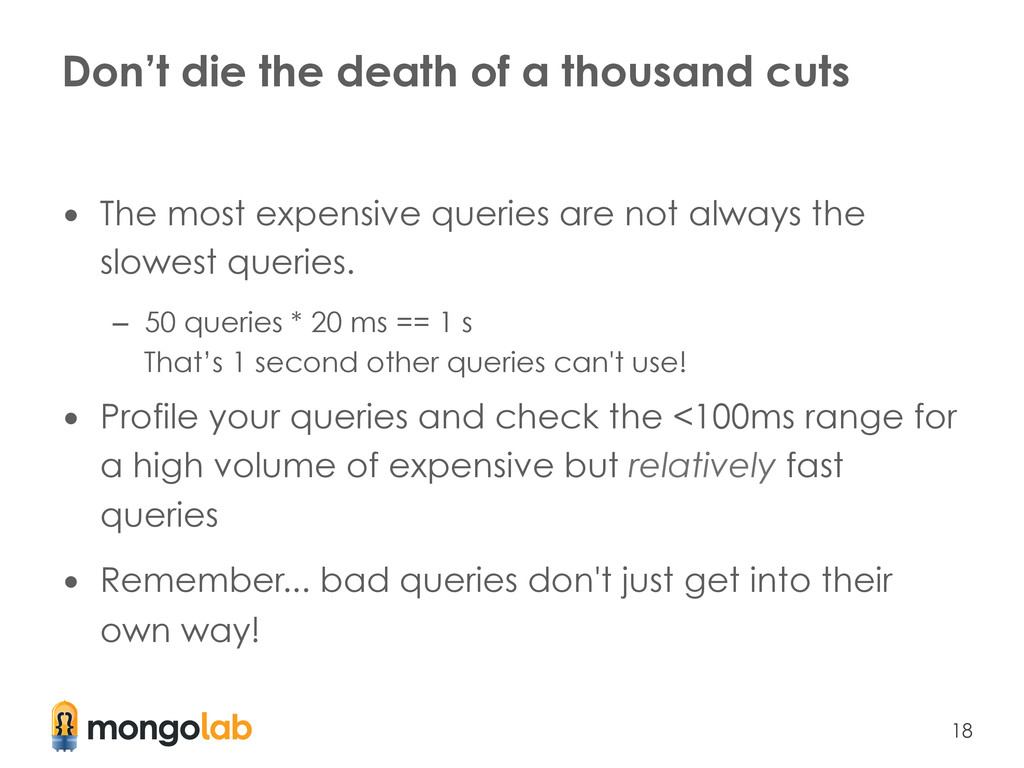
The most expensive queries are not always the slowest queries. – 50 queries * 20 ms == 1 s That’s 1 second other queries can't use! • Profile your queries and check the <100ms range for a high volume of expensive but relatively fast queries • Remember... bad queries don't just get into their own way!
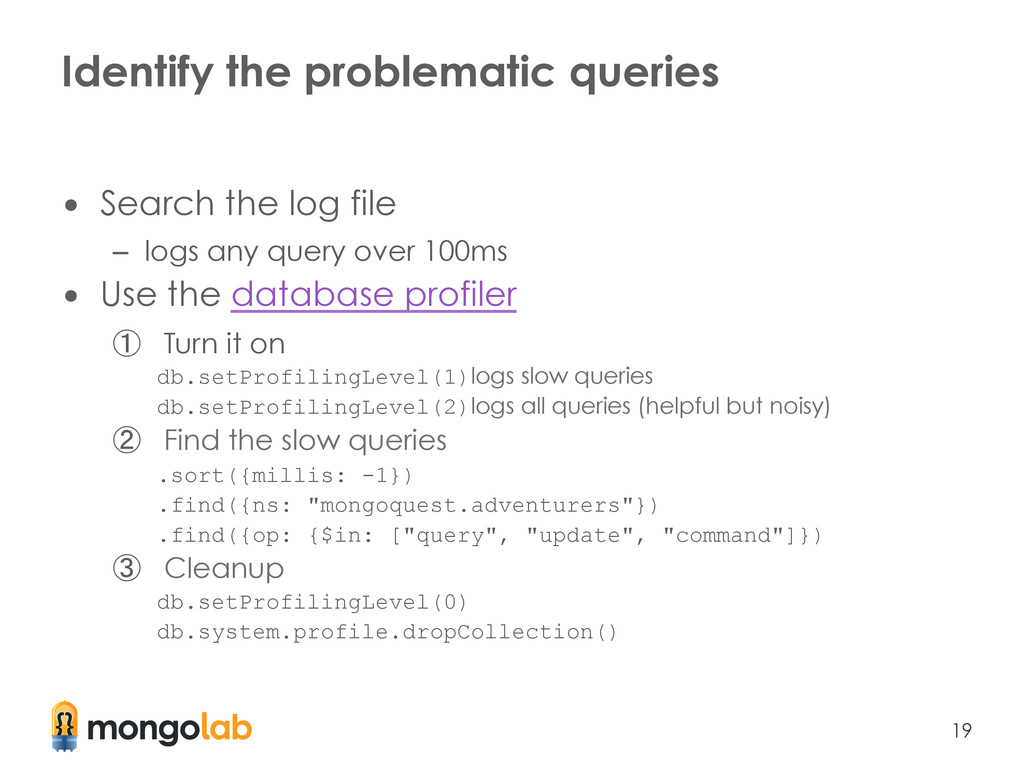
– logs any query over 100ms • Use the database profiler ① Turn it on db.setProfilingLevel(1)logs slow queries db.setProfilingLevel(2)logs all queries (helpful but noisy) ② Find the slow queries .sort({millis: -1}) .find({ns: "mongoquest.adventurers"}) .find({op: {$in: ["query", "update", "command"]}) ③ Cleanup db.setProfilingLevel(0) db.system.profile.dropCollection()
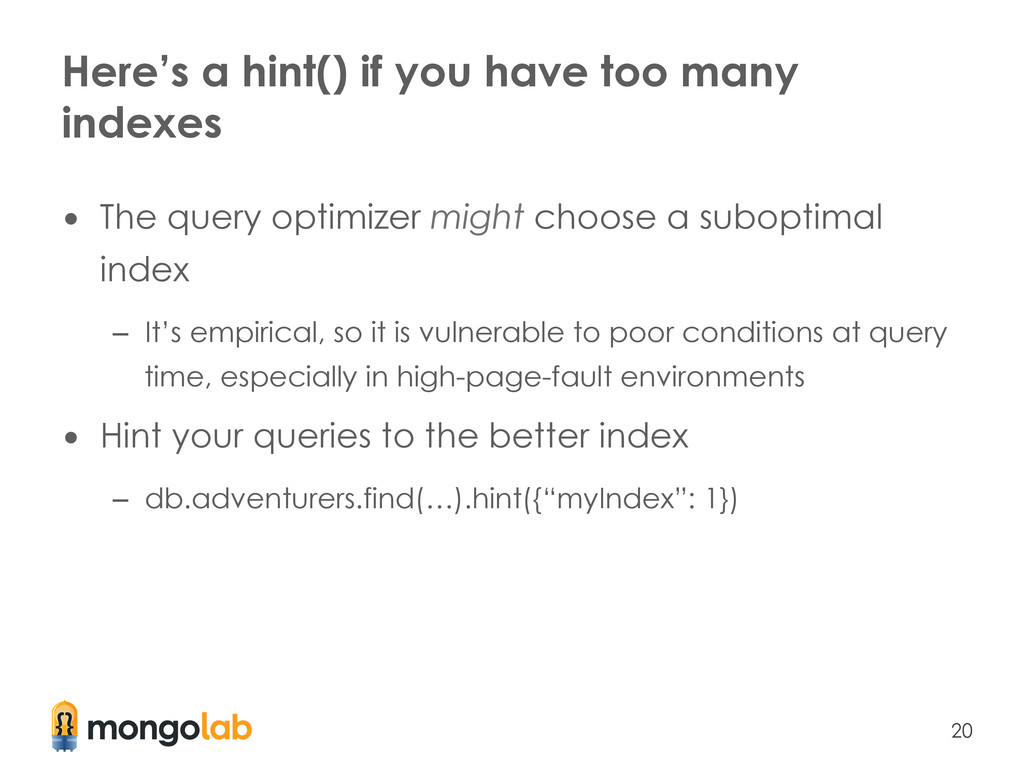
• The query optimizer might choose a suboptimal index – It’s empirical, so it is vulnerable to poor conditions at query time, especially in high-page-fault environments • Hint your queries to the better index – db.adventurers.find(…).hint({“myIndex”: 1})
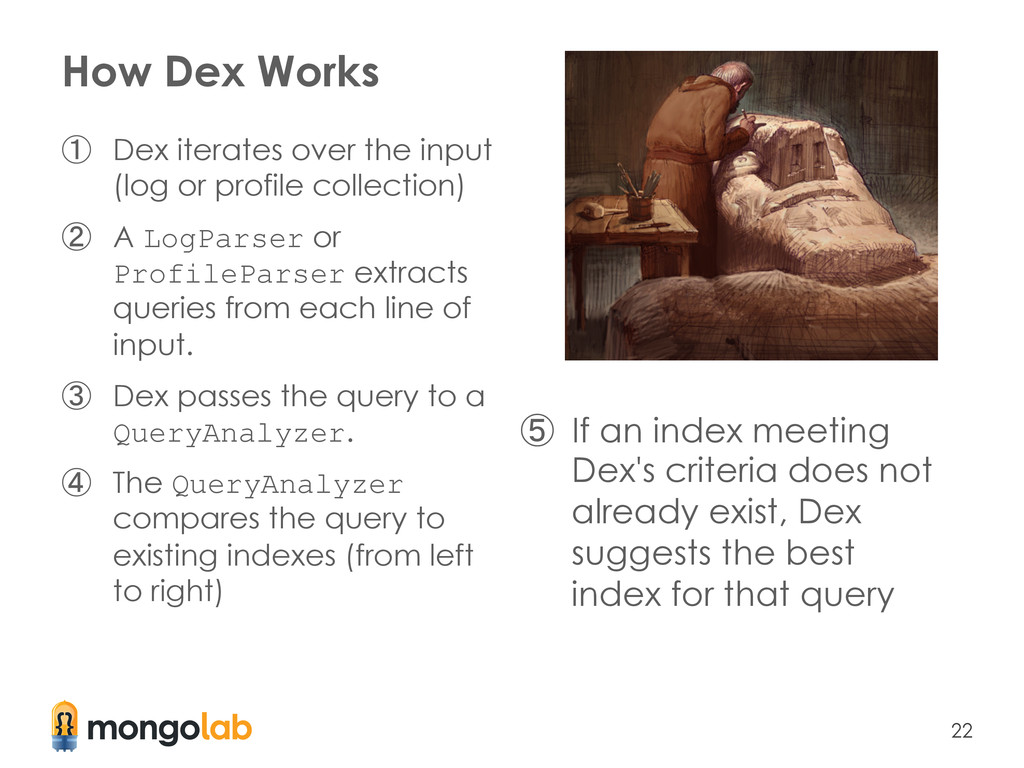
(log or profile collection) ② A LogParser or ProfileParser extracts queries from each line of input. ③ Dex passes the query to a QueryAnalyzer. ④ The QueryAnalyzer compares the query to existing indexes (from left to right) ⑤ If an index meeting Dex's criteria does not already exist, Dex suggests the best index for that query
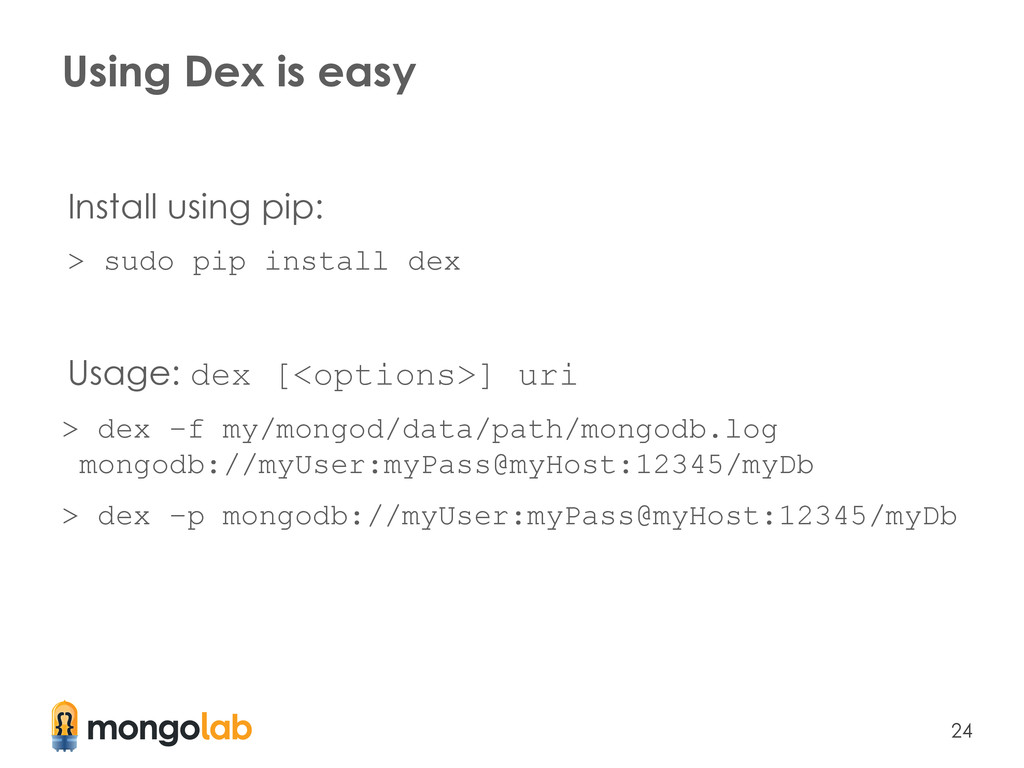
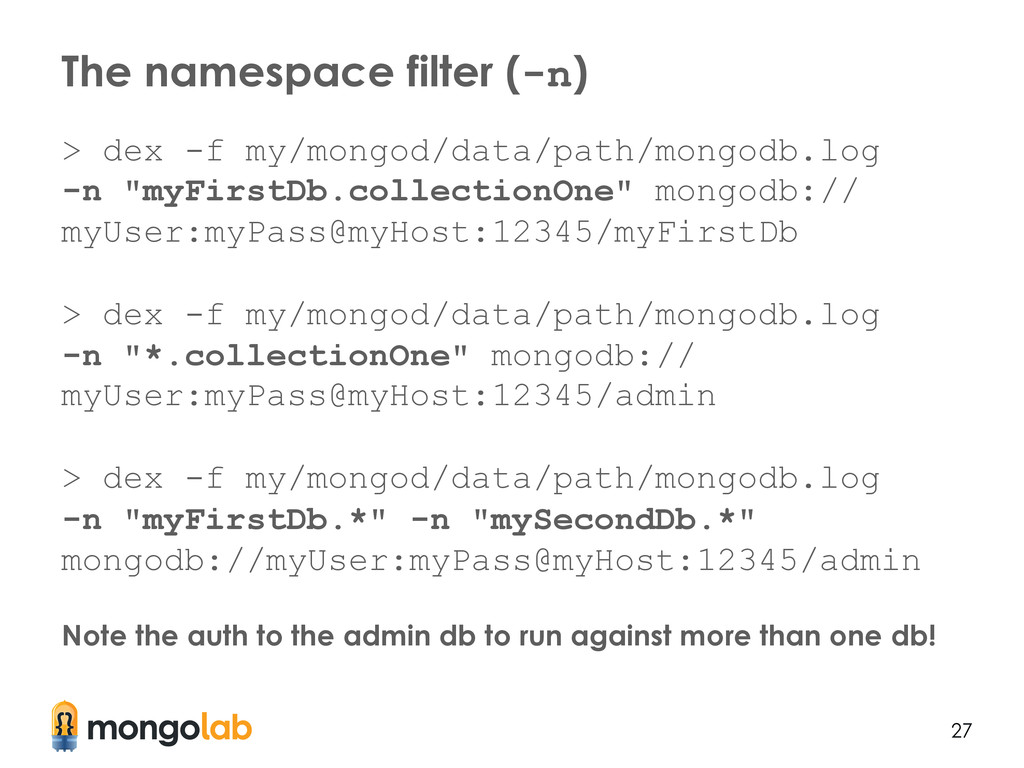
dex -f my/mongod/data/path/mongodb.log -n "*.collectionOne" mongodb:// myUser:myPass@myHost:12345/admin > dex -f my/mongod/data/path/mongodb.log -n "myFirstDb.*" -n "mySecondDb.*" mongodb://myUser:myPass@myHost:12345/admin Note the auth to the admin db to run against more than one db! The namespace filter (-n)
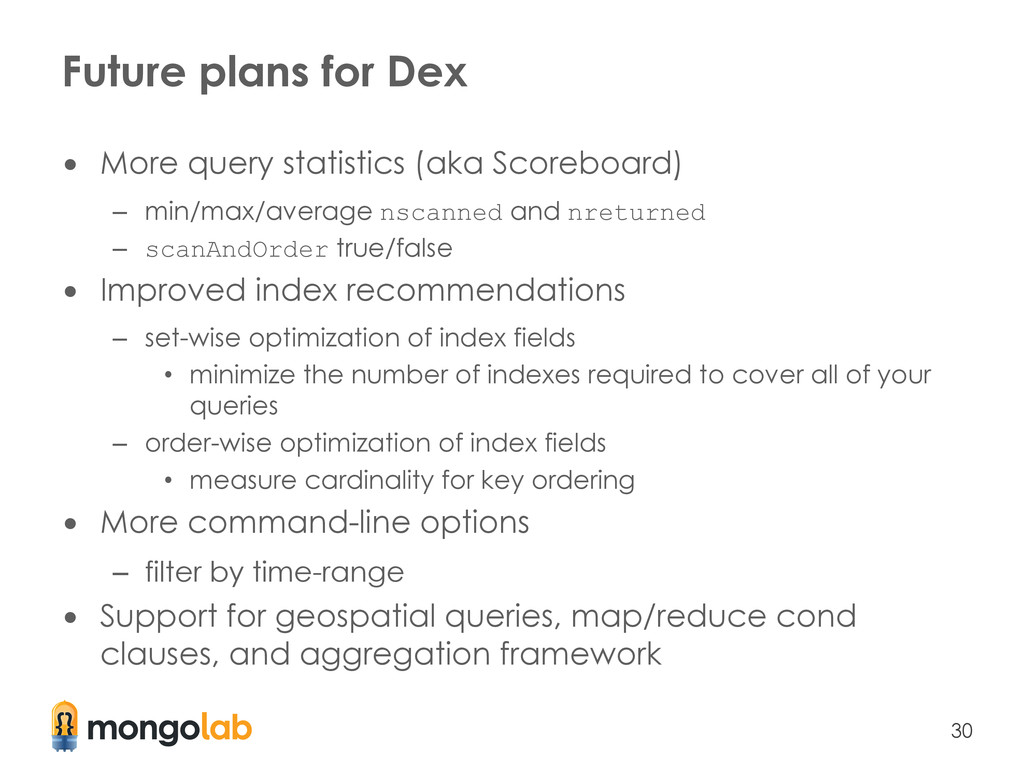
Scoreboard) – min/max/average nscanned and nreturned – scanAndOrder true/false • Improved index recommendations – set-wise optimization of index fields • minimize the number of indexes required to cover all of your queries – order-wise optimization of index fields • measure cardinality for key ordering • More command-line options – filter by time-range • Support for geospatial queries, map/reduce cond clauses, and aggregation framework
![33 Questions? Thank you and good luck out there! [email protected]](https://files.speakerdeck.com/presentations/302484f0214701307dcb22000a1d01dc/slide_32.jpg)