It? 3 Clear the Console 4 Where’s My File? 5 Writing an external file 6 What Does This Function Do? 7 Plot My Data 8 Run My Script 9 Create a Data Frame 10 Package dependencies 11 IDEs for R c 2013 Performance Dynamics Quick Tour of R March 26, 2013 2 / 50
can be obtained by issuing the following command in the R Console: > help.start() which will launch a local HTML document in your browser. help.911() Launches this guide. c 2013 Performance Dynamics Quick Tour of R March 26, 2013 3 / 50
i386-apple-darwin9.8.0 arch i386 os darwin9.8.0 system i386, darwin9.8.0 status major 2 minor 15.2 year 2012 month 10 day 26 svn rev 61015 language R version.string R version 2.15.2 (2012-10-26) nickname Trick or Treat c 2013 Performance Dynamics Quick Tour of R March 26, 2013 4 / 50
command is: > system("system_profiler SPHardwareDataType") Hardware: Hardware Overview: Model Name: MacBook Model Identifier: MacBook5,1 Processor Name: Intel Core 2 Duo Processor Speed: 2.4 GHz Number Of Processors: 1 Total Number Of Cores: 2 L2 Cache: 3 MB Memory: 4 GB Bus Speed: 1.07 GHz Boot ROM Version: MB51.007D.B03 SMC Version (system): 1.32f8 Serial Number (system): W88510GB1AX Hardware UUID: 5D89EC54-315D-5B7B-947D-5DA1757C8E0D Sudden Motion Sensor: State: Enabled c 2013 Performance Dynamics Quick Tour of R March 26, 2013 5 / 50
Time is It? 3 Clear the Console 4 Where’s My File? 5 Writing an external file 6 What Does This Function Do? 7 Plot My Data 8 Run My Script 9 Create a Data Frame 10 Package dependencies 11 IDEs for R c 2013 Performance Dynamics Quick Tour of R March 26, 2013 6 / 50
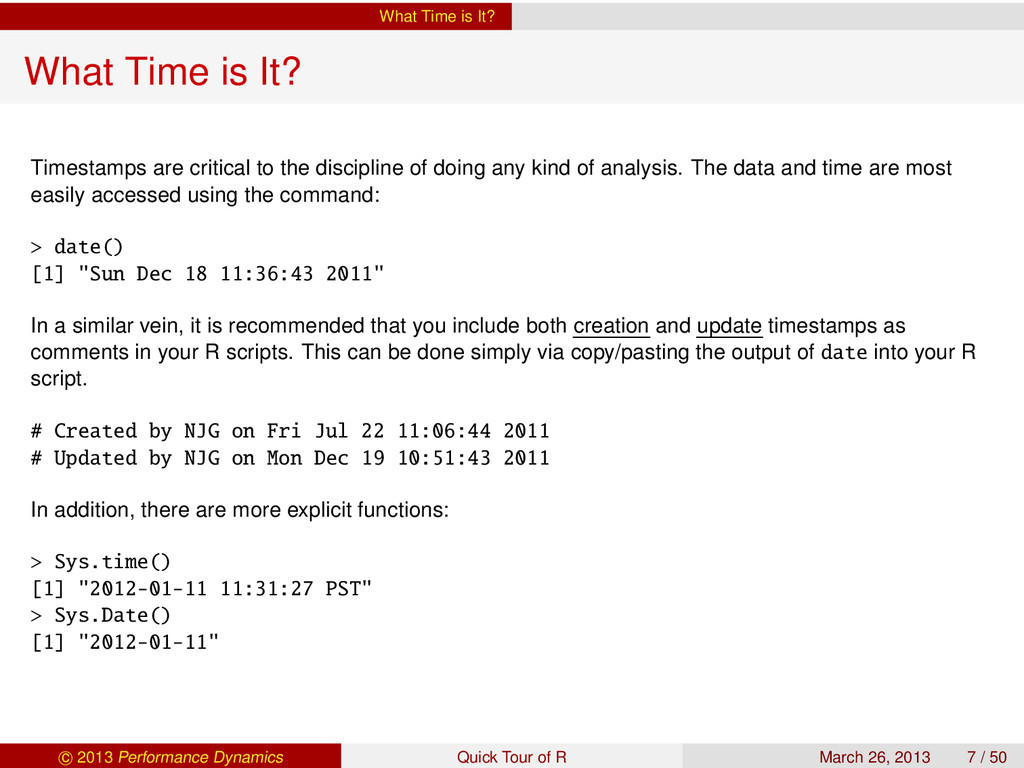
critical to the discipline of doing any kind of analysis. The data and time are most easily accessed using the command: > date() [1] "Sun Dec 18 11:36:43 2011" In a similar vein, it is recommended that you include both creation and update timestamps as comments in your R scripts. This can be done simply via copy/pasting the output of date into your R script. # Created by NJG on Fri Jul 22 11:06:44 2011 # Updated by NJG on Mon Dec 19 10:51:43 2011 In addition, there are more explicit functions: > Sys.time() [1] "2012-01-11 11:31:27 PST" > Sys.Date() [1] "2012-01-11" c 2013 Performance Dynamics Quick Tour of R March 26, 2013 7 / 50
to make timestamp formats POSIX compliant. The following two functions are useful in this respect. 1 Convert to POSIX time: date2posix <- function(datetime, format="%m/%d/%y %H:%M:%S") { as.POSIXct(strptime(datetime,format=format)) } 2 Extract hours for plotting: HrsInDay <- function(x){ .base <- unclass(as.POSIXct(trunc.POSIXt(x[1], units=’day’))) (unclass(x) - .base) / 3600 # convert to hours } Example (Application) > df$posix <- date2posix(paste(df$date, df$time)) > df$hours <- HrsInDay(df$posix) c 2013 Performance Dynamics Quick Tour of R March 26, 2013 8 / 50
(GMT) reference, at zero longitude, is also called Coordinated Universal Time (UTC). Retrieving and converting TZ data can be very tricky because of O/S specifics. Example (Convert PST to AEST) > pst <- Sys.time() > pst [1] "2012-01-11 11:53:38 PST" > format(pst, tz="Australia/Melbourne",usetz=TRUE) [1] "2012-01-12 06:53:38 EST" Knowing that “Australia/Melbourne” is the correct TZ string, comes from grepping the TZ table on Mac OS X: [njg]~% cat /usr/share/zoneinfo/zone.tab | grep -i "melbourne" AU -3749+14458 Australia/Melbourne Victoria For more details see: Timezones Converting time zones Remark In Example 2, the nomenclature “EST” is ambiguous. It should be “AEST” to distinguish it from USA eastern standard time. Moreover, it should be “AEDT” since Australia is on daylight time during this c 2013 Performance Dynamics Quick Tour of R March 26, 2013 9 / 50
is It? 3 Clear the Console 4 Where’s My File? 5 Writing an external file 6 What Does This Function Do? 7 Plot My Data 8 Run My Script 9 Create a Data Frame 10 Package dependencies 11 IDEs for R c 2013 Performance Dynamics Quick Tour of R March 26, 2013 10 / 50
done using the menu item: Menu: Edit → Clear Console Alternatively, these keyboard commands can be used: PCs: Control-L Mac: Clover-Option-L c 2013 Performance Dynamics Quick Tour of R March 26, 2013 11 / 50
is It? 3 Clear the Console 4 Where’s My File? 5 Writing an external file 6 What Does This Function Do? 7 Plot My Data 8 Run My Script 9 Create a Data Frame 10 Package dependencies 11 IDEs for R c 2013 Performance Dynamics Quick Tour of R March 26, 2013 12 / 50
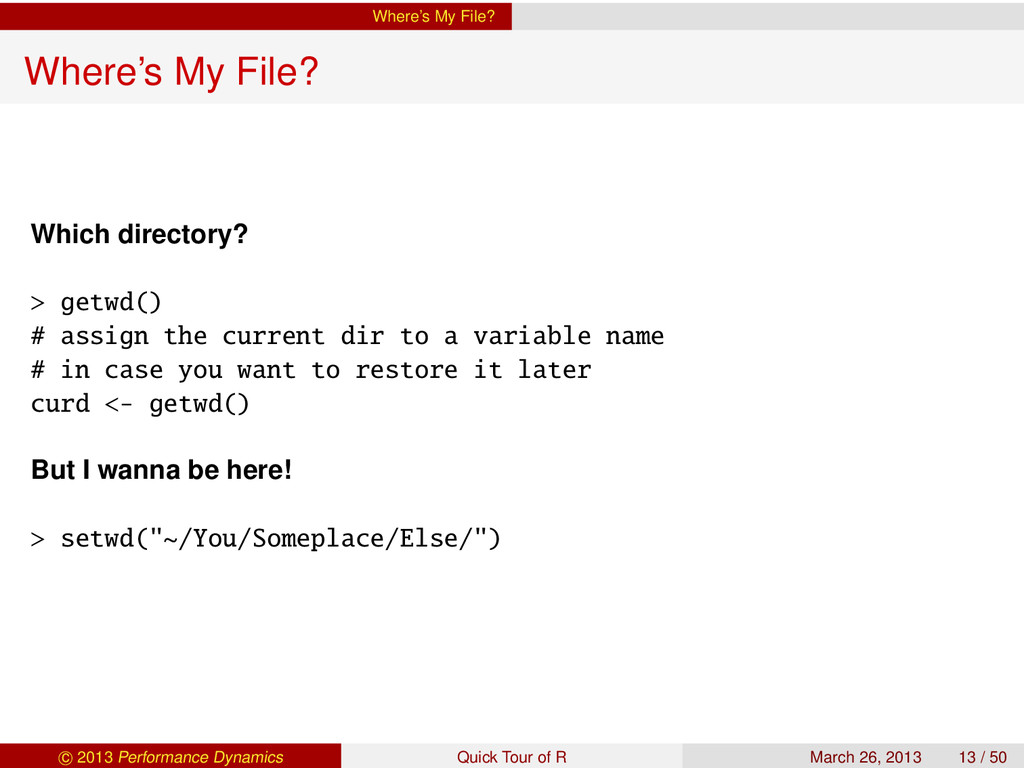
# assign the current dir to a variable name # in case you want to restore it later curd <- getwd() But I wanna be here! > setwd("~/You/Someplace/Else/") c 2013 Performance Dynamics Quick Tour of R March 26, 2013 13 / 50
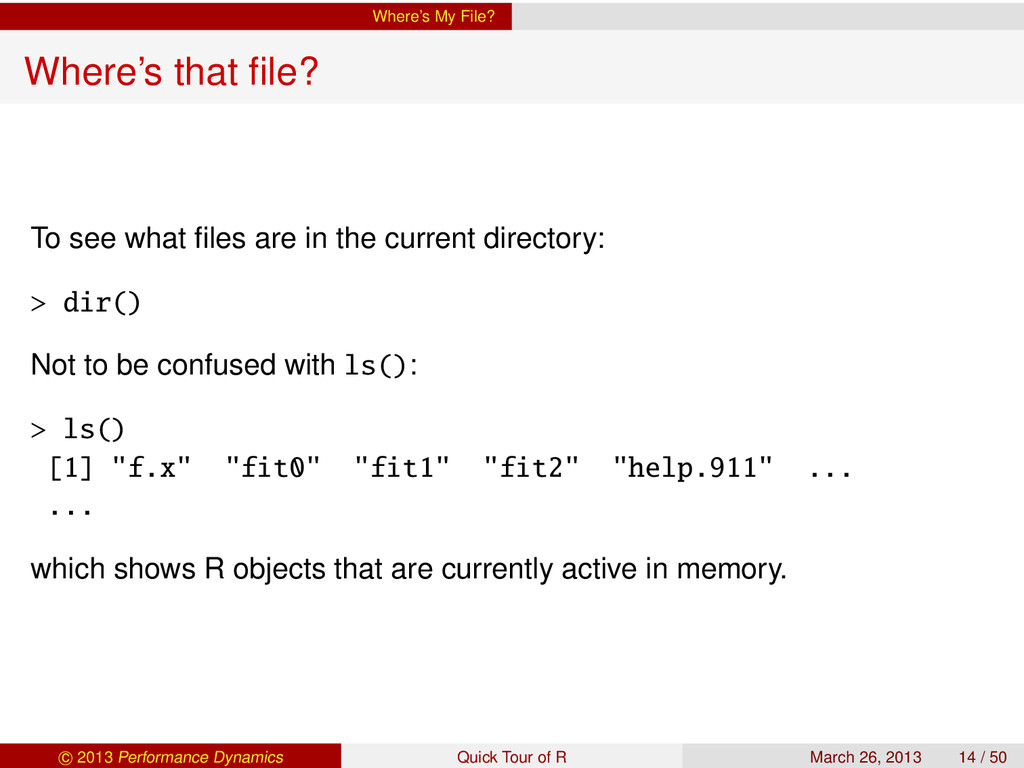
are in the current directory: > dir() Not to be confused with ls(): > ls() [1] "f.x" "fit0" "fit1" "fit2" "help.911" ... ... which shows R objects that are currently active in memory. c 2013 Performance Dynamics Quick Tour of R March 26, 2013 14 / 50
data are best read into R from an external file: bigData <- read.table("~/You/../file.data", header=FALSE) Or, if your data is exported from Excel: csvData <- read.csv("~/You/../file.csv", header=TRUE) c 2013 Performance Dynamics Quick Tour of R March 26, 2013 15 / 50
have some lines of text that precede the actial column headings and data that you wish to analyze in R. To avoid importing those lines, use the skip feature in read(). This is an integer value that specifies the number of lines in the data file to skip before beginning the read operation (e.g., 23). bigData <- read.table("~/../file.data", header=TRUE, skip=23) c 2013 Performance Dynamics Quick Tour of R March 26, 2013 16 / 50
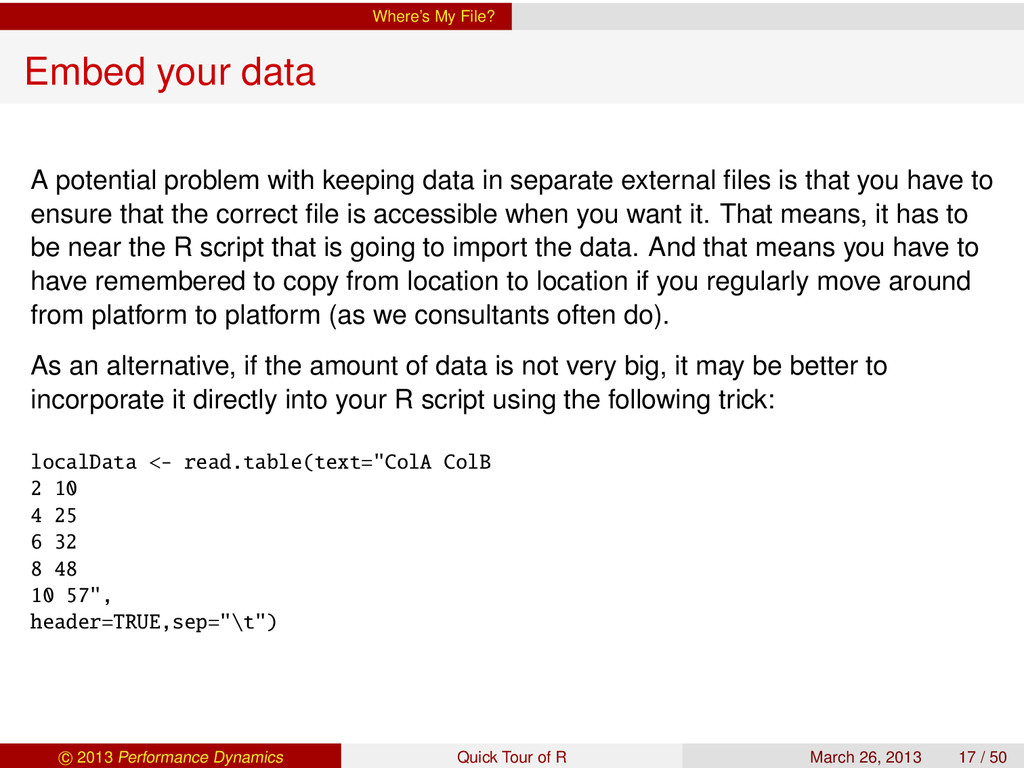
keeping data in separate external files is that you have to ensure that the correct file is accessible when you want it. That means, it has to be near the R script that is going to import the data. And that means you have to have remembered to copy from location to location if you regularly move around from platform to platform (as we consultants often do). As an alternative, if the amount of data is not very big, it may be better to incorporate it directly into your R script using the following trick: localData <- read.table(text="ColA ColB 2 10 4 25 6 32 8 48 10 57", header=TRUE,sep="\t") c 2013 Performance Dynamics Quick Tour of R March 26, 2013 17 / 50
Time is It? 3 Clear the Console 4 Where’s My File? 5 Writing an external file 6 What Does This Function Do? 7 Plot My Data 8 Run My Script 9 Create a Data Frame 10 Package dependencies 11 IDEs for R c 2013 Performance Dynamics Quick Tour of R March 26, 2013 18 / 50
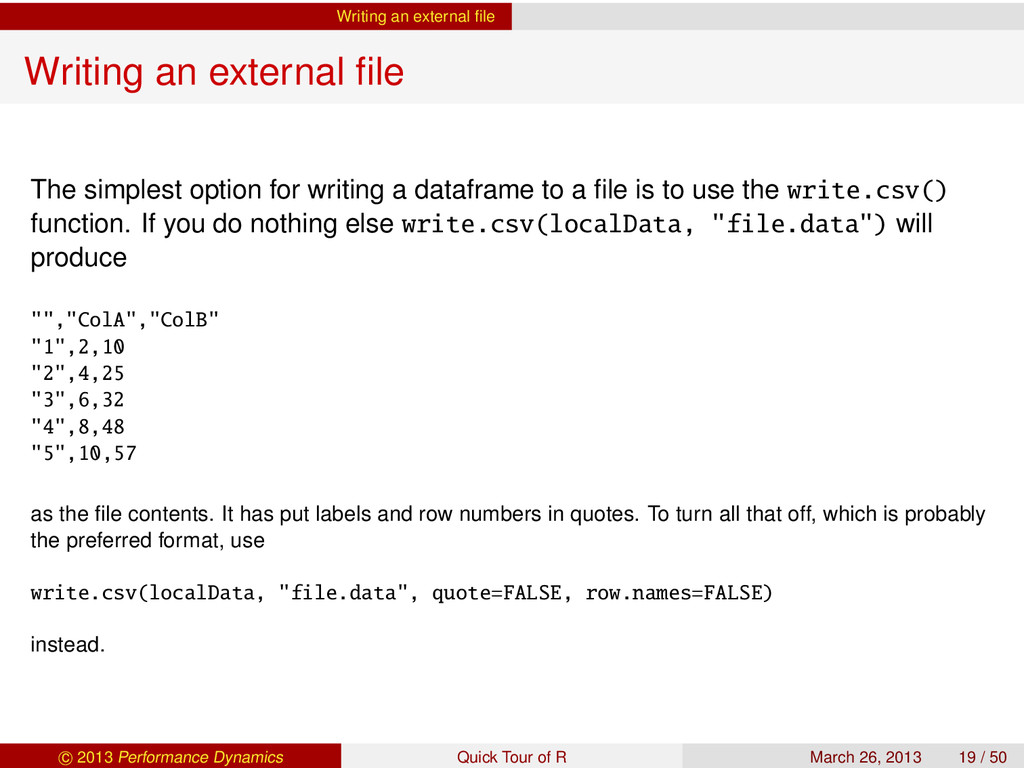
option for writing a dataframe to a file is to use the write.csv() function. If you do nothing else write.csv(localData, "file.data") will produce "","ColA","ColB" "1",2,10 "2",4,25 "3",6,32 "4",8,48 "5",10,57 as the file contents. It has put labels and row numbers in quotes. To turn all that off, which is probably the preferred format, use write.csv(localData, "file.data", quote=FALSE, row.names=FALSE) instead. c 2013 Performance Dynamics Quick Tour of R March 26, 2013 19 / 50
are running R under a MS Windows O/S, you may find the CRAN package xlsReadWrite useful making data exchange easier. Other tips and tricks for exchanging data between R and Excel, as well as other Windows applications, can be found on this web page. c 2013 Performance Dynamics Quick Tour of R March 26, 2013 20 / 50
What Time is It? 3 Clear the Console 4 Where’s My File? 5 Writing an external file 6 What Does This Function Do? 7 Plot My Data 8 Run My Script 9 Create a Data Frame 10 Package dependencies 11 IDEs for R c 2013 Performance Dynamics Quick Tour of R March 26, 2013 21 / 50
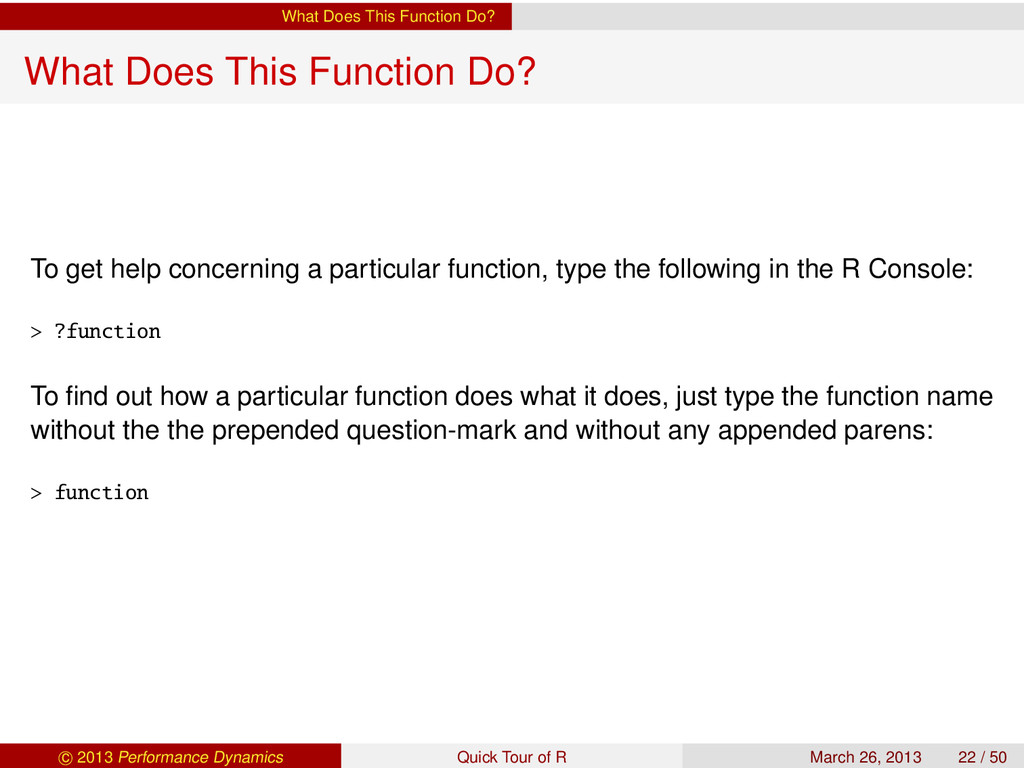
To get help concerning a particular function, type the following in the R Console: > ?function To find out how a particular function does what it does, just type the function name without the the prepended question-mark and without any appended parens: > function c 2013 Performance Dynamics Quick Tour of R March 26, 2013 22 / 50
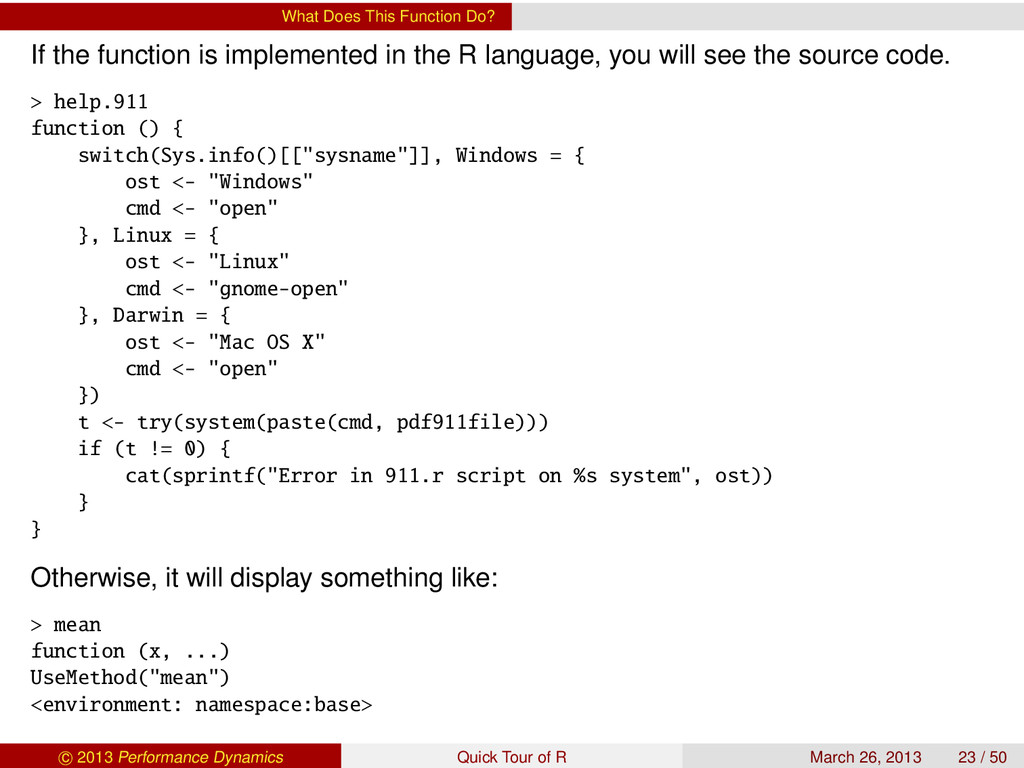
in the R language, you will see the source code. > help.911 function () { switch(Sys.info()[["sysname"]], Windows = { ost <- "Windows" cmd <- "open" }, Linux = { ost <- "Linux" cmd <- "gnome-open" }, Darwin = { ost <- "Mac OS X" cmd <- "open" }) t <- try(system(paste(cmd, pdf911file))) if (t != 0) { cat(sprintf("Error in 911.r script on %s system", ost)) } } Otherwise, it will display something like: > mean function (x, ...) UseMethod("mean") <environment: namespace:base> c 2013 Performance Dynamics Quick Tour of R March 26, 2013 23 / 50
is It? 3 Clear the Console 4 Where’s My File? 5 Writing an external file 6 What Does This Function Do? 7 Plot My Data 8 Run My Script 9 Create a Data Frame 10 Package dependencies 11 IDEs for R c 2013 Performance Dynamics Quick Tour of R March 26, 2013 24 / 50
is called “localData” then you can make a simple xy-plot: > plot(localData$ColA, localData$ColB, type="b") Type ?plot at the R Console for more details from the base plot package. To add more data points or lines (or curves) to an existing plot window, use: > attach(mtcars) > plot(wt, mpg) > abline(lm(mpg~wt)) > lines(wt,rep(20,length(wt)),col="red") c 2013 Performance Dynamics Quick Tour of R March 26, 2013 25 / 50
by 2 array of plots with a square aspect ratio op <- par(mfrow = c(2, 2), pty = "s") plot(...) plot(...) plot(...) plot(...) par(op) The purpose of the op variable (“old plot” device format) is to restore the default plotting mode in the graphics window. Otherwise, any new plots will appear in array mode. c 2013 Performance Dynamics Quick Tour of R March 26, 2013 26 / 50
using the following R functions: Format Command PDF pdf("Rplot.pdf") PNG png("Rplot.png") JPG jpeg("Rplot.jpg") BMP bmp("Rplot.bmp") PS postscript("Rplot.ps") c 2013 Performance Dynamics Quick Tour of R March 26, 2013 27 / 50
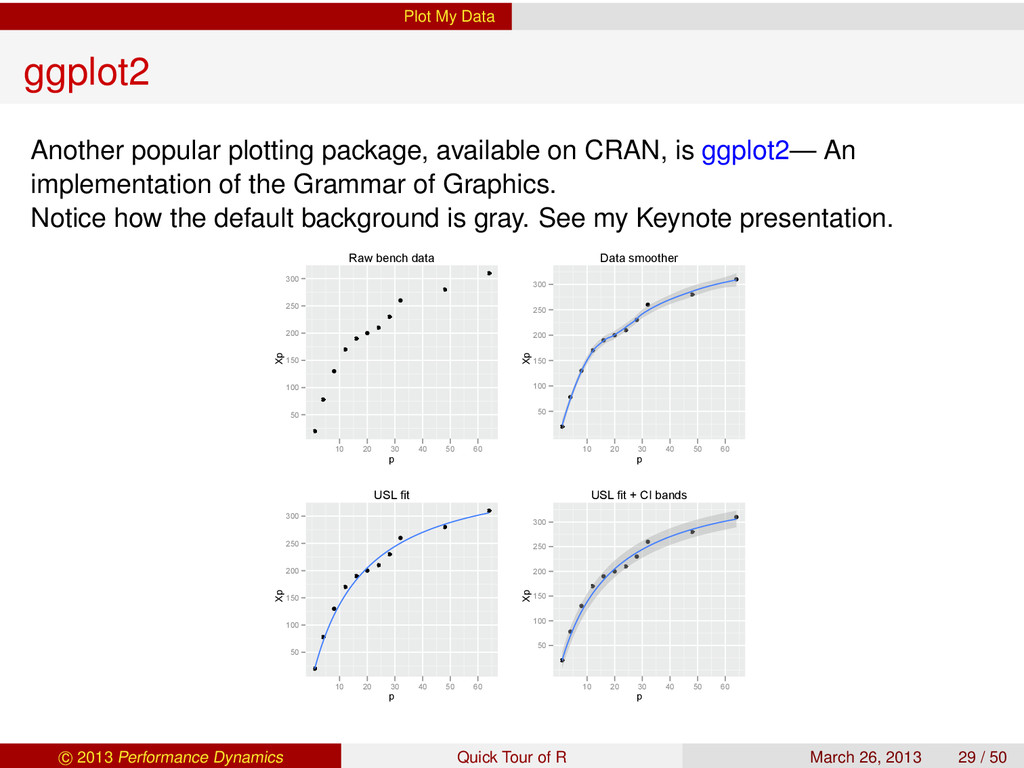
CRAN, is ggplot2— An implementation of the Grammar of Graphics. Notice how the default background is gray. See my Keynote presentation. Raw bench data p Xp 50 100 150 200 250 300 10 20 30 40 50 60 Data smoother p Xp 50 100 150 200 250 300 10 20 30 40 50 60 USL fit p Xp 50 100 150 200 250 300 10 20 30 40 50 60 USL fit + CI bands p Xp 50 100 150 200 250 300 10 20 30 40 50 60 c 2013 Performance Dynamics Quick Tour of R March 26, 2013 29 / 50
is It? 3 Clear the Console 4 Where’s My File? 5 Writing an external file 6 What Does This Function Do? 7 Plot My Data 8 Run My Script 9 Create a Data Frame 10 Package dependencies 11 IDEs for R c 2013 Performance Dynamics Quick Tour of R March 26, 2013 30 / 50
to run an R script. 1 Click the R button in the R Console GUI. 2 An explicit source() command at the R Console prompt: > source("myscript.r") 3 An R script can be executed stand alone without the R Console, e.g., from a UNIX shell: % ./myscript.r This requires 2 things: 1 That #!/usr/bin/env Rscript is the first line of myscript.r. 2 That is has execution permission: chmod +x myscript.r This will cause any output to be written to separate files, e.g., myscript.r.Rout 4 Batch mode command, e.g., from a UNIX shell: % R CMD BATCH myscript.r [outfile] The ‘outfile’ file option captures a list of all the commands from the executed script and its output. If no outfile is specified, it defaults to myscript.r.Rout. c 2013 Performance Dynamics Quick Tour of R March 26, 2013 31 / 50
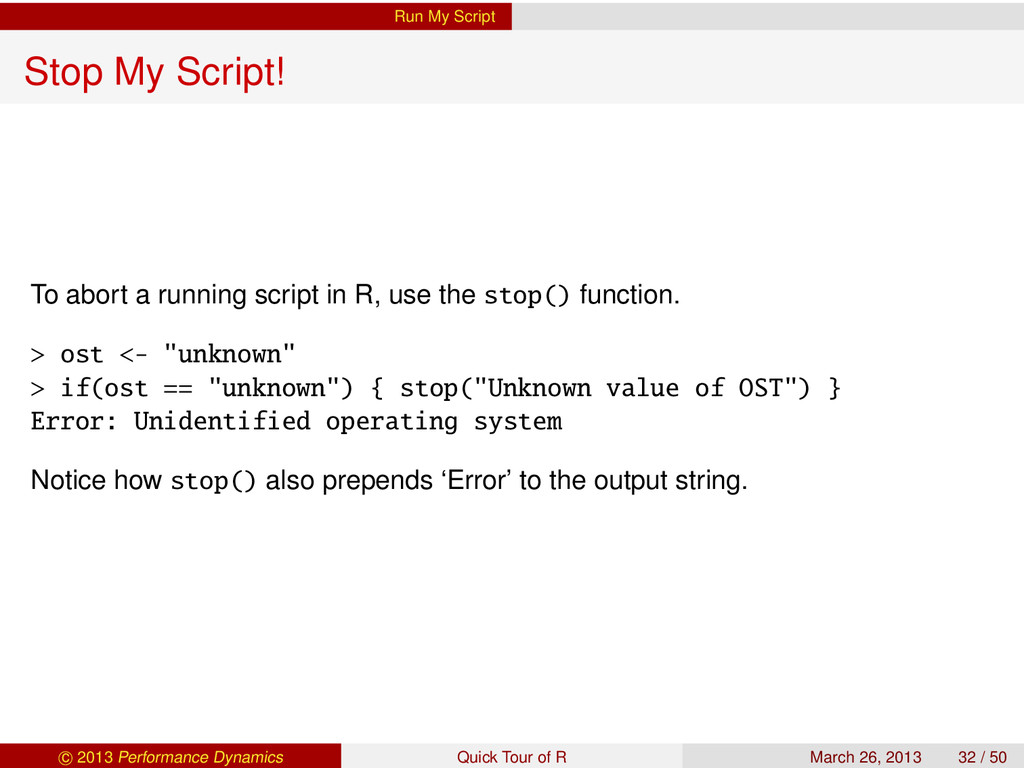
script in R, use the stop() function. > ost <- "unknown" > if(ost == "unknown") { stop("Unknown value of OST") } Error: Unidentified operating system Notice how stop() also prepends ‘Error’ to the output string. c 2013 Performance Dynamics Quick Tour of R March 26, 2013 32 / 50
Time is It? 3 Clear the Console 4 Where’s My File? 5 Writing an external file 6 What Does This Function Do? 7 Plot My Data 8 Run My Script 9 Create a Data Frame 10 Package dependencies 11 IDEs for R c 2013 Performance Dynamics Quick Tour of R March 26, 2013 33 / 50
frame is the quintessential data object in R. It most commonly arises as a consequence of employing read.table() or read.csv() to import data into the R environment. Data: From the standpoint of data in R, a data frame (as the name implies) is a tabular construct for presenting and accessing data. Language: From a programming standpoint in R, a data frame is like a record or struct data structure in that it can contain data fields of different types. c 2013 Performance Dynamics Quick Tour of R March 26, 2013 34 / 50
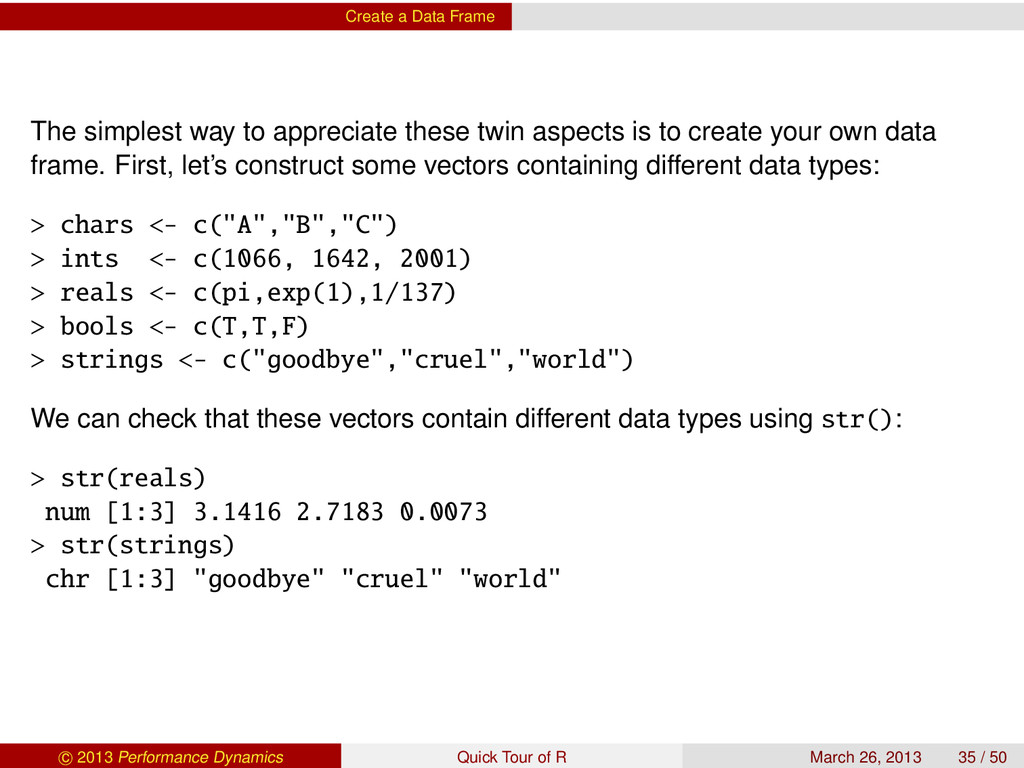
twin aspects is to create your own data frame. First, let’s construct some vectors containing different data types: > chars <- c("A","B","C") > ints <- c(1066, 1642, 2001) > reals <- c(pi,exp(1),1/137) > bools <- c(T,T,F) > strings <- c("goodbye","cruel","world") We can check that these vectors contain different data types using str(): > str(reals) num [1:3] 3.1416 2.7183 0.0073 > str(strings) chr [1:3] "goodbye" "cruel" "world" c 2013 Performance Dynamics Quick Tour of R March 26, 2013 35 / 50
as columns, into a formal data frame as follows: > df <- data.frame(chars,ints,reals,bools,strings) > df chars ints reals bools strings 1 A 1066 3.14159265 TRUE goodbye 2 B 1642 2.71828183 TRUE cruel 3 C 2001 0.00729927 FALSE world Amongst its many uses, a data frame can provide a nice way of organizing your results in a tabular format. c 2013 Performance Dynamics Quick Tour of R March 26, 2013 36 / 50
correct: library(pdq) or require(pdq)? In practice, there is not much functional difference. If the package does not exist: library: Throws an error and stops. require: Returns false and keeps going. c 2013 Performance Dynamics Quick Tour of R March 26, 2013 37 / 50
of assignment operator in R: 1 <- 2 = 3 «- The left-arrow construction <- is the most ubiquitous and can be used under any circumstances, The other assignment operator is = and is most commonly used in pre-defined functions for assigning a value to an argument in that function, e.g., plot(x, type = "p", main = "My Plot") Historically, the left-arrow notation derives from the existence of a single key ← on AT&T computers and APL keyboards when the S language was defined. Since no such character is available in ASCII, it has to be typed as 2 characters. Hence, x <- 2 should be read as: “x gets two” in R parlance. c 2013 Performance Dynamics Quick Tour of R March 26, 2013 38 / 50
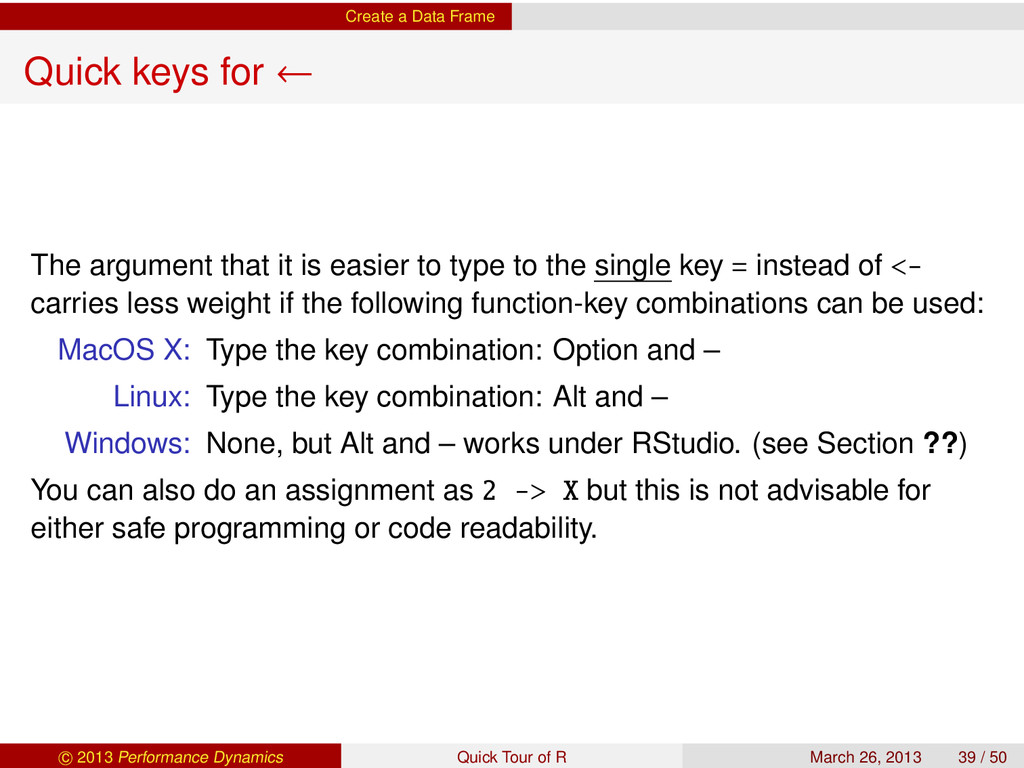
that it is easier to type to the single key = instead of <- carries less weight if the following function-key combinations can be used: MacOS X: Type the key combination: Option and – Linux: Type the key combination: Alt and – Windows: None, but Alt and – works under RStudio. (see Section ??) You can also do an assignment as 2 -> X but this is not advisable for either safe programming or code readability. c 2013 Performance Dynamics Quick Tour of R March 26, 2013 39 / 50
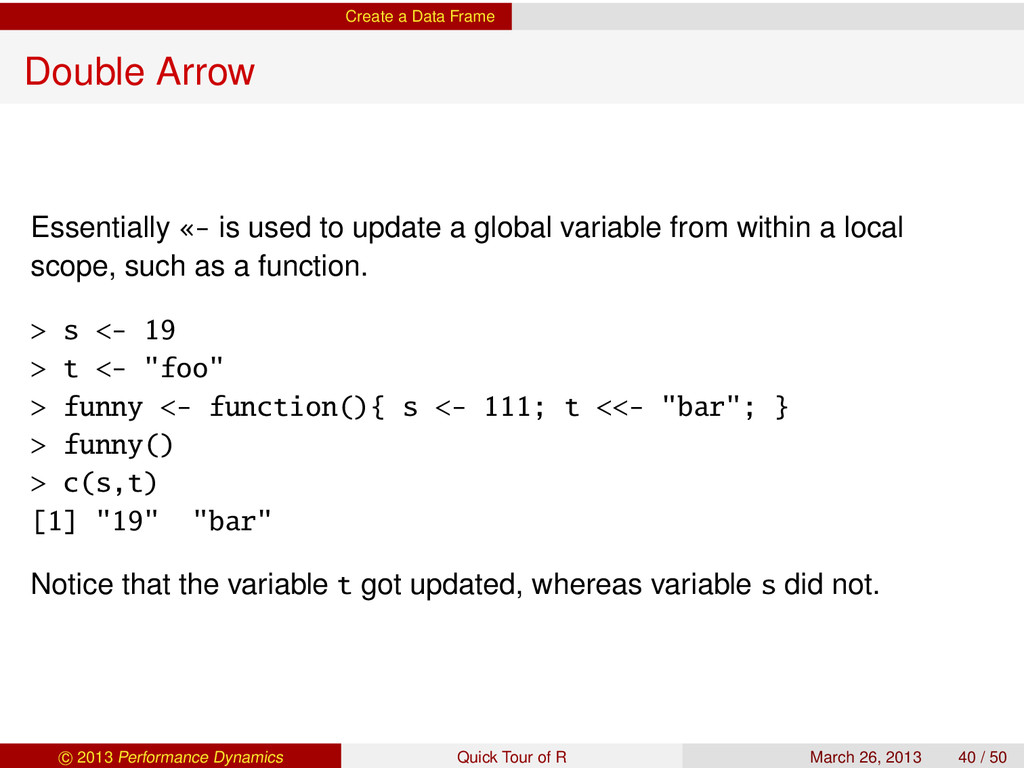
to update a global variable from within a local scope, such as a function. > s <- 19 > t <- "foo" > funny <- function(){ s <- 111; t <<- "bar"; } > funny() > c(s,t) [1] "19" "bar" Notice that the variable t got updated, whereas variable s did not. c 2013 Performance Dynamics Quick Tour of R March 26, 2013 40 / 50
answer: No! But you can get close by using the operators package on CRAN. > require(operators) > (x <- 20) [1] 20 > (x %+=% 1) [1] 21 which is identical to x += 1 in C syntax and gives the same result as x++. More generally: > (x %+=% 10) [1] 31 If you examine the accompanying Reference manual, you’ll see a very broad class of operators that use this same syntax. Remark (Caution) The above operators should not be confused with the similar syntax used for modulus and integer division, which are part of the R base. > 5%%2 # mod [1] 1 > 5%/%2 # div [1] 2 c 2013 Performance Dynamics Quick Tour of R March 26, 2013 41 / 50
Exist in R? The C language has the useful ternary operator which can be used in a statement like: y = x == 1 ? 2 : 3; so that if x is TRUE (1) then y = 2, otherwise y = 3. The R syntax for ternary operation uses the ifelse() function: > x <- FALSE > y <- ifelse(x == TRUE, 2, 3) > y [1] 3 c 2013 Performance Dynamics Quick Tour of R March 26, 2013 42 / 50
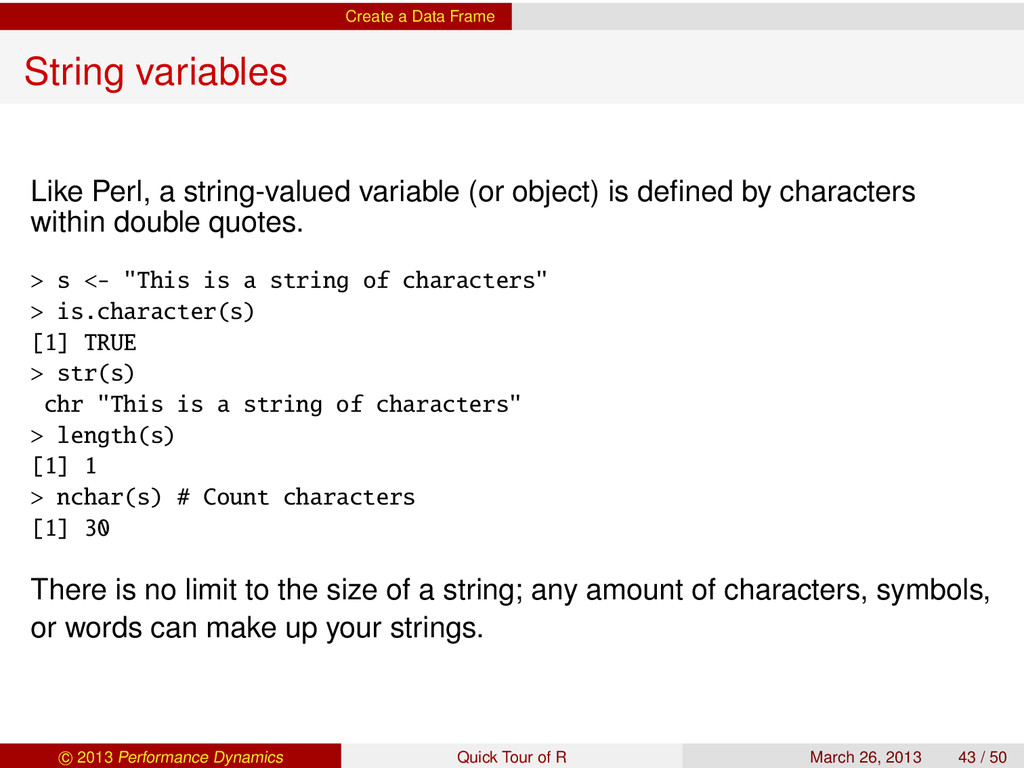
variable (or object) is defined by characters within double quotes. > s <- "This is a string of characters" > is.character(s) [1] TRUE > str(s) chr "This is a string of characters" > length(s) [1] 1 > nchar(s) # Count characters [1] 30 There is no limit to the size of a string; any amount of characters, symbols, or words can make up your strings. c 2013 Performance Dynamics Quick Tour of R March 26, 2013 43 / 50
new R package called “Pkg” as an R Console command: > install.packages("Pkg") Note the use of quotes in the argument. I prefer to use the GUI Package manager and Package installer invoked from the R menu bar. c 2013 Performance Dynamics Quick Tour of R March 26, 2013 45 / 50
It? 3 Clear the Console 4 Where’s My File? 5 Writing an external file 6 What Does This Function Do? 7 Plot My Data 8 Run My Script 9 Create a Data Frame 10 Package dependencies 11 IDEs for R c 2013 Performance Dynamics Quick Tour of R March 26, 2013 46 / 50
when it appears with the same name in two different R packages? Use path dependent calls, which uses the same syntax as Perl: pkgA::foo() pkgB::foo() It’s also a good idea to use explicit package names when employing PDQ: library(pdq) pdq::CreateNode() pdq::SetDemand() c 2013 Performance Dynamics Quick Tour of R March 26, 2013 47 / 50
is It? 3 Clear the Console 4 Where’s My File? 5 Writing an external file 6 What Does This Function Do? 7 Plot My Data 8 Run My Script 9 Create a Data Frame 10 Package dependencies 11 IDEs for R c 2013 Performance Dynamics Quick Tour of R March 26, 2013 48 / 50
of so-called integrated development environments for R. Some examples include: RStudio FOSS Revolution commercial Tinn-R FOSS Rattle FOSS R-PLUS commercial A number of commercial statistical software packages, e.g., IBMS SPSS, SAS and JMP, also provide integration with R. c 2013 Performance Dynamics Quick Tour of R March 26, 2013 49 / 50
perfdynamics.blogspot.com twitter.com/DrQz Facebook [email protected] OFF: +1-510-537-5758 c 2013 Performance Dynamics Quick Tour of R March 26, 2013 50 / 50