Upgrade to Pro — share decks privately, control downloads, hide ads and more …

Performance gone wild: When 100,000 req/sec isn...

Performance gone wild: When 100,000 req/sec isn't where you stop

What if I told you that you can both eat the cake and leave it whole? Add a healthy dose of optimizations, dash of refactorings and pinch of common sense, throw it into RavenDB pot, let it stew for a while, and Voila! RavenDB passes 150k req/sec while having very low memory footprint.

In this talk, we'll cover how we pushed RavenDB to process hundreds of thousands of requests per second by using zero-copy data storage and autodidactive algorithm, by reducing external dependencies, getting chummy with the operating system and most importantly, putting the GC out of work.

Avatar for Michael Yarichuk

Michael Yarichuk

December 12, 2016

Other Decks in Programming

Transcript

  1. Optimization Algorithm 1. Find a hotspot in your code 2.

    Replace generic algorithm with specialized one 2
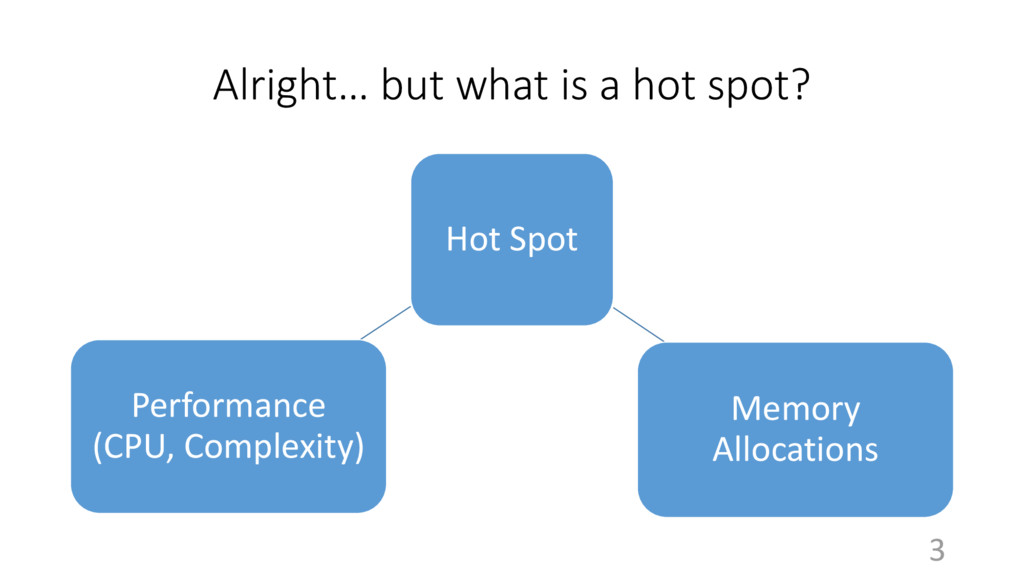
  2. Alright… but what is a hot spot? 3 Hot Spot

    Memory Allocations Performance (CPU, Complexity)
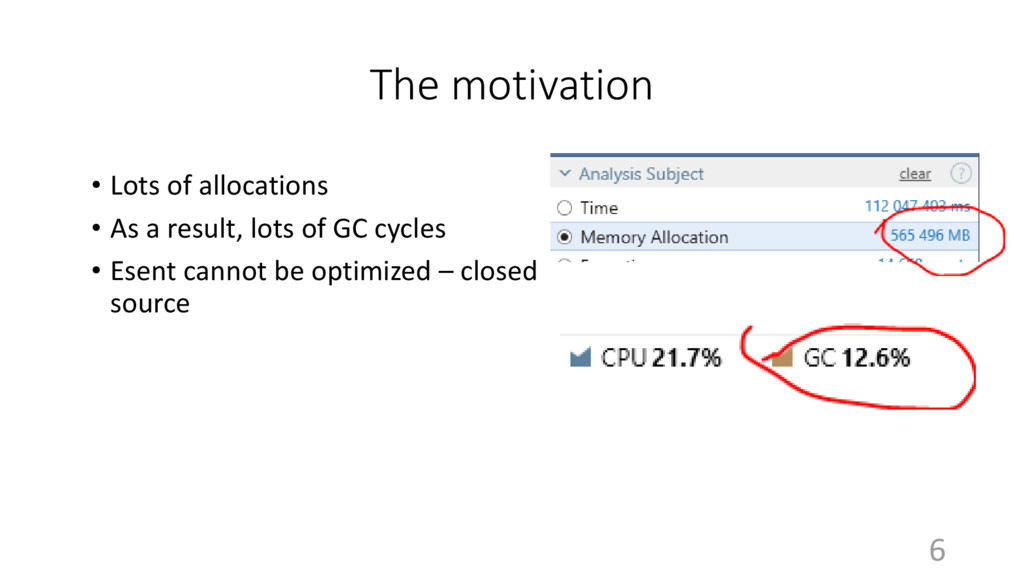
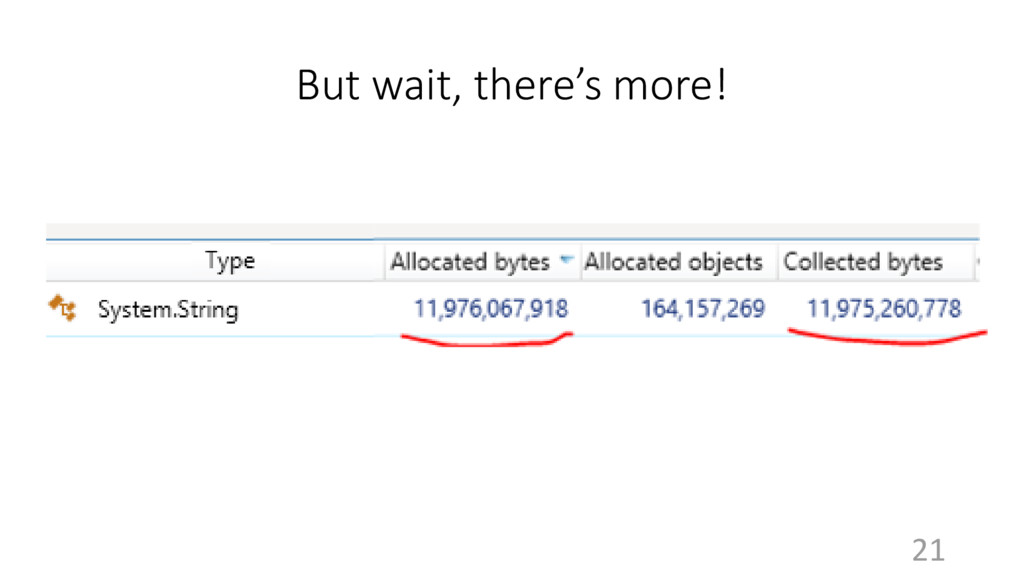
  3. The motivation • Lots of allocations • As a result,

    lots of GC cycles • Esent cannot be optimized – closed source 6
  4. Voron – Key/Value store • Written on C# for use

    in RavenDB • Uses memory outside of managed Heap • The same functional features as Esent 7
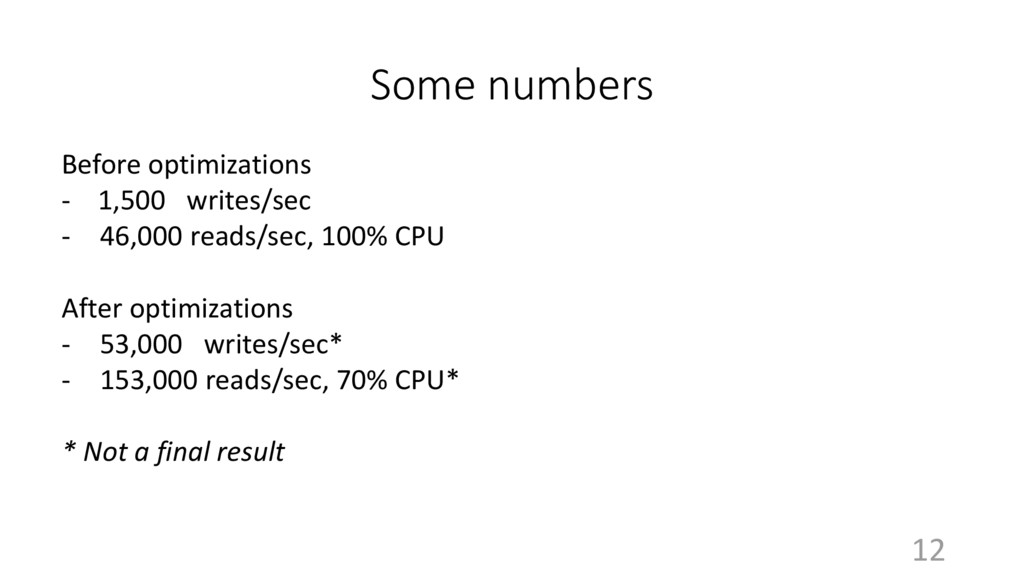
  5. Some numbers Before optimizations - 1,500 writes/sec - 46,000 reads/sec,

    100% CPU After optimizations - 53,000 writes/sec* - 153,000 reads/sec, 70% CPU* * Not a final result 12
  6. 13

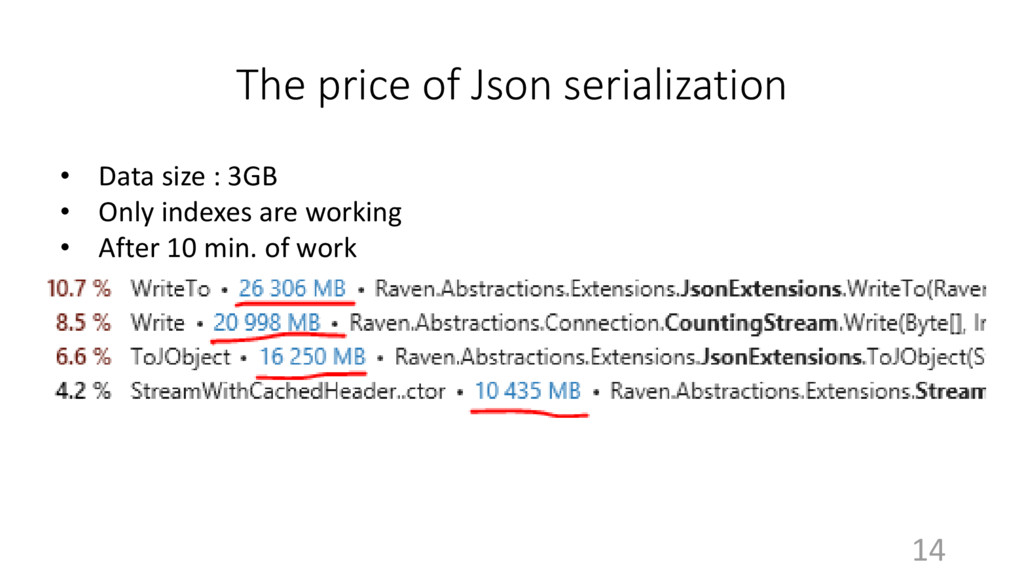
  7. The price of Json serialization • Data size : 3GB

    • Only indexes are working • After 10 min. of work 14
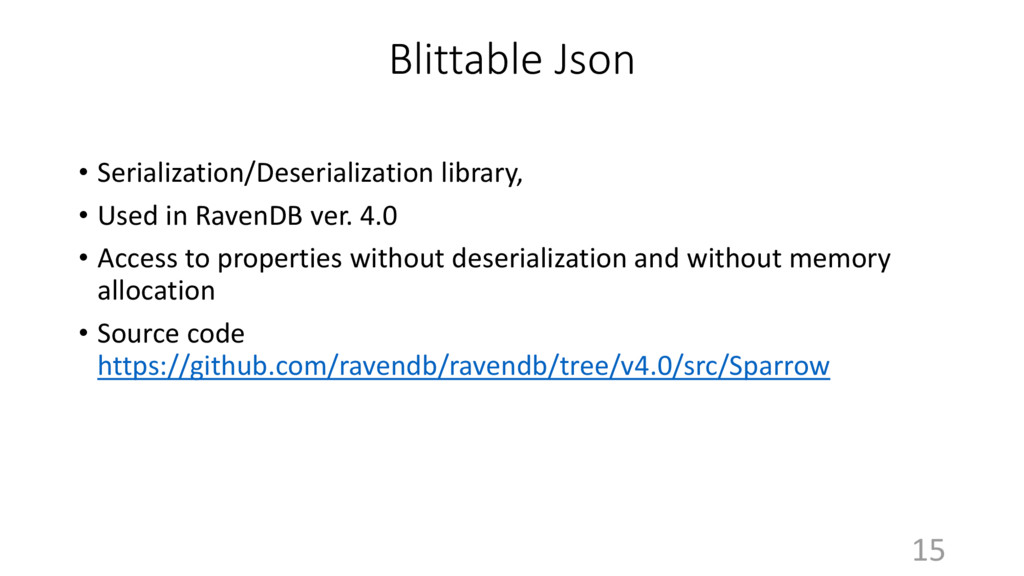
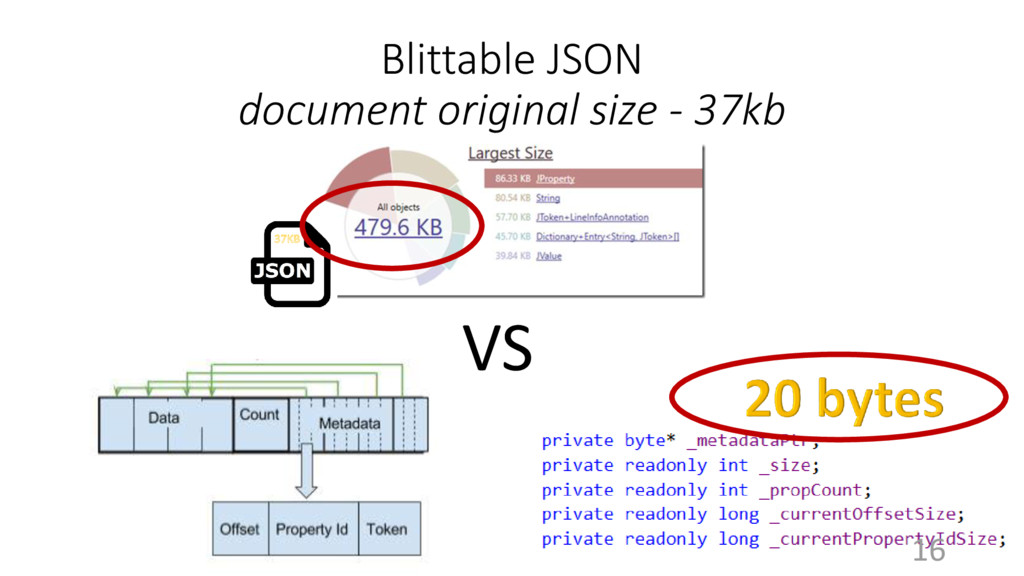
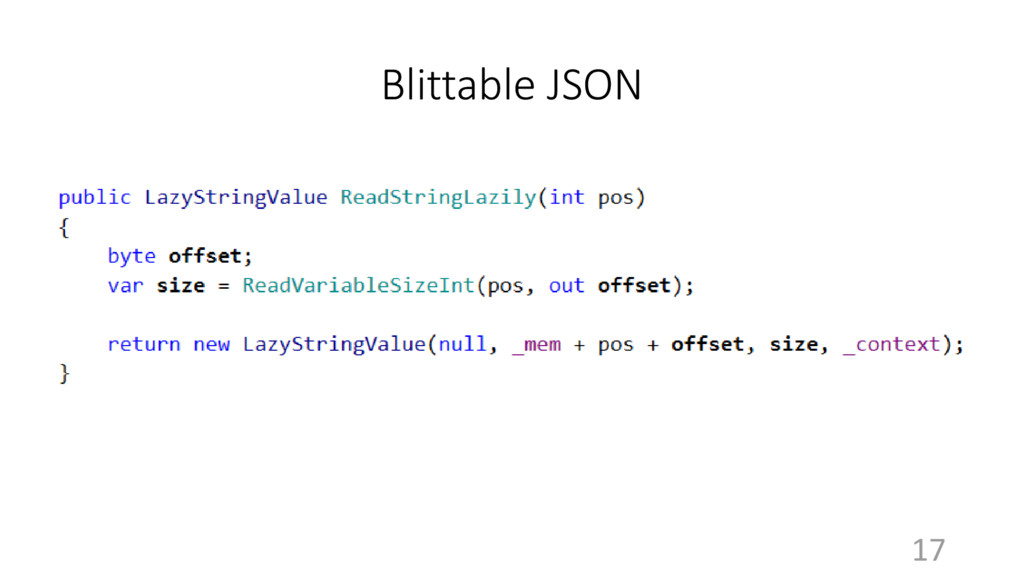
  8. Blittable Json • Serialization/Deserialization library, • Used in RavenDB ver.

    4.0 • Access to properties without deserialization and without memory allocation • Source code https://github.com/ravendb/ravendb/tree/v4.0/src/Sparrow 15
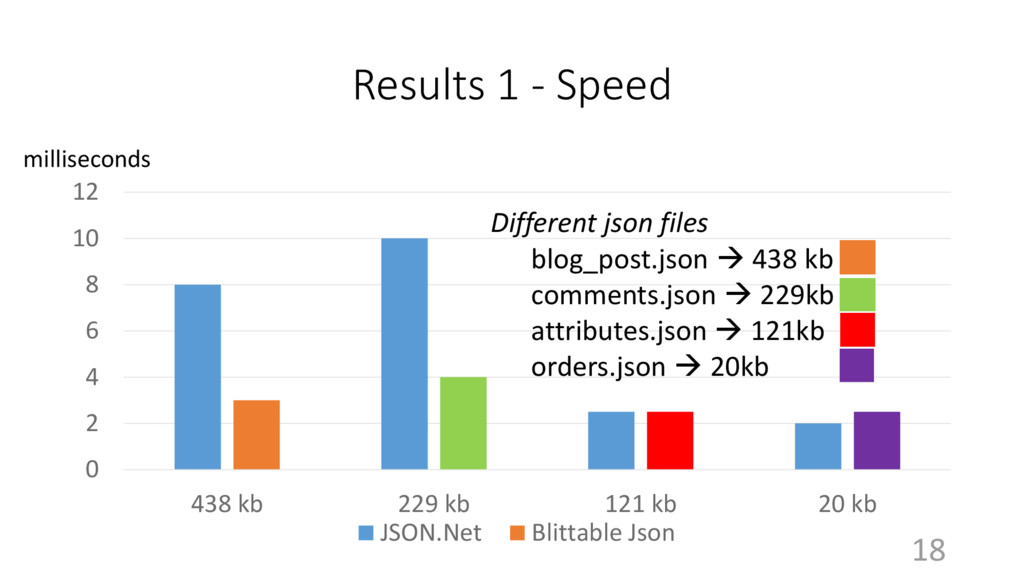
  9. Results 1 - Speed 0 2 4 6 8 10

    12 438 kb 229 kb 121 kb 20 kb JSON.Net Blittable Json milliseconds 18 Different json files blog_post.json  438 kb comments.json  229kb attributes.json  121kb orders.json  20kb
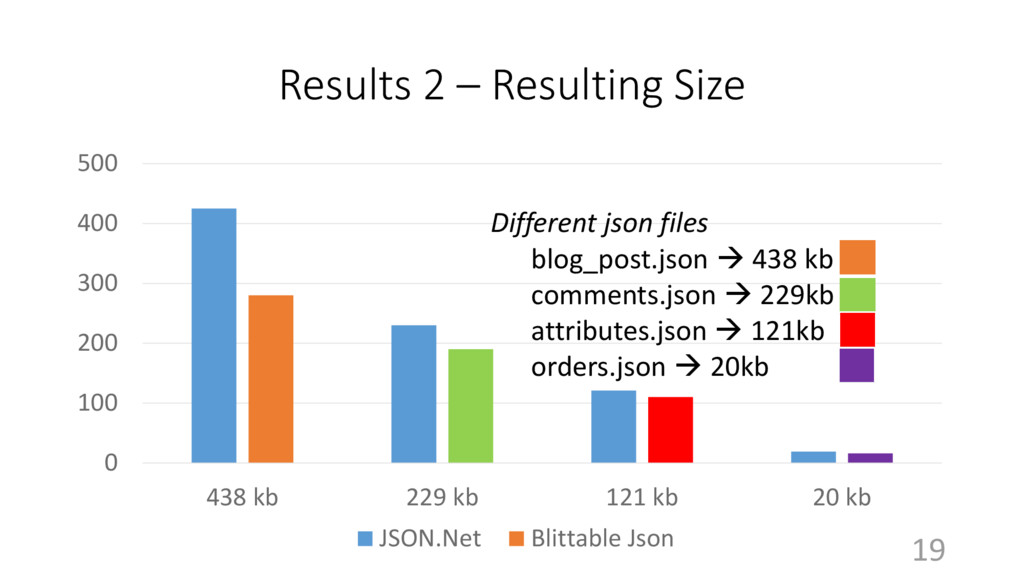
  10. Results 2 – Resulting Size 0 100 200 300 400

    500 438 kb 229 kb 121 kb 20 kb JSON.Net Blittable Json 19 Different json files blog_post.json  438 kb comments.json  229kb attributes.json  121kb orders.json  20kb
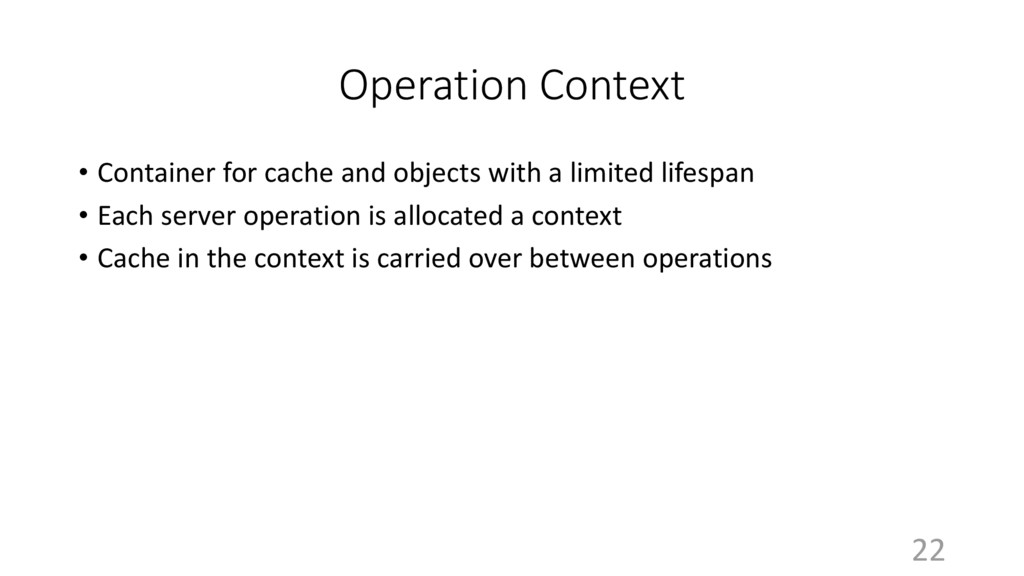
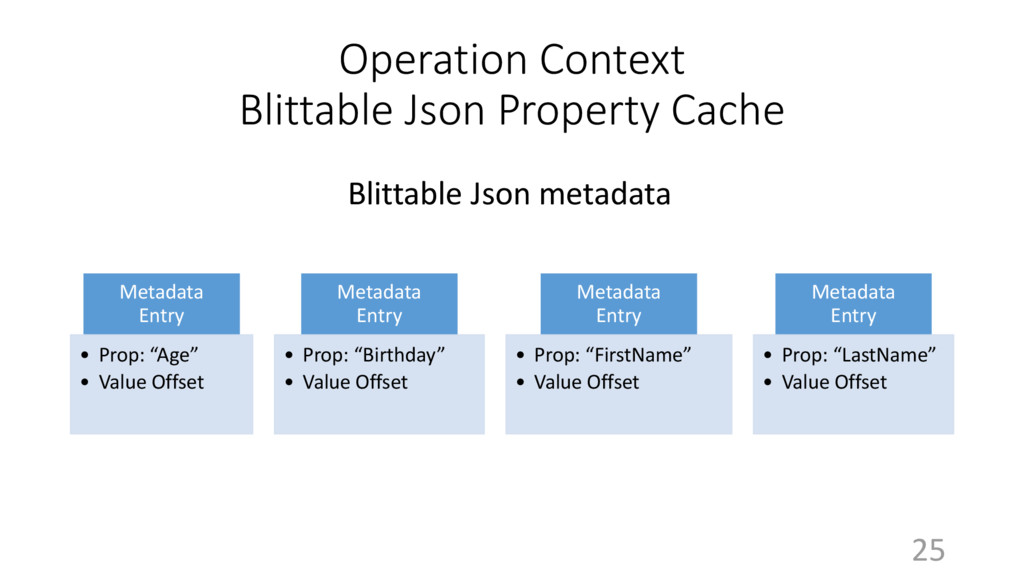
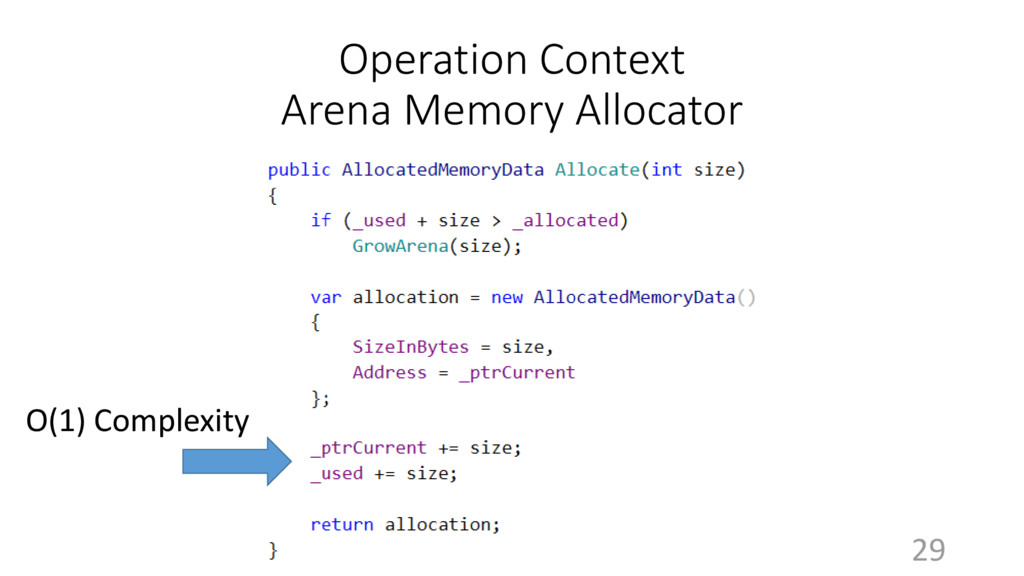
  11. Operation Context • Container for cache and objects with a

    limited lifespan • Each server operation is allocated a context • Cache in the context is carried over between operations 22
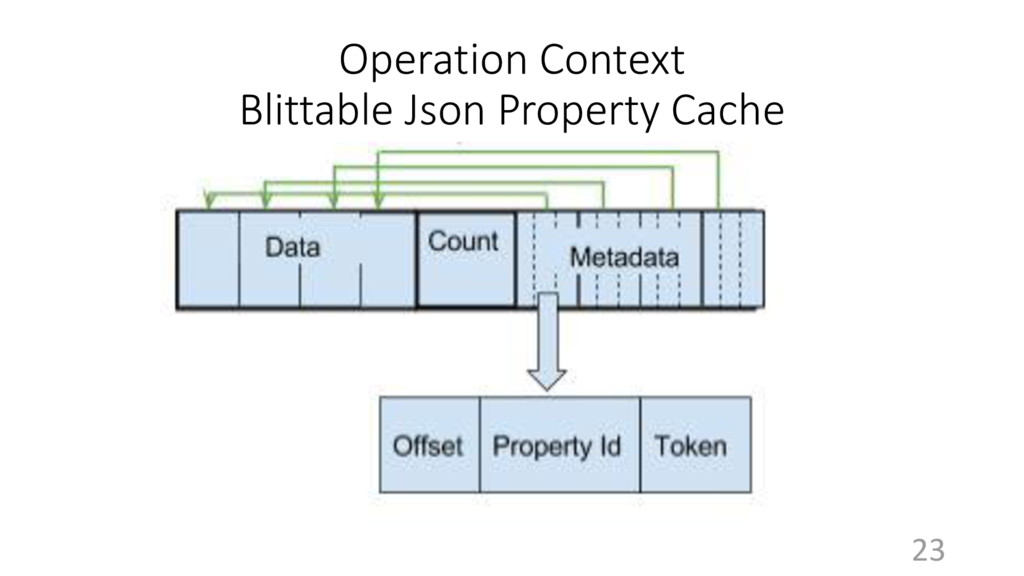
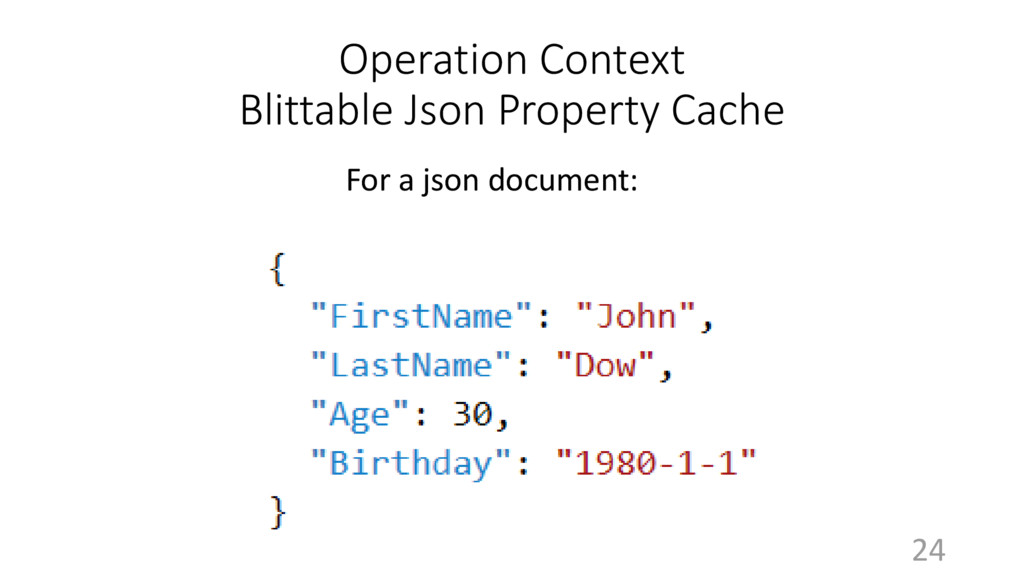
  12. Operation Context Blittable Json Property Cache Metadata Entry • Prop:

    “Age” • Value Offset Metadata Entry • Prop: “Birthday” • Value Offset Metadata Entry • Prop: “FirstName” • Value Offset Metadata Entry • Prop: “LastName” • Value Offset Blittable Json metadata 25
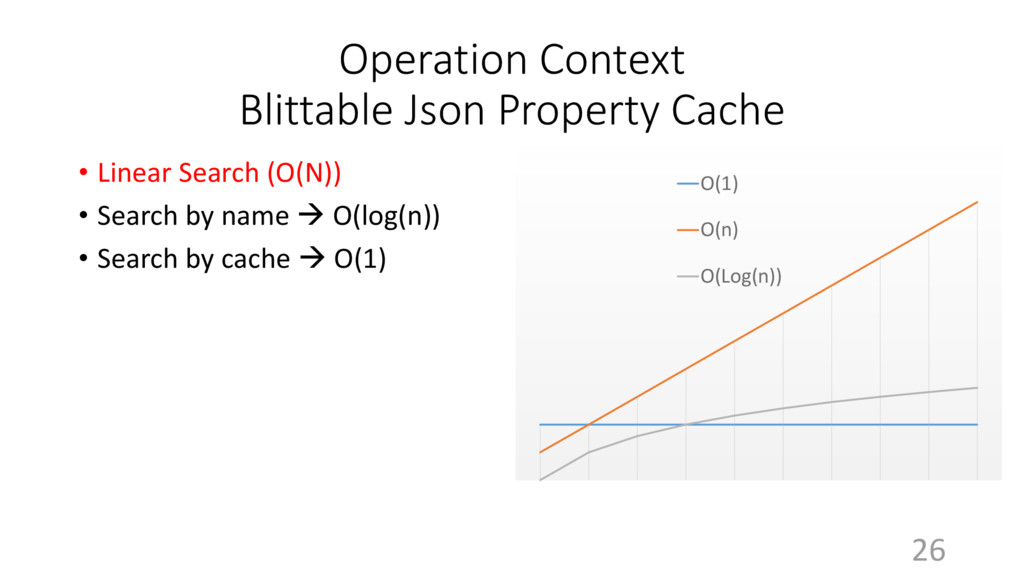
  13. O(1) O(n) O(Log(n)) Operation Context Blittable Json Property Cache •

    Linear Search (O(N)) • Search by name  O(log(n)) • Search by cache  O(1) 26
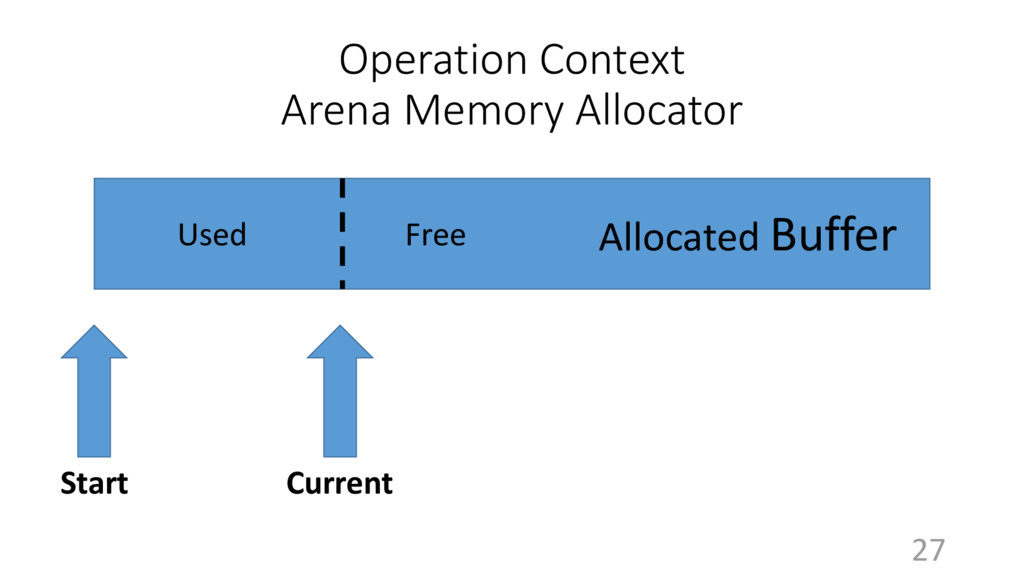
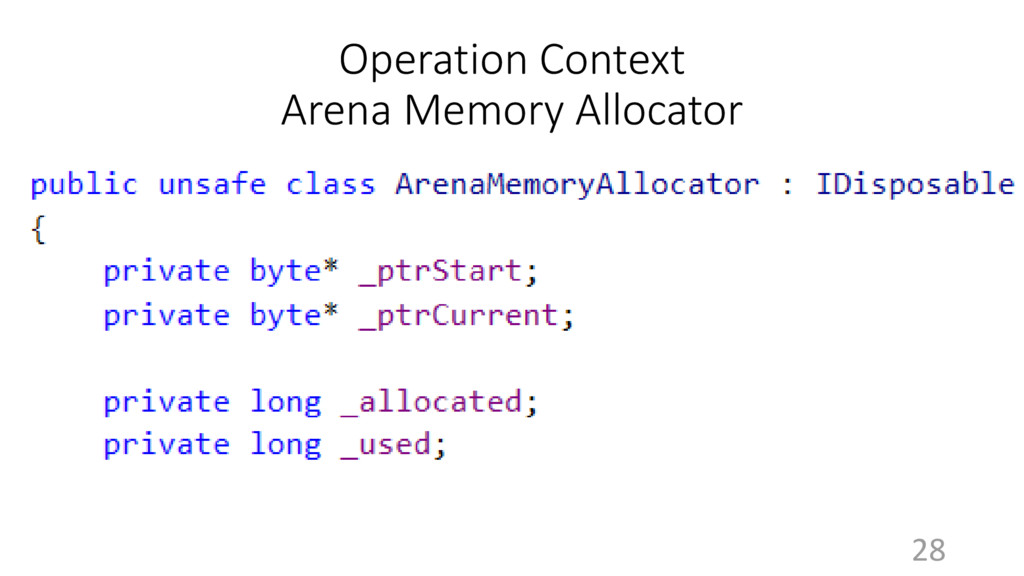
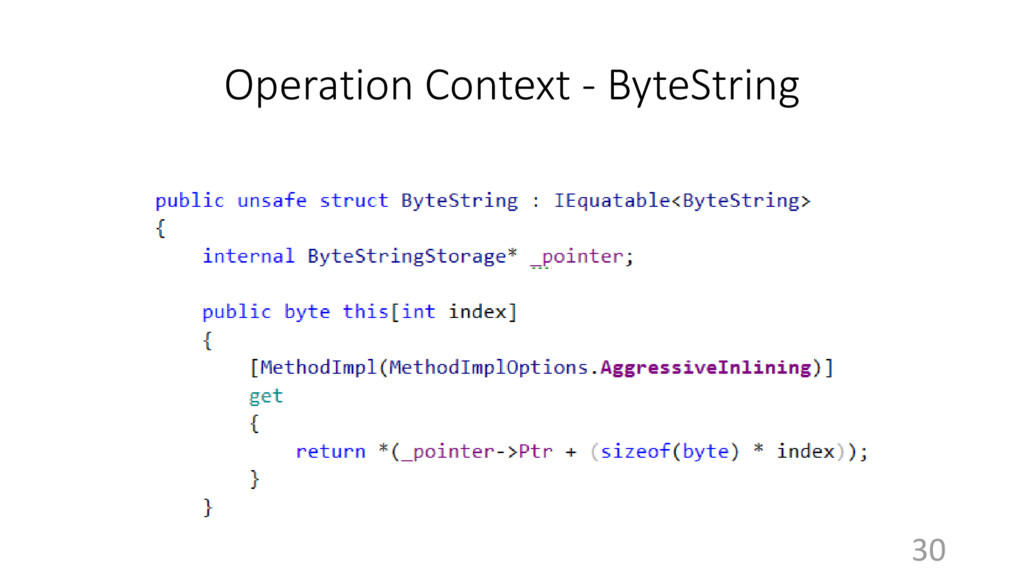
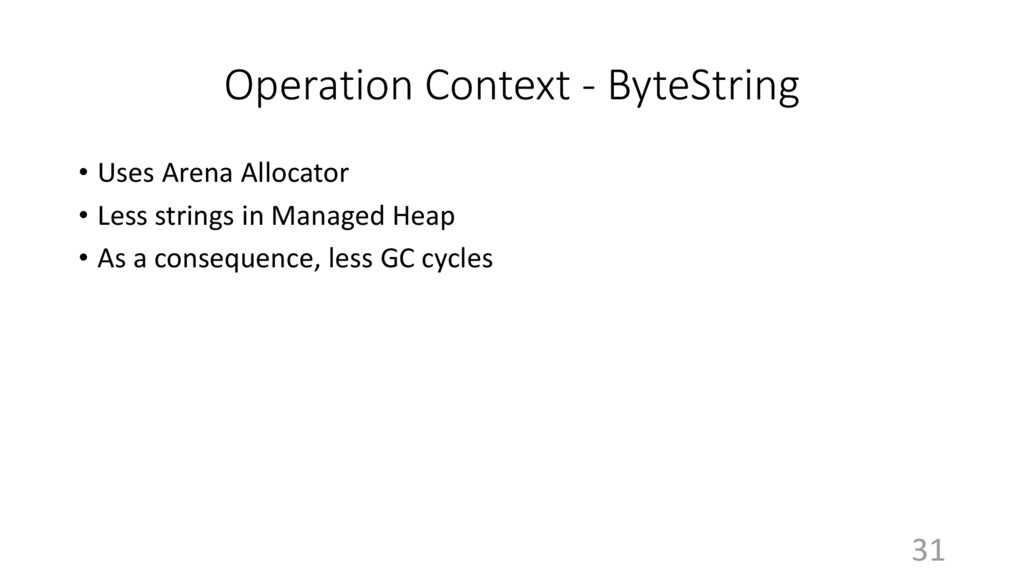
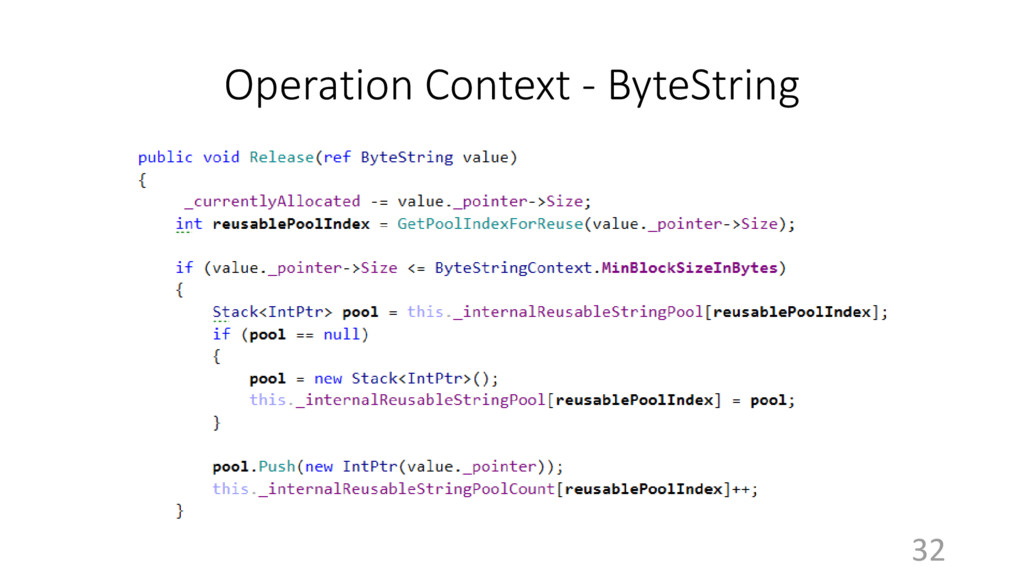
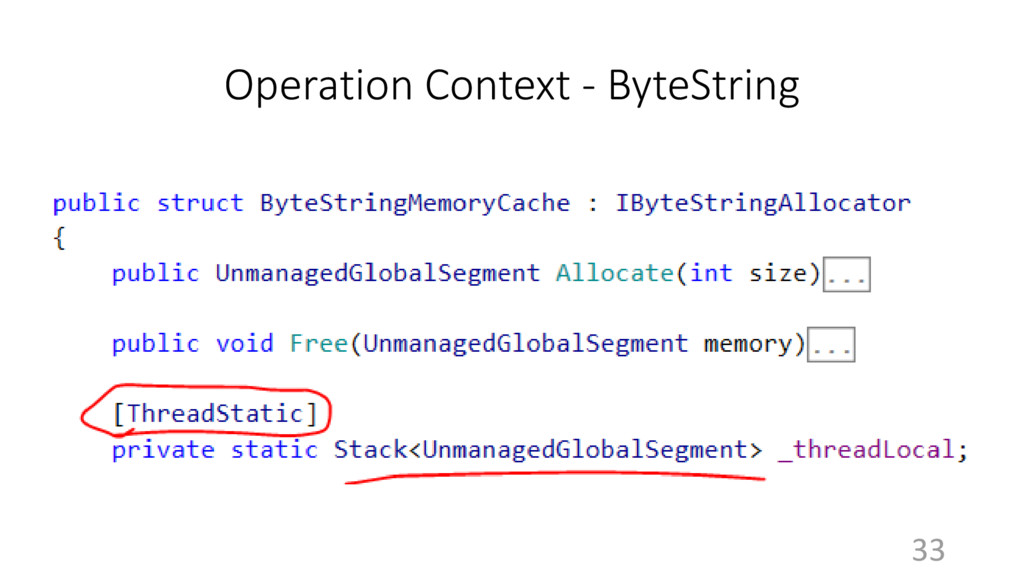
  14. Operation Context - ByteString • Uses Arena Allocator • Less

    strings in Managed Heap • As a consequence, less GC cycles 31
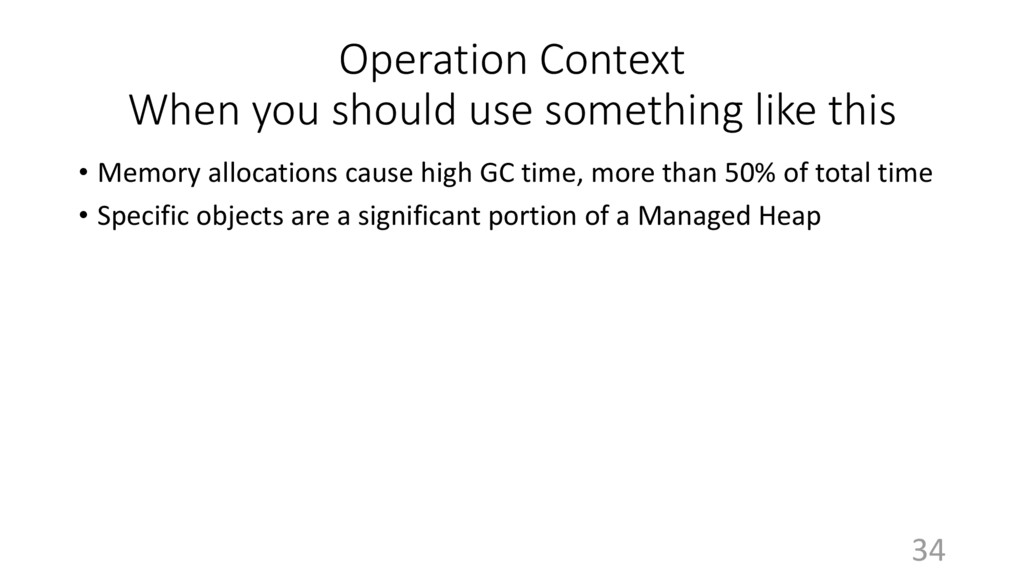
  15. Operation Context When you should use something like this •

    Memory allocations cause high GC time, more than 50% of total time • Specific objects are a significant portion of a Managed Heap 34
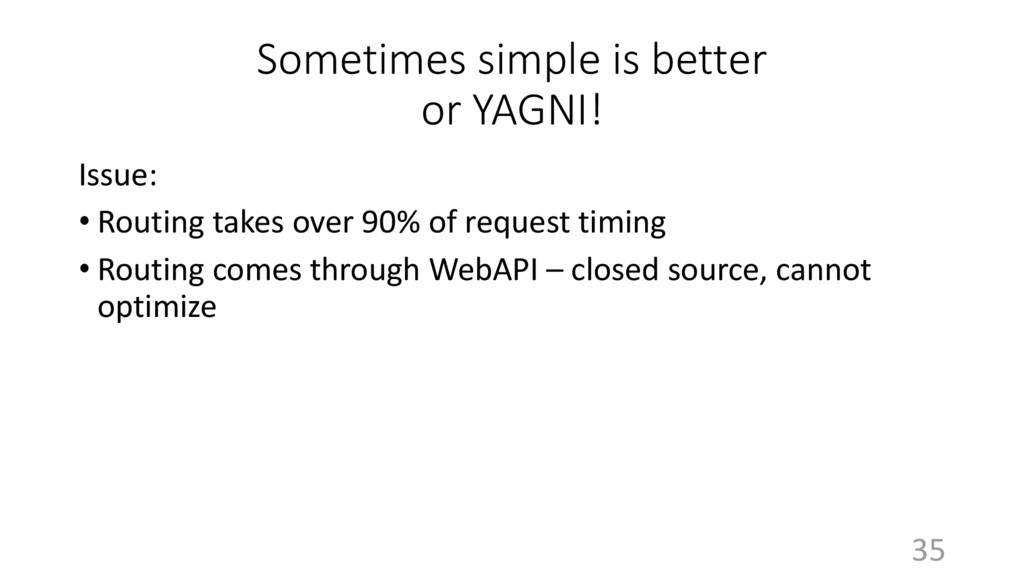
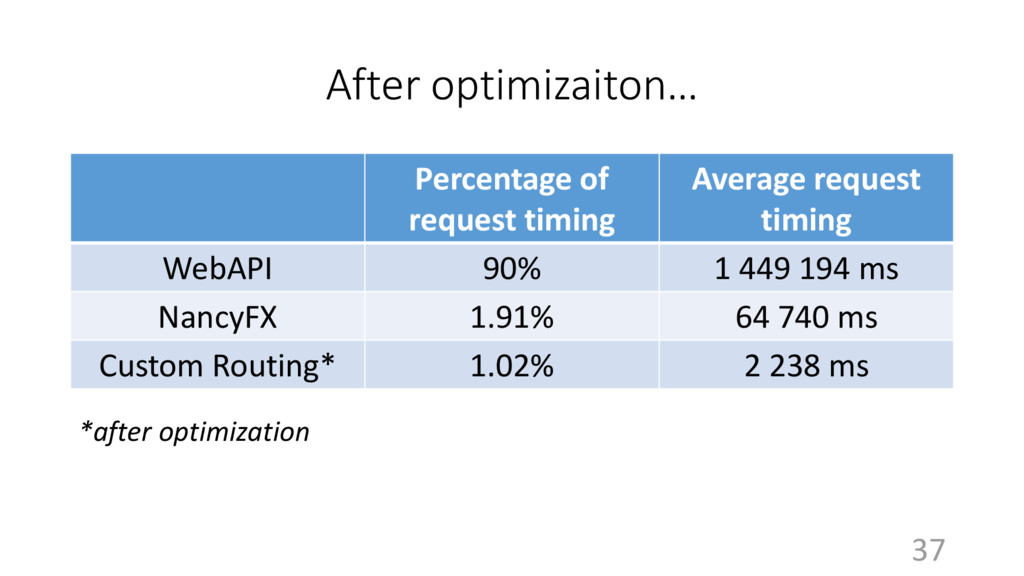
  16. Sometimes simple is better or YAGNI! Issue: • Routing takes

    over 90% of request timing • Routing comes through WebAPI – closed source, cannot optimize 35
  17. After optimizaiton… Percentage of request timing Average request timing WebAPI

    90% 1 449 194 ms NancyFX 1.91% 64 740 ms Custom Routing* 1.02% 2 238 ms *after optimization 37
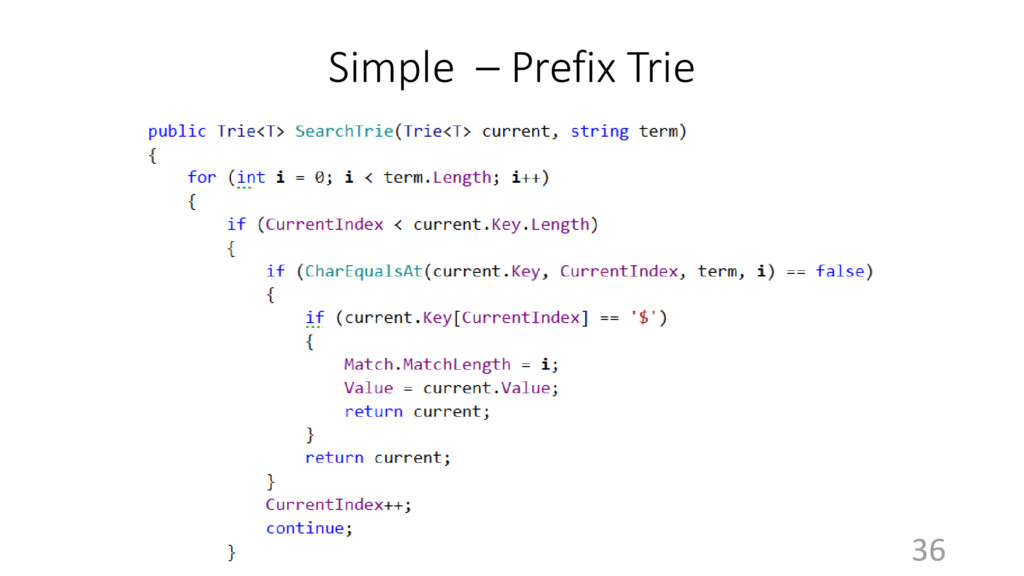
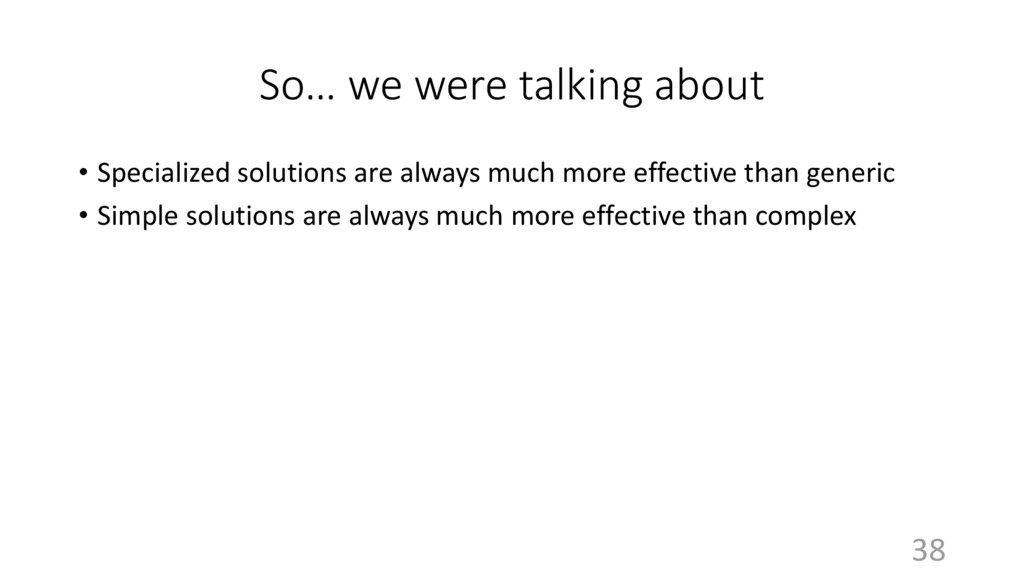
  18. So… we were talking about • Specialized solutions are always

    much more effective than generic • Simple solutions are always much more effective than complex 38
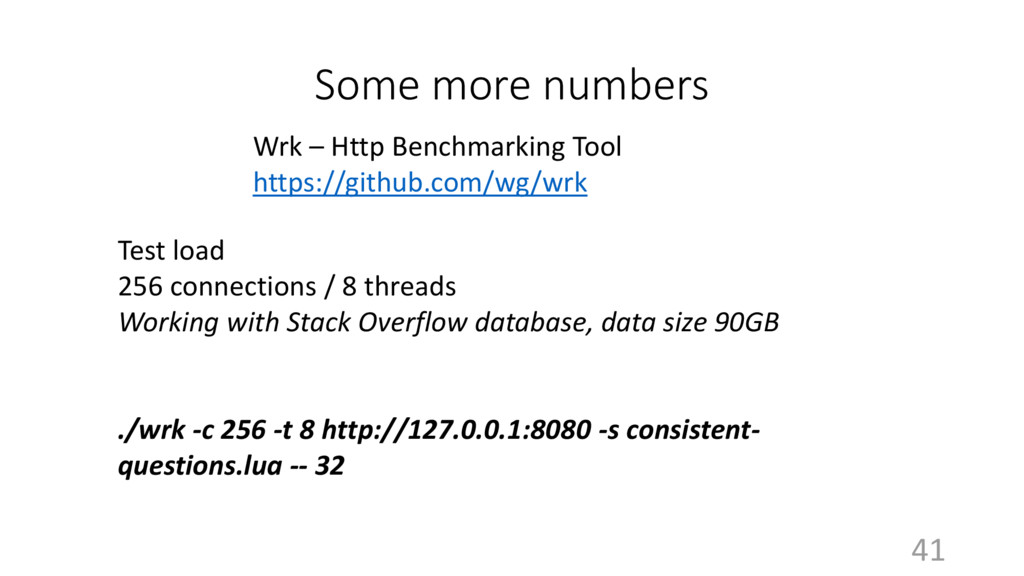
  19. Some more numbers Test load 256 connections / 8 threads

    Working with Stack Overflow database, data size 90GB ./wrk -c 256 -t 8 http://127.0.0.1:8080 -s consistent- questions.lua -- 32 Wrk – Http Benchmarking Tool https://github.com/wg/wrk 41
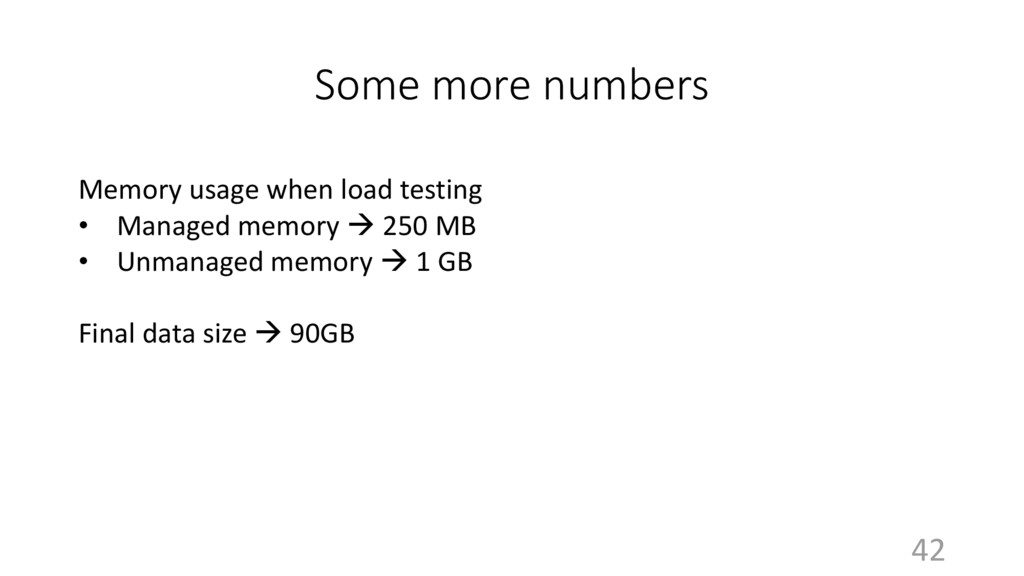
  20. Some more numbers Memory usage when load testing • Managed

    memory  250 MB • Unmanaged memory  1 GB Final data size  90GB 42
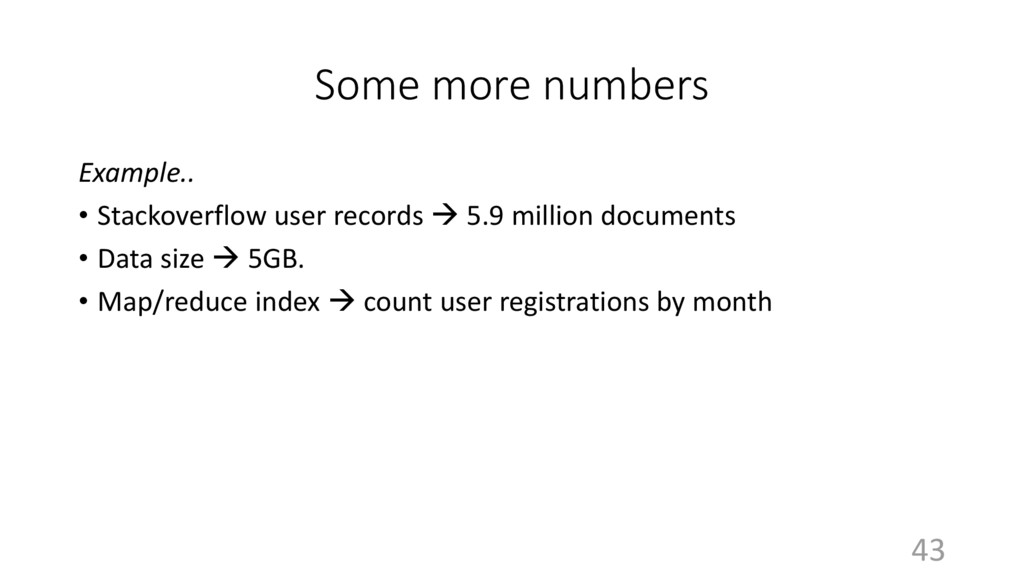
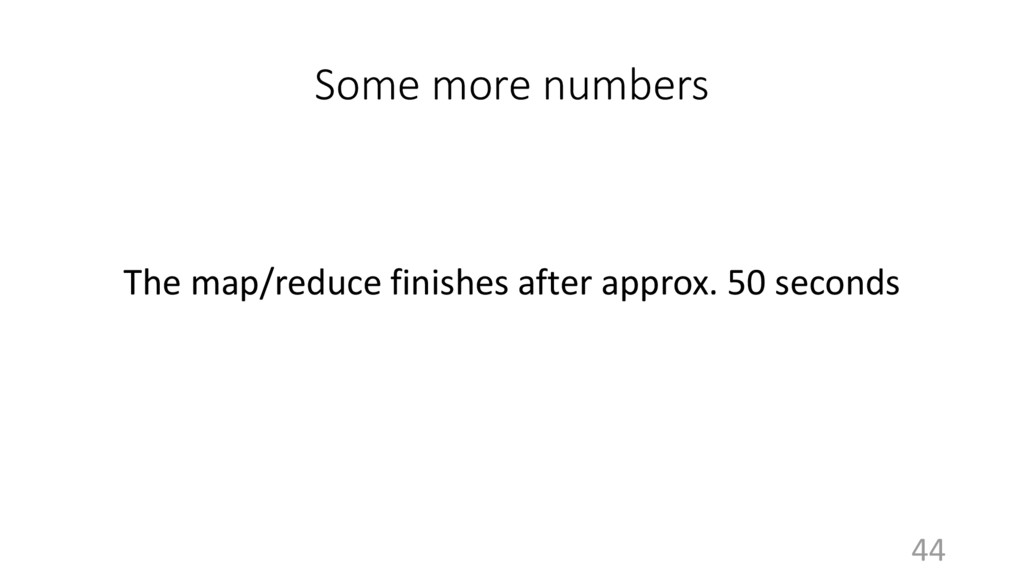
  21. Some more numbers Example.. • Stackoverflow user records  5.9

    million documents • Data size  5GB. • Map/reduce index  count user registrations by month 43
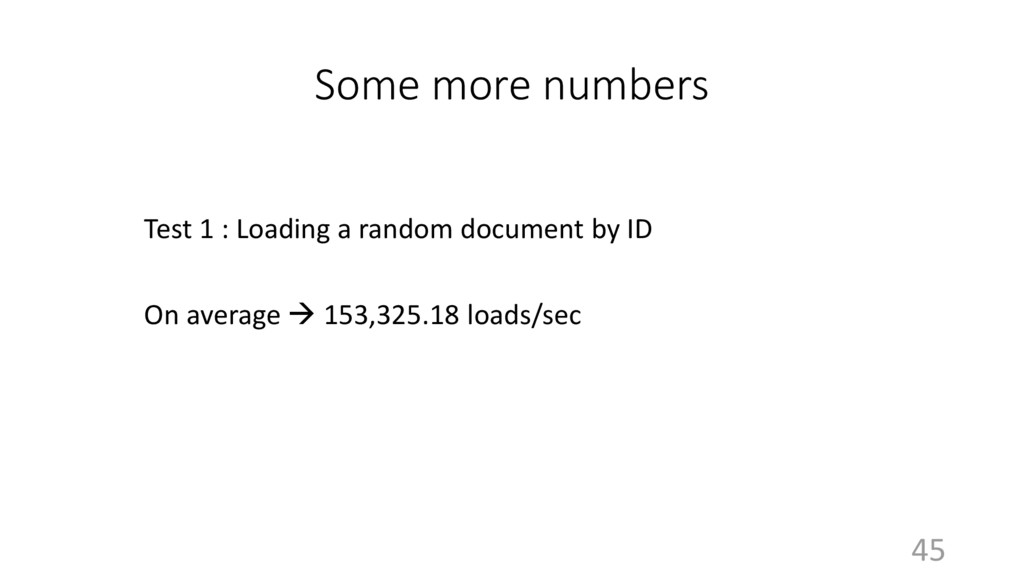
  22. Some more numbers Test 1 : Loading a random document

    by ID On average  153,325.18 loads/sec 45
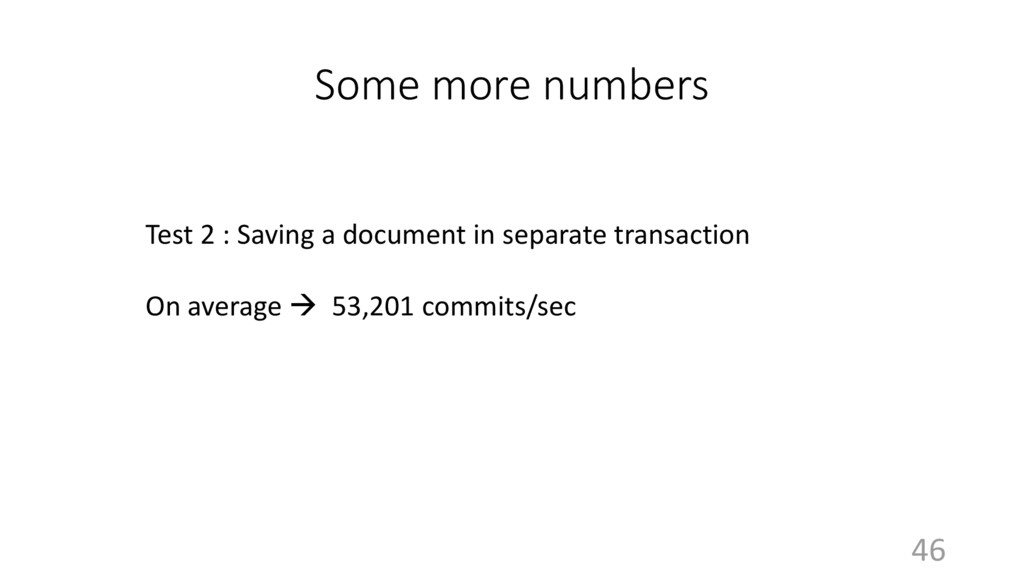
  23. Some more numbers Test 2 : Saving a document in

    separate transaction On average  53,201 commits/sec 46