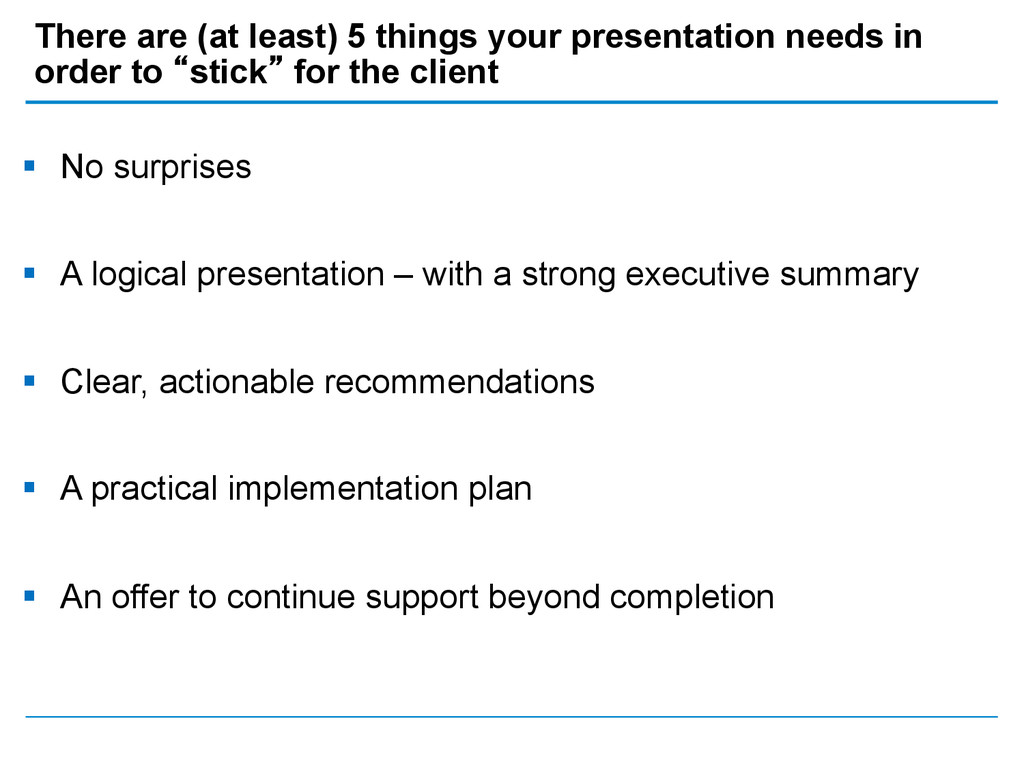
strong executive summary § Clear, actionable recommendations § A practical implementation plan § An offer to continue support beyond completion There are (at least) 5 things your presentation needs in order to “stick” for the client
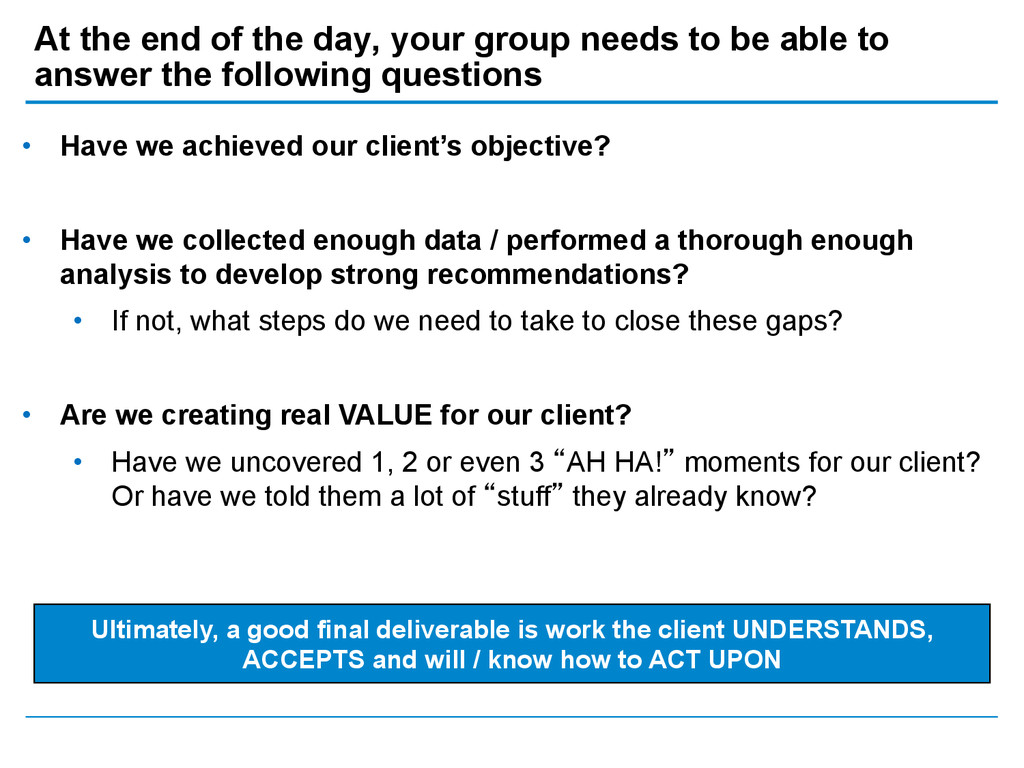
collected enough data / performed a thorough enough analysis to develop strong recommendations? • If not, what steps do we need to take to close these gaps? • Are we creating real VALUE for our client? • Have we uncovered 1, 2 or even 3 “AH HA!” moments for our client? Or have we told them a lot of “stuff” they already know? At the end of the day, your group needs to be able to answer the following questions Ultimately, a good final deliverable is work the client UNDERSTANDS, ACCEPTS and will / know how to ACT UPON
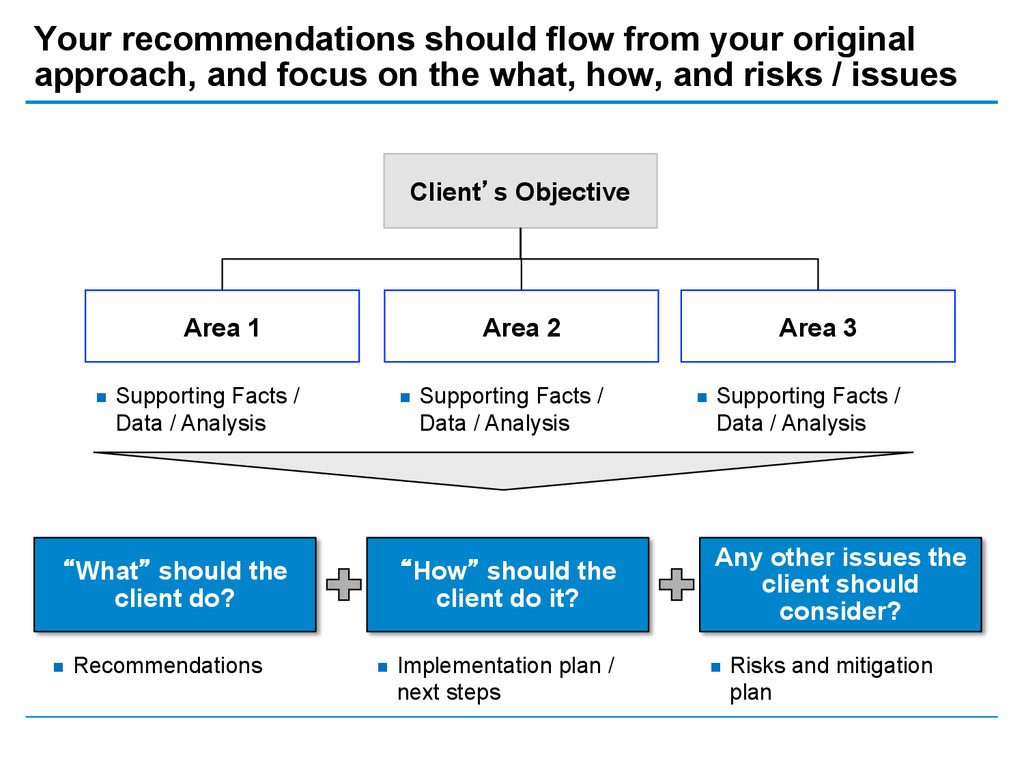
on the what, how, and risks / issues n Supporting Facts / Data / Analysis Area 1 Client’s Objective Area 2 Area 3 n Supporting Facts / Data / Analysis n Supporting Facts / Data / Analysis “What” should the client do? “How” should the client do it? Any other issues the client should consider? n Recommendations n Implementation plan / next steps n Risks and mitigation plan
they should do it § Consider short, medium and longer term steps § Don’t be afraid to list out activities, responsibilities and deadlines Your implementation plan should give your client a step- by-step guide on how to achieve the objective
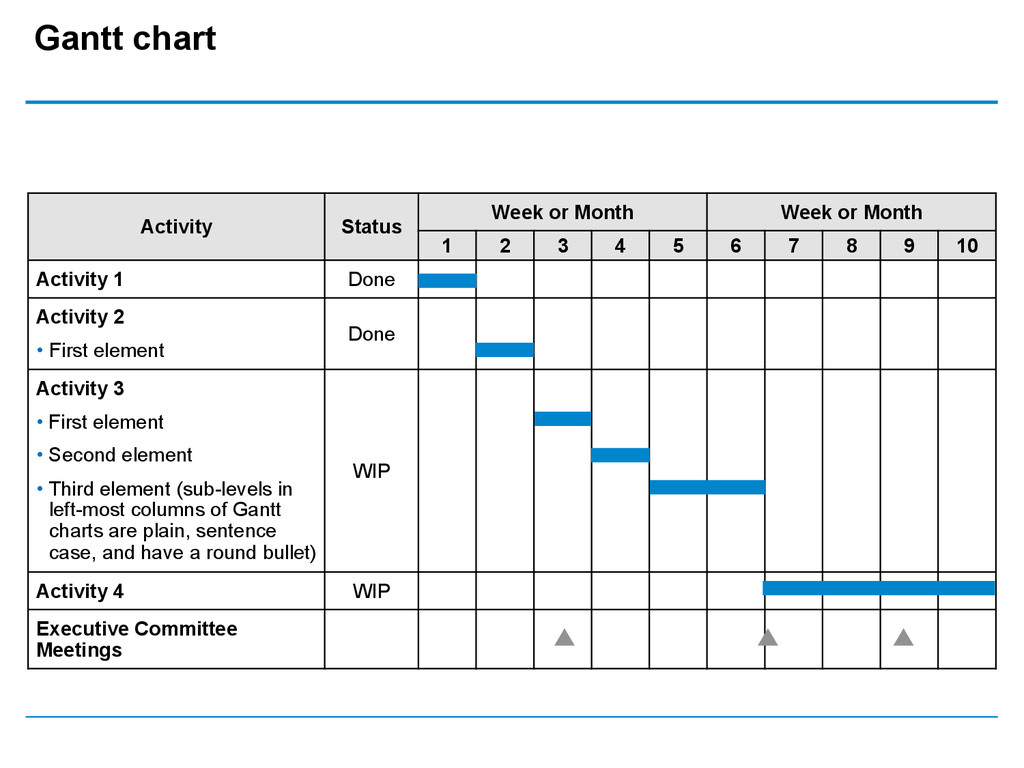
1 2 3 4 5 6 7 8 9 10 Activity 1 Done Activity 2 • First element Done Activity 3 • First element • Second element • Third element (sub-levels in left-most columns of Gantt charts are plain, sentence case, and have a round bullet) WIP Activity 4 WIP Executive Committee Meetings
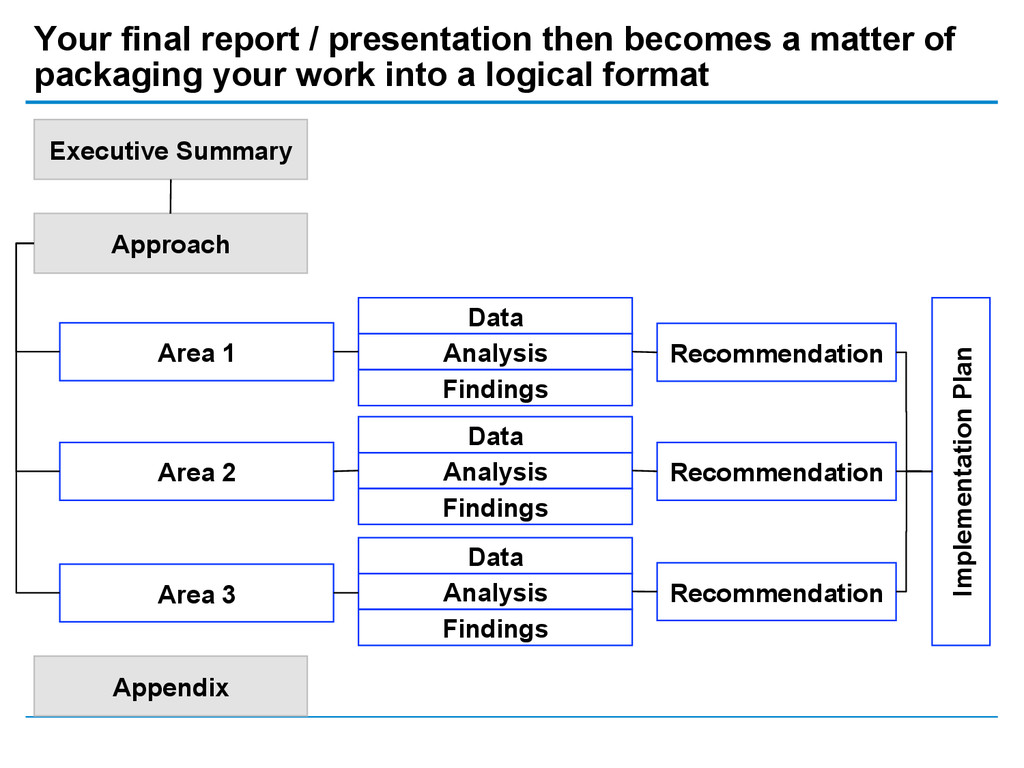
packaging your work into a logical format Area 1 Executive Summary Approach Area 2 Area 3 Appendix Data Analysis Findings Data Analysis Findings Data Analysis Findings Recommendation Recommendation Recommendation Implementation Plan
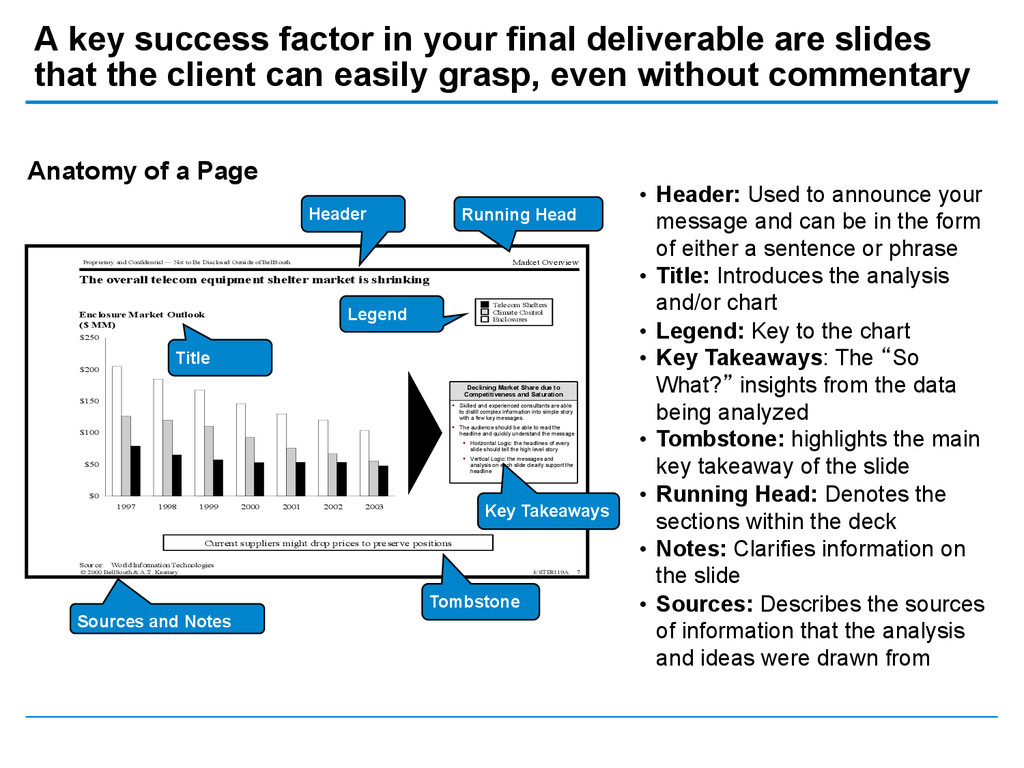
Confidential — Not to Be Disclosed Outside of BellSouth Enclosure Market Outlook ($ MM) The overall telecom equipment shelter market is shrinking Market Overview Wireless operators are relying more on smaller equipment inside “micro” and “picocells” which drives down the compensation Export market declined 9.5% during last three years further accelerating market demise $0 $50 $100 $150 $200 $250 1997 1998 1999 2000 2001 2002 2003 Telecom Shelters Climate Control Enclosures Source: World Information Technologies Current suppliers might drop prices to preserve positions • Header: Used to announce your message and can be in the form of either a sentence or phrase • Title: Introduces the analysis and/or chart • Legend: Key to the chart • Key Takeaways: The “So What?” insights from the data being analyzed • Tombstone: highlights the main key takeaway of the slide • Running Head: Denotes the sections within the deck • Notes: Clarifies information on the slide • Sources: Describes the sources of information that the analysis and ideas were drawn from Running Head Legend § Skilled and experienced consultants are able to distill complex information into simple story with a few key messages. § The audience should be able to read the headline and quickly understand the message § Horizontal Logic: the headlines of every slide should tell the high level story § Vertical Logic: the messages and analysis on each slide clearly support the headline Declining Market Share due to Competitiveness and Saturation § Skilled and experienced consultants are able to distill complex information into simple story with a few key messages. § The audience should be able to read the headline and quickly understand the message § Horizontal Logic: the headlines of every slide should tell the high level story § Vertical Logic: the messages and analysis on each slide clearly support the headline Declining Market Share due to Competitiveness and Saturation Header Title Tombstone Sources and Notes Anatomy of a Page Key Takeaways A key success factor in your final deliverable are slides that the client can easily grasp, even without commentary
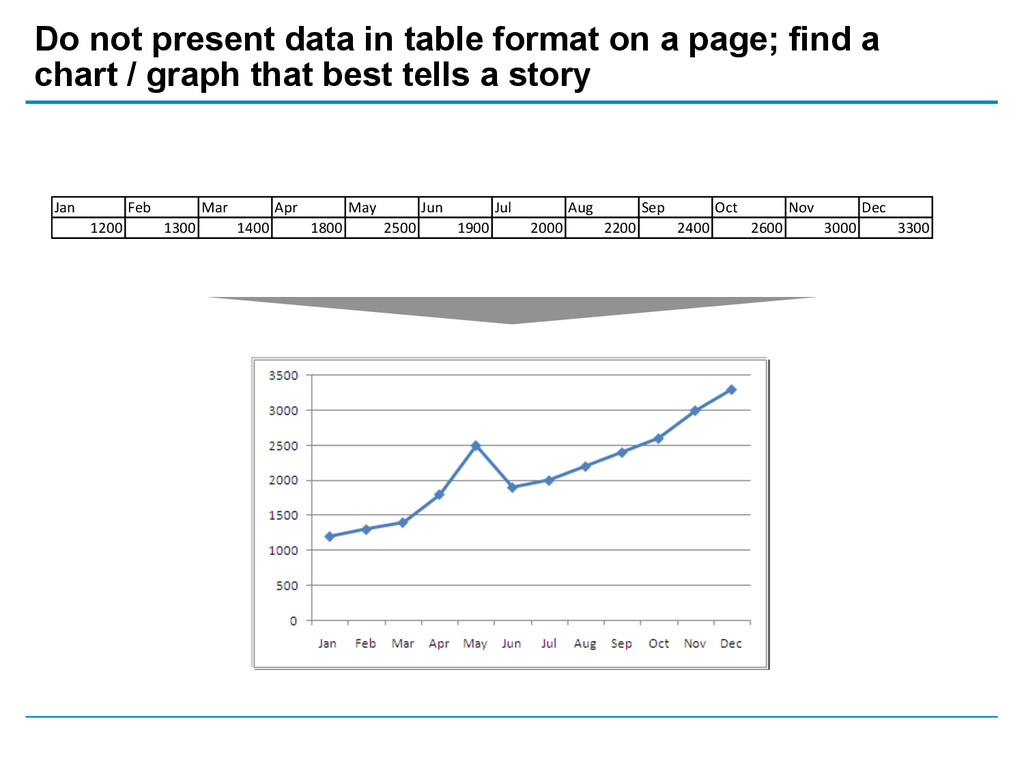
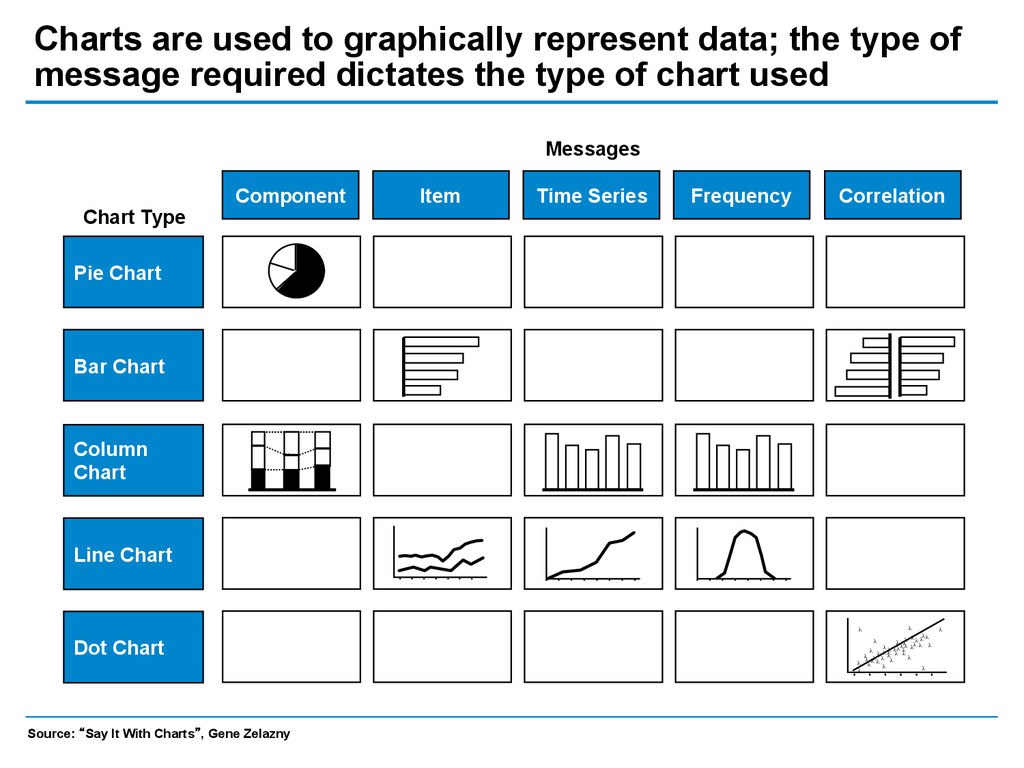
find a chart / graph that best tells a story Jan Feb Mar Apr May Jun Jul Aug Sep Oct Nov Dec 1200 1300 1400 1800 2500 1900 2000 2200 2400 2600 3000 3300
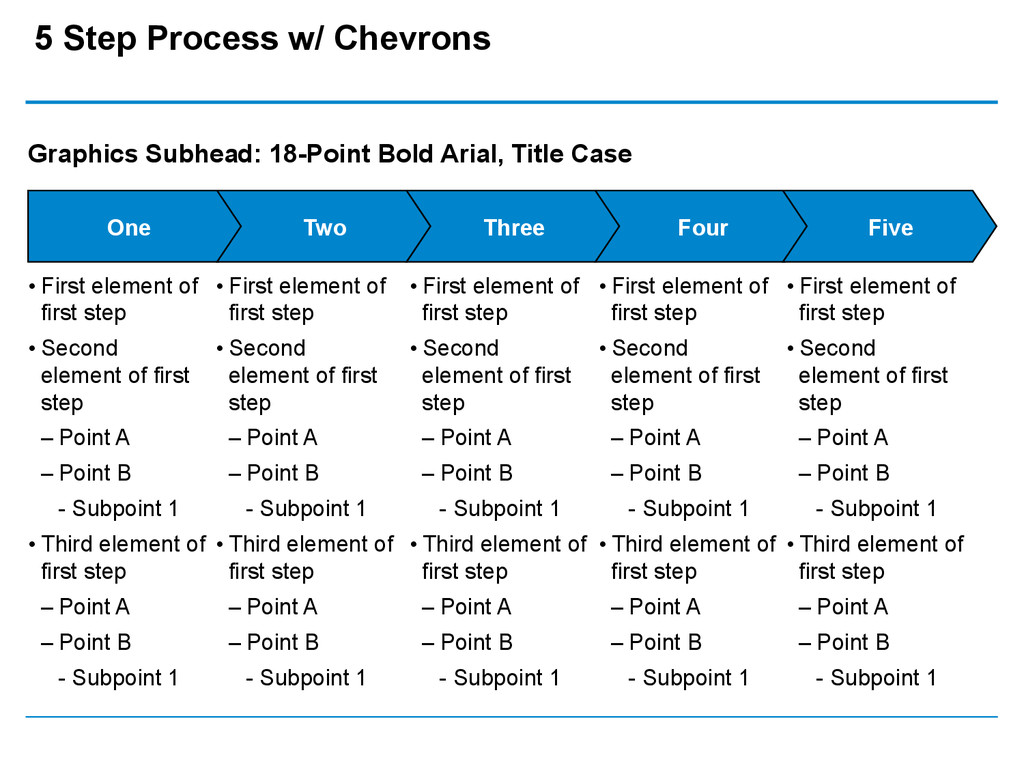
• Second element of first step – Point A – Point B - Subpoint 1 • Third element of first step – Point A – Point B - Subpoint 1 One Two Three Four Five • First element of first step • Second element of first step – Point A – Point B - Subpoint 1 • Third element of first step – Point A – Point B - Subpoint 1 • First element of first step • Second element of first step – Point A – Point B - Subpoint 1 • Third element of first step – Point A – Point B - Subpoint 1 • First element of first step • Second element of first step – Point A – Point B - Subpoint 1 • Third element of first step – Point A – Point B - Subpoint 1 • First element of first step • Second element of first step – Point A – Point B - Subpoint 1 • Third element of first step – Point A – Point B - Subpoint 1 Graphics Subhead: 18-Point Bold Arial, Title Case