Upgrade to Pro — share decks privately, control downloads, hide ads and more …

Business Model Canvas

Sponsored · Your Podcast. Everywhere. Effortlessly. Share. Educate. Inspire. Entertain. You do you. We'll handle the rest. →
Nazrin Guliyeva
October 28, 2026
4

Business Model Canvas

Business Model Canvas: Digital Stadium Management System

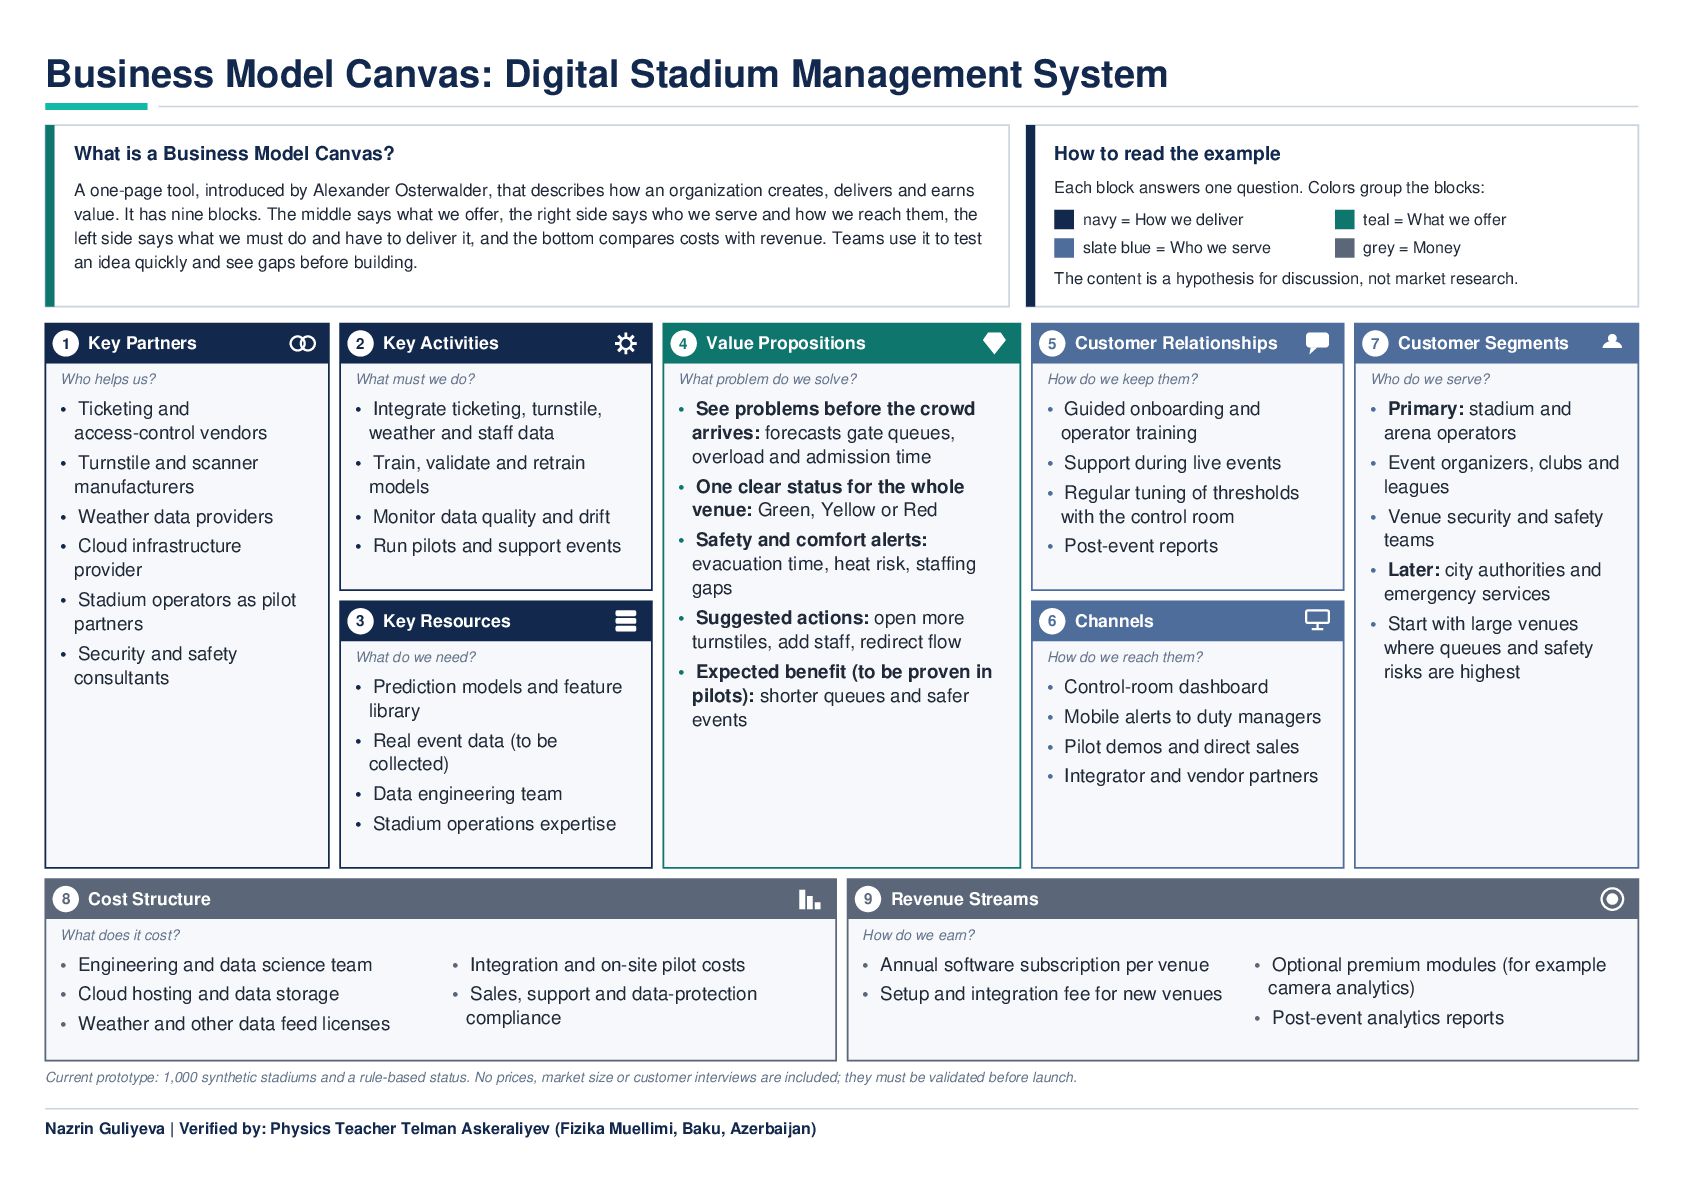
This one-page infographic uses the Business Model Canvas, a tool introduced by Alexander Osterwalder, to show how a digital stadium management system could create, deliver and earn value. The system forecasts gate queues, overload and admission time. It gives the whole venue one clear Green, Yellow or Red status, raises safety and comfort alerts, and suggests actions such as opening more turnstiles or adding staff.

The canvas covers all nine blocks: key partners, activities and resources, value propositions, customer relationships, channels, customer segments, cost structure and revenue streams. Colors group the blocks: navy for how we deliver, teal for what we offer, slate blue for who we serve and grey for money.

The content is a hypothesis for discussion, not market research. The current prototype uses 1,000 synthetic stadiums and a rule-based status, and prices, market size and customer feedback still have to be validated before launch.

Prepared by Nazrin Guliyeva. Verified by: Physics Teacher Telman Askeraliyev (Fizika Muellimi, Baku, Azerbaijan).

I can make it shorter, such as a two-line caption, or translate it into Azerbaijani if you need that.

Nazrin Guliyeva

October 28, 2026

Transcript

1 slide
  1. Business Model Canvas: Digital Stadium Management System What is a

    Business Model Canvas? How to read the example A one-page tool, introduced by Alexander Osterwalder, that describes how an organization creates, delivers and earns value. It has nine blocks. The middle says what we offer, the right side says who we serve and how we reach them, the left side says what we must do and have to deliver it, and the bottom compares costs with revenue. Teams use it to test an idea quickly and see gaps before building. Each block answers one question. Colors group the blocks: navy = How we deliver teal = What we offer slate blue = Who we serve grey = Money The content is a hypothesis for discussion, not market research. 1 Key Partners 2 Key Activities 4 Value Propositions 5 Customer Relationships 7 Customer Segments Who helps us? What must we do? What problem do we solve? How do we keep them? Who do we serve? • Ticketing and access-control vendors • Integrate ticketing, turnstile, weather and staff data • Guided onboarding and operator training • Primary: stadium and arena operators • Turnstile and scanner manufacturers • Train, validate and retrain models • See problems before the crowd arrives: forecasts gate queues, overload and admission time • Support during live events • Monitor data quality and drift • Regular tuning of thresholds with the control room • Event organizers, clubs and leagues • Weather data providers • One clear status for the whole venue: Green, Yellow or Red • Cloud infrastructure provider • Run pilots and support events • Safety and comfort alerts: evacuation time, heat risk, staffing gaps • Post-event reports • Suggested actions: open more turnstiles, add staff, redirect flow 6 • Stadium operators as pilot partners • Security and safety consultants 3 Key Resources What do we need? • Prediction models and feature library • Expected benefit (to be proven in pilots): shorter queues and safer events • Real event data (to be collected) • Venue security and safety teams • Later: city authorities and emergency services Channels How do we reach them? • Control-room dashboard • Start with large venues where queues and safety risks are highest • Mobile alerts to duty managers • Pilot demos and direct sales • Integrator and vendor partners • Data engineering team • Stadium operations expertise 8 Cost Structure 9 What does it cost? Revenue Streams How do we earn? • Engineering and data science team • Integration and on-site pilot costs • Annual software subscription per venue • Cloud hosting and data storage • Sales, support and data-protection compliance • Setup and integration fee for new venues • Weather and other data feed licenses Current prototype: 1,000 synthetic stadiums and a rule-based status. No prices, market size or customer interviews are included; they must be validated before launch. Nazrin Guliyeva | Verified by: Physics Teacher Telman Askeraliyev (Fizika Muellimi, Baku, Azerbaijan) • Optional premium modules (for example camera analytics) • Post-event analytics reports