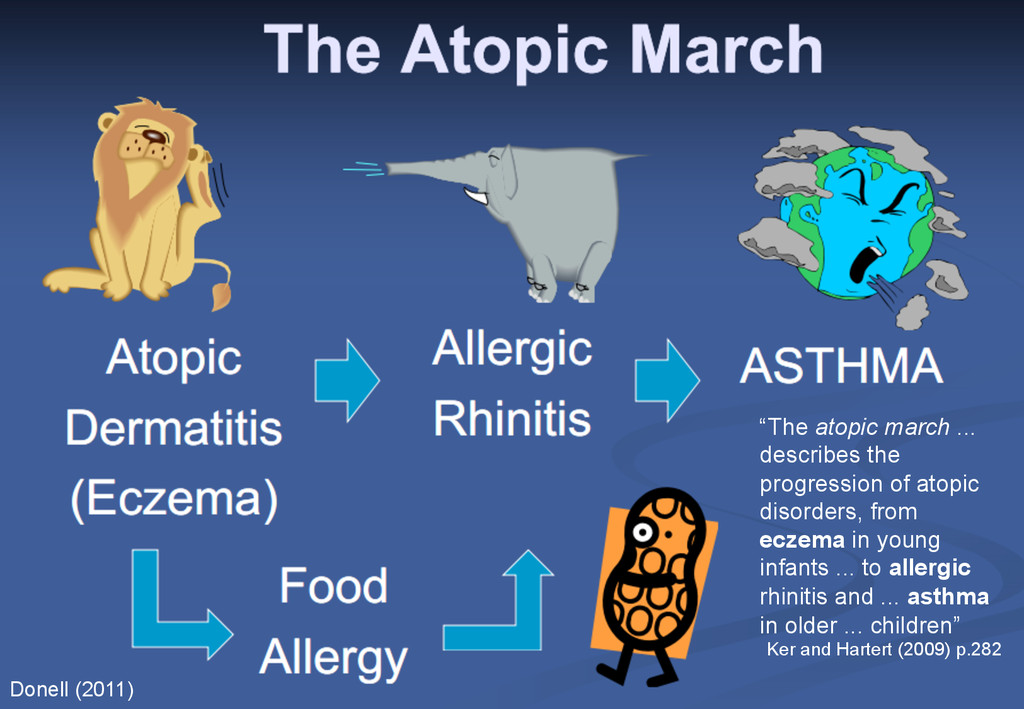
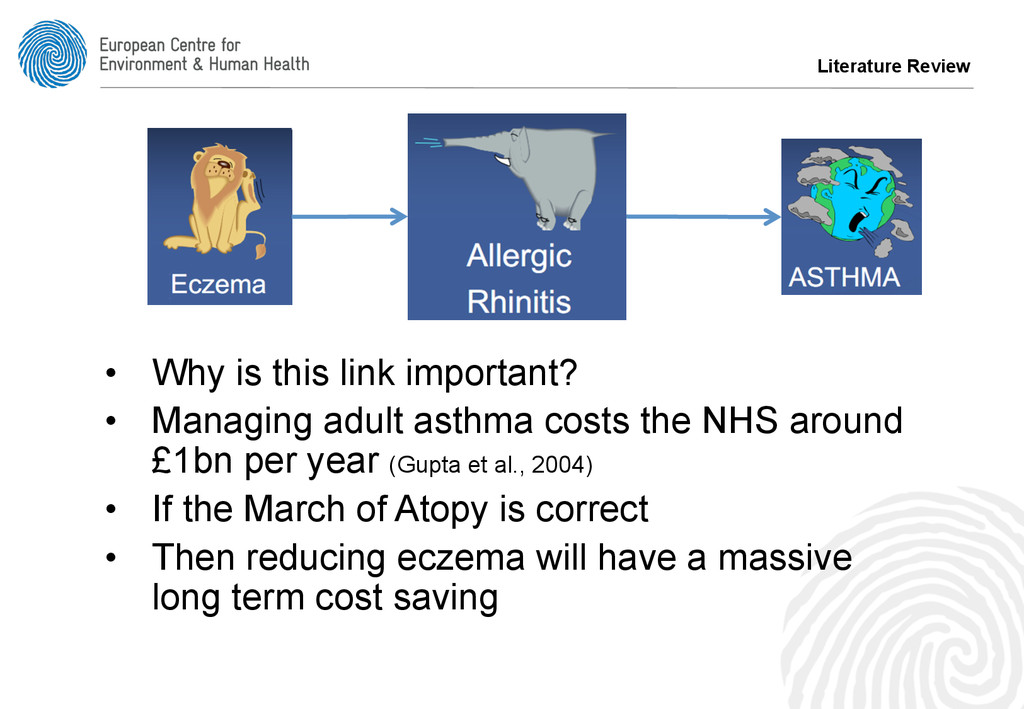
progression of atopic disorders, from eczema in young infants ... to allergic rhinitis and ... asthma in older ... children” Ker and Hartert (2009) p.282 Donell (2011)
adult asthma costs the NHS around £1bn per year (Gupta et al., 2004) • If the March of Atopy is correct • Then reducing eczema will have a massive long term cost saving
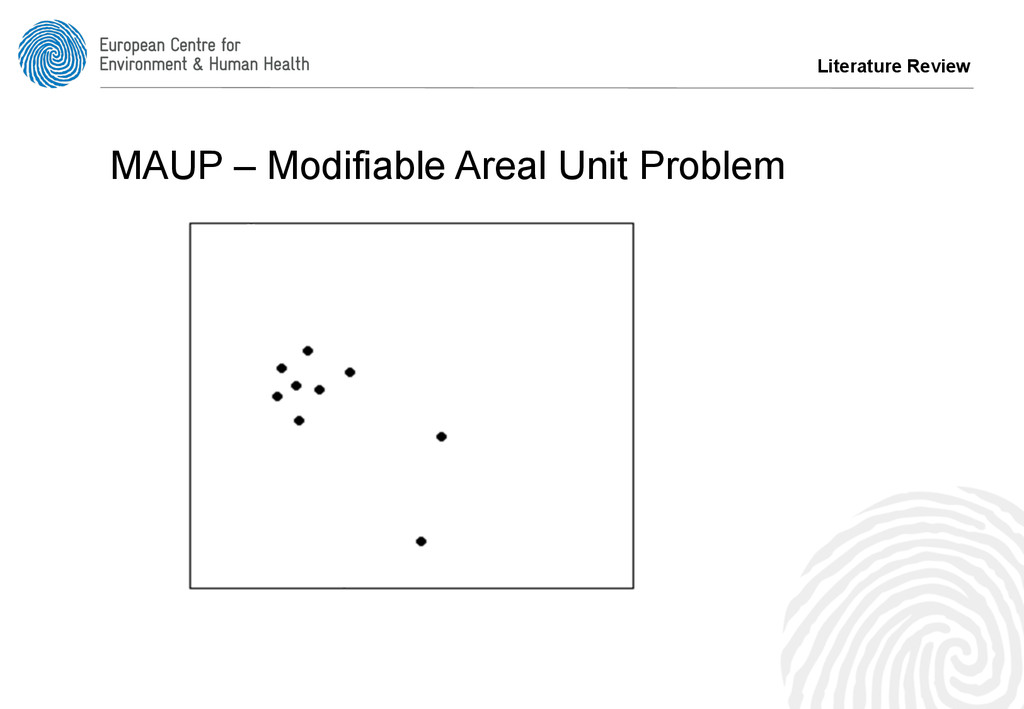
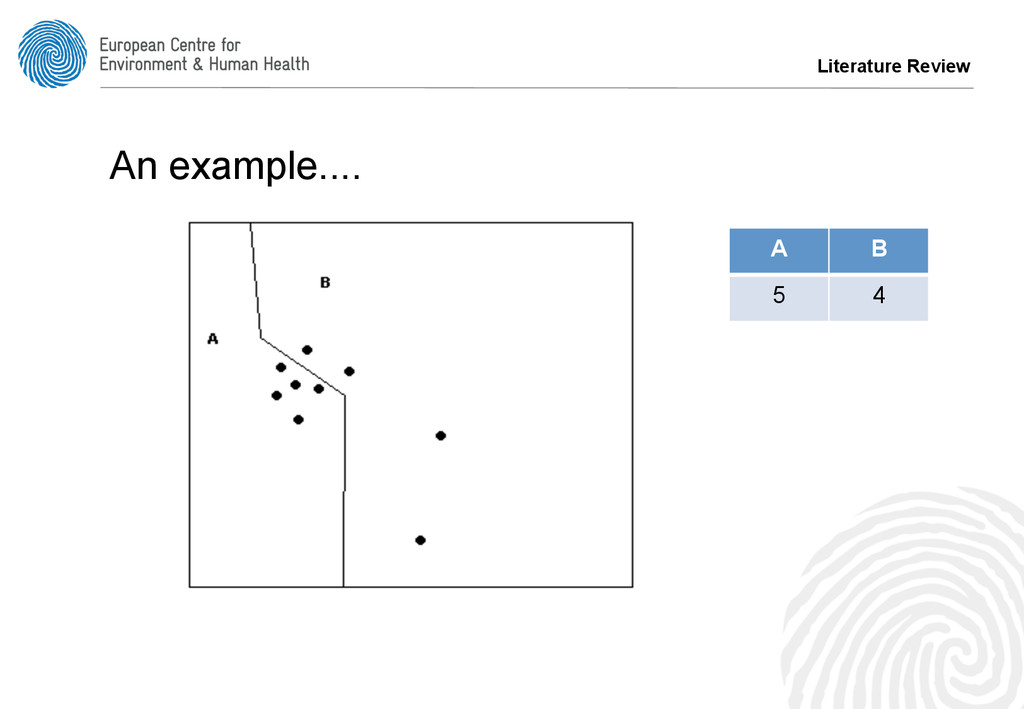
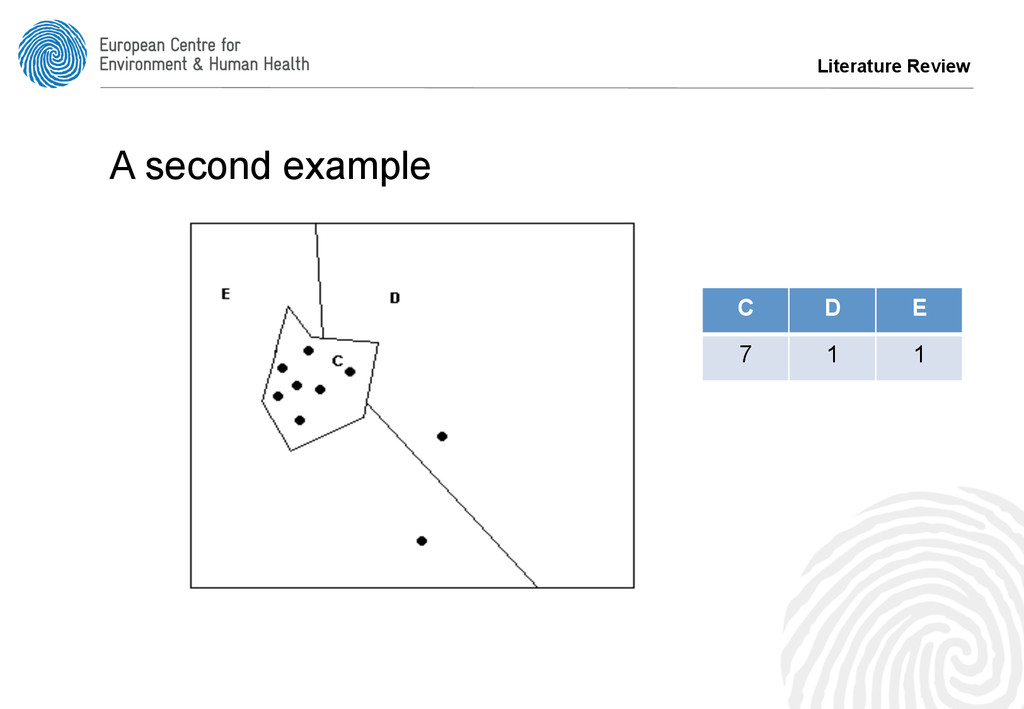
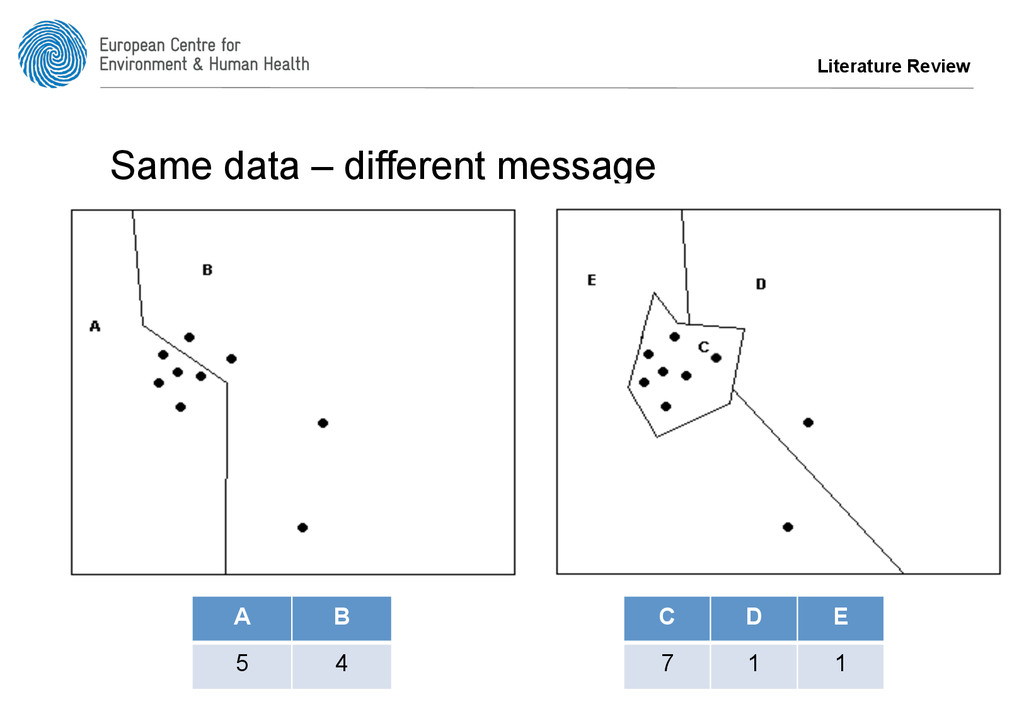
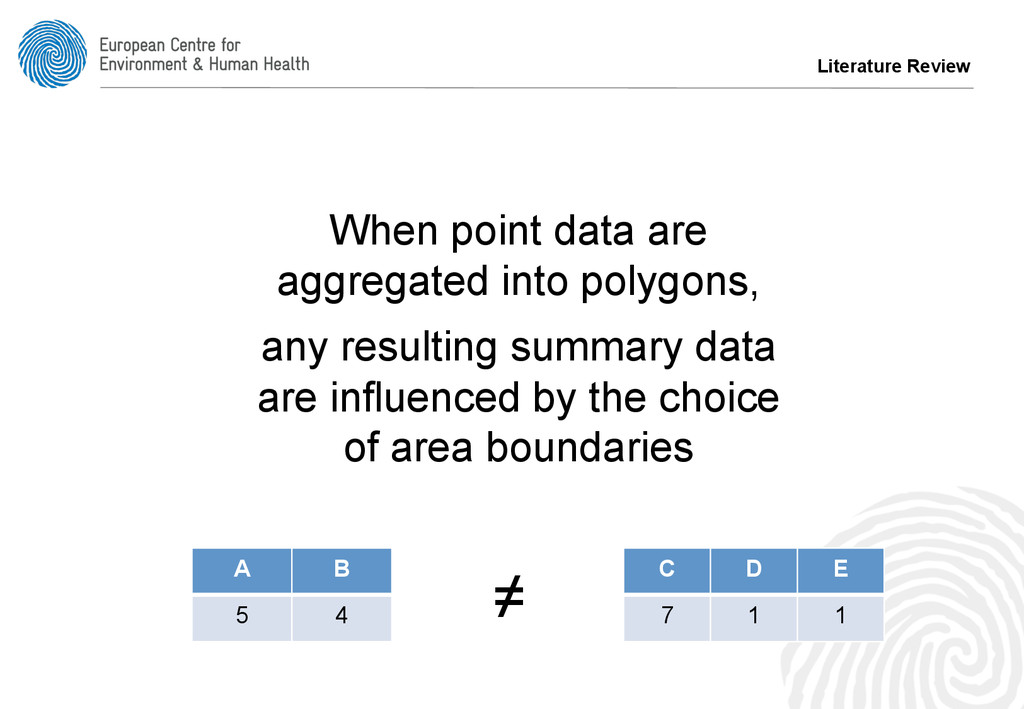
are aggregated into larger units, so individuals can’t be identified – GP Practice, PCT (Primary Care Trust) – SHA (Strategic Health Authority) – County, Post Codes, Census Output Areas, Wards • As users of GIS we know this matters…
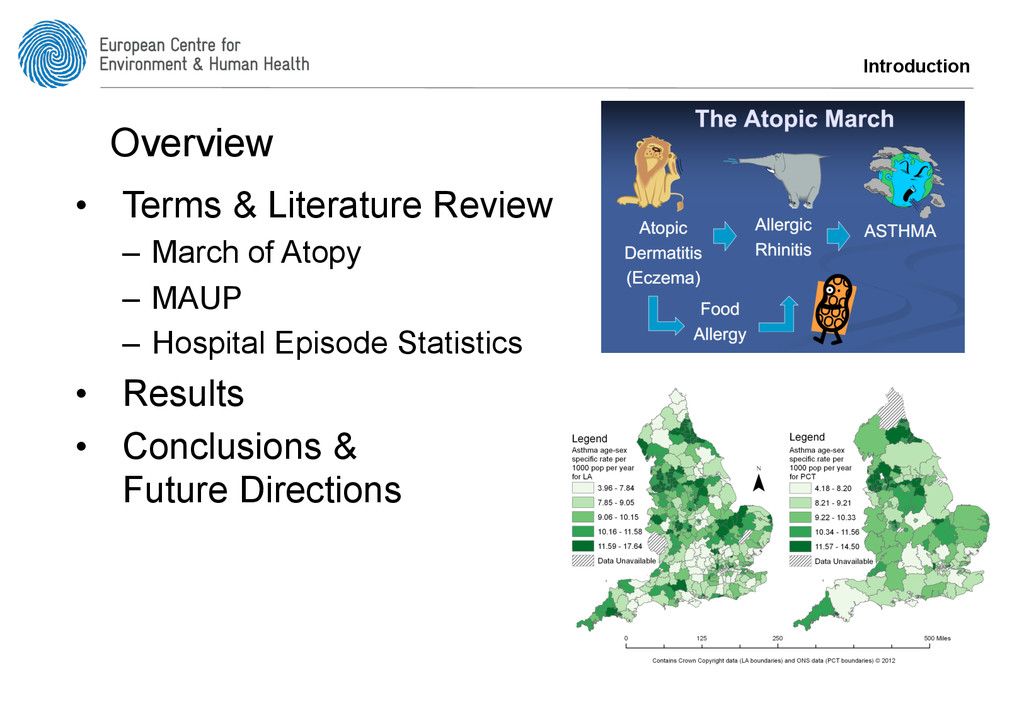
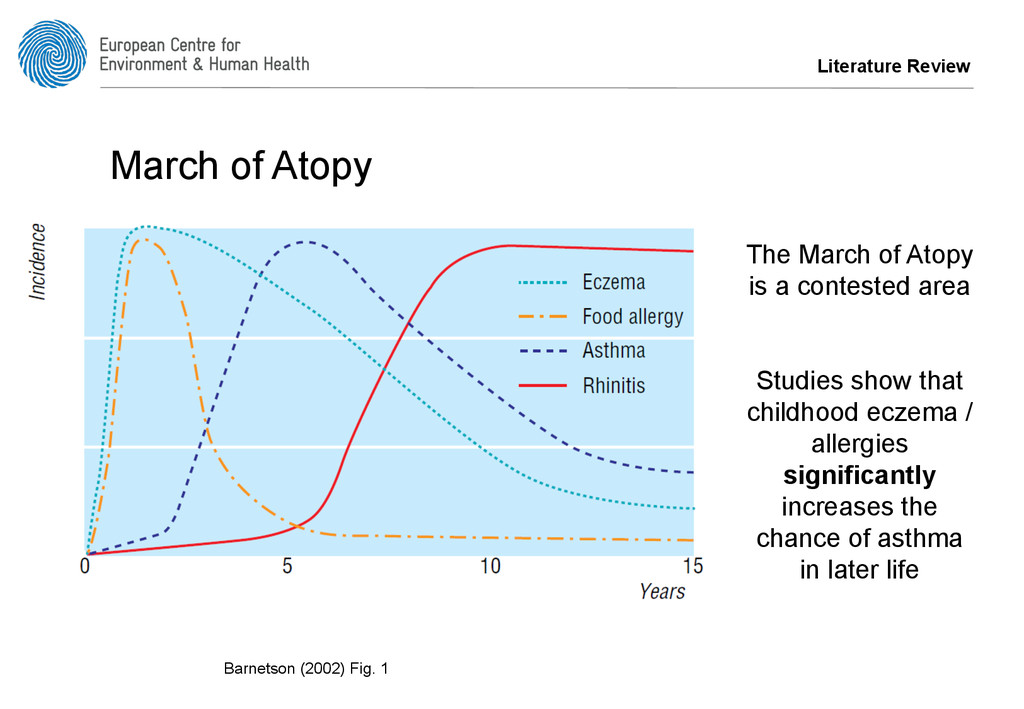
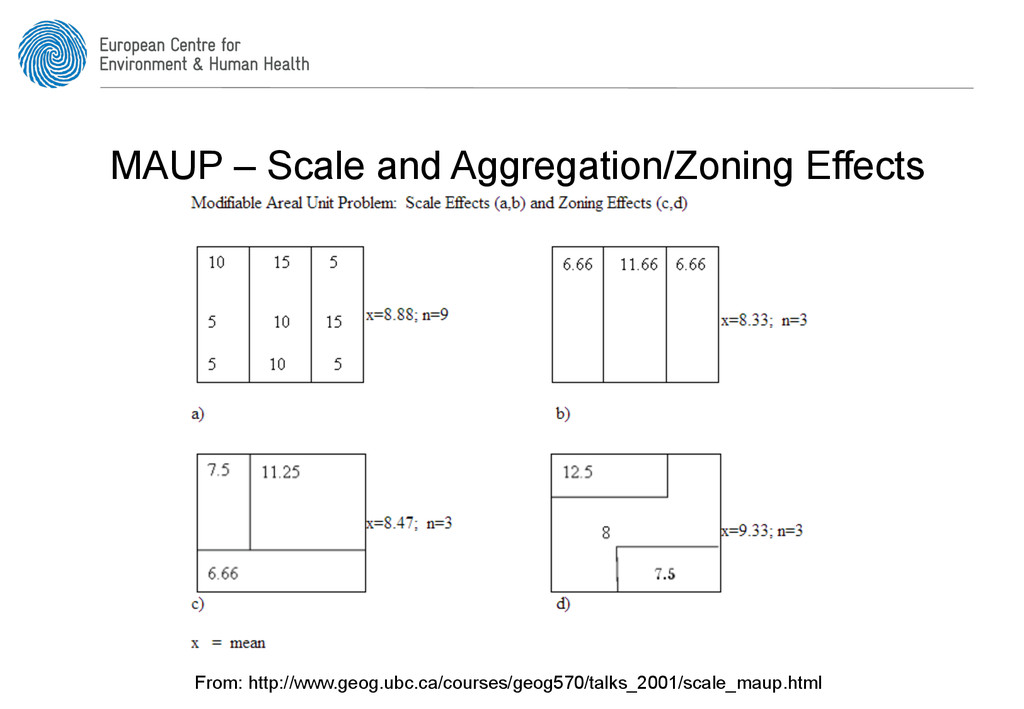
studies do not discuss aggregation of data • Often epidemiological studies ignore MAUP • Is MAUP partly responsible for the contested nature of the March of Atopy? – Compare the relationship between asthma, eczema and allergy data – At different spatial aggregation levels Literature Review
patients to hospital – emergency (e.g. A&E) and referral (e.g. from GP) • Positives – Good spatial coverage for England – Comprehensive • Negatives – Only capture severe cases – Issues with small numbers / confidentiality
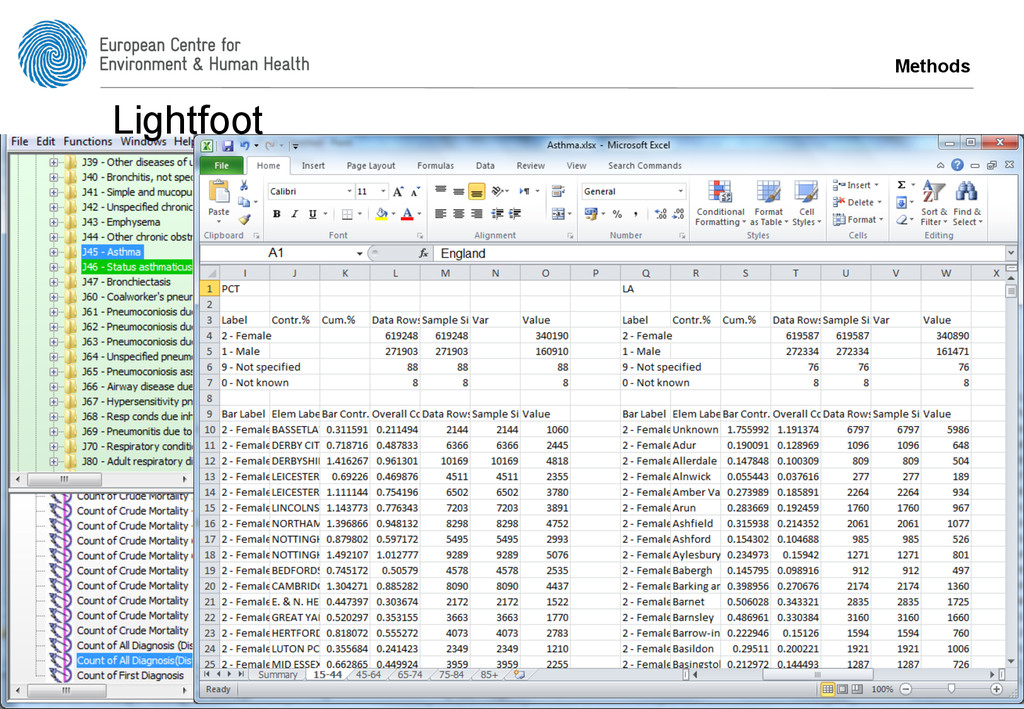
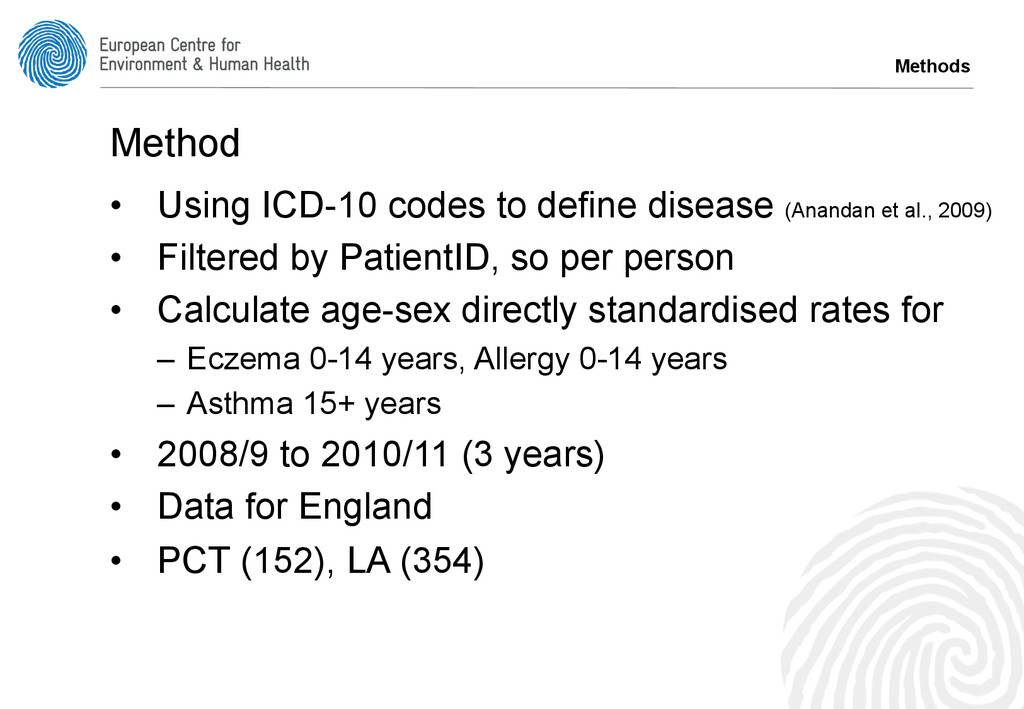
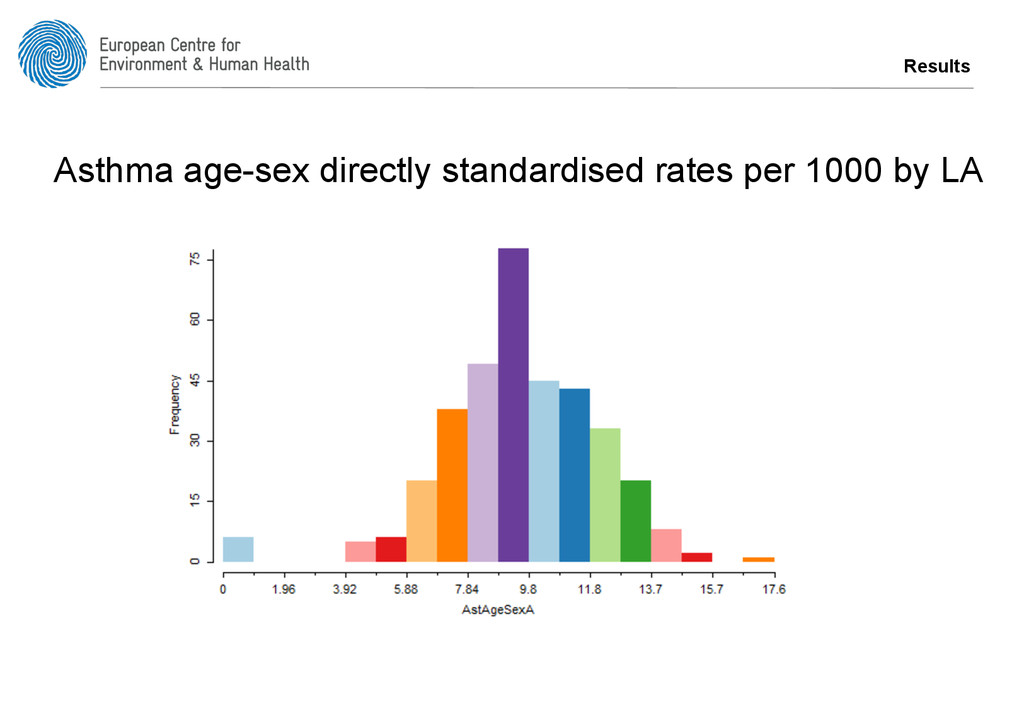
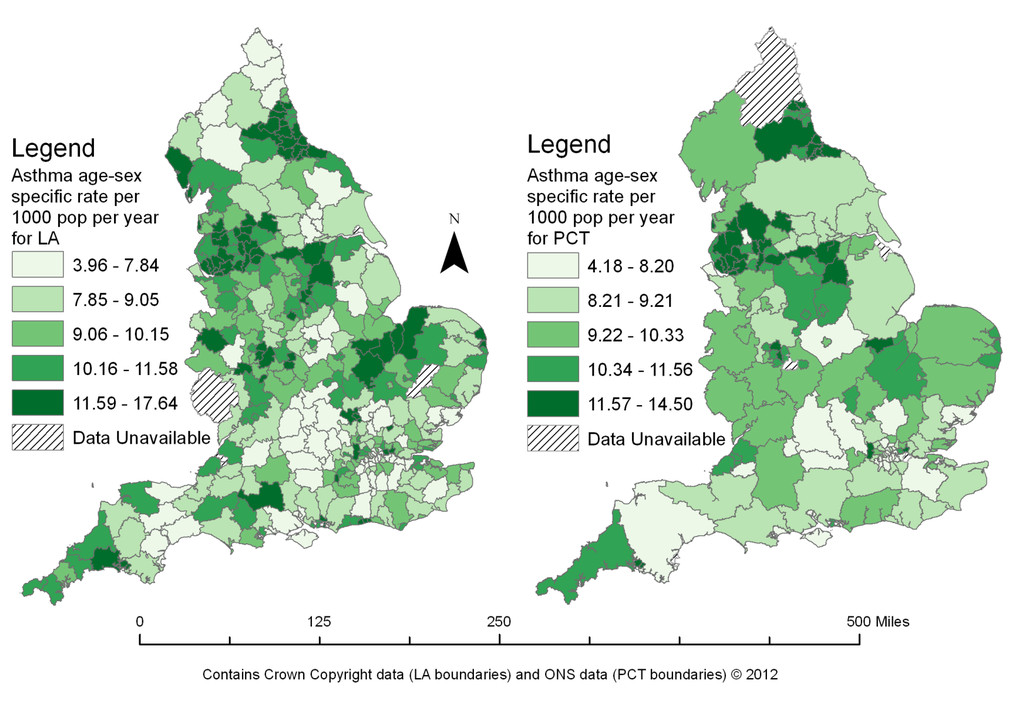
al., 2009) • Filtered by PatientID, so per person • Calculate age-sex directly standardised rates for – Eczema 0-14 years, Allergy 0-14 years – Asthma 15+ years • 2008/9 to 2010/11 (3 years) • Data for England • PCT (152), LA (354) Methods
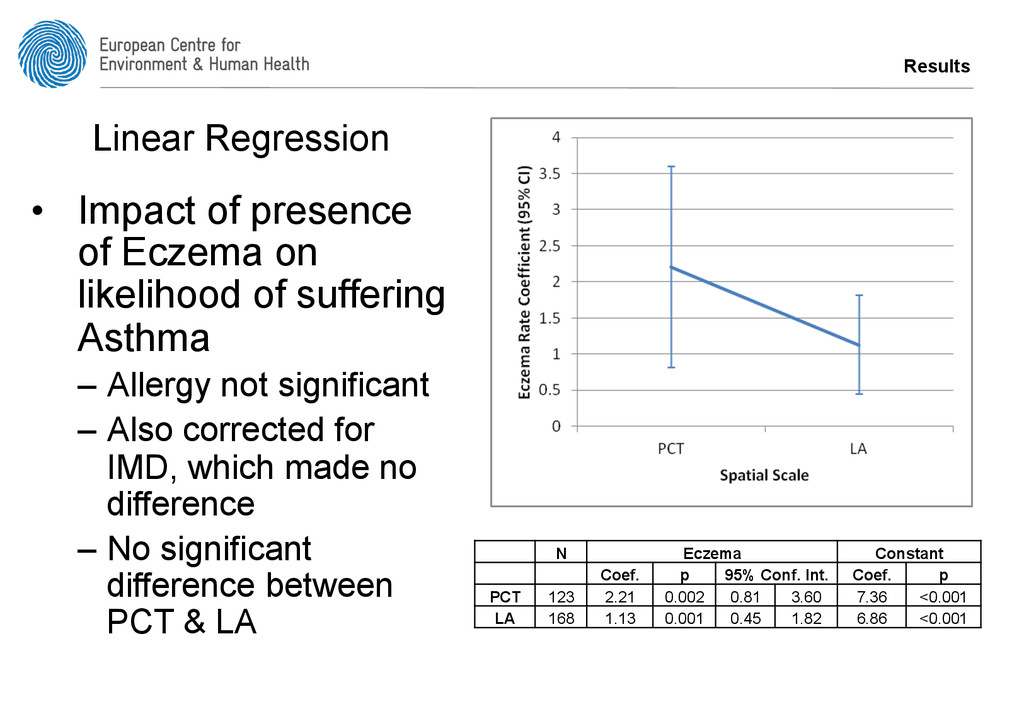
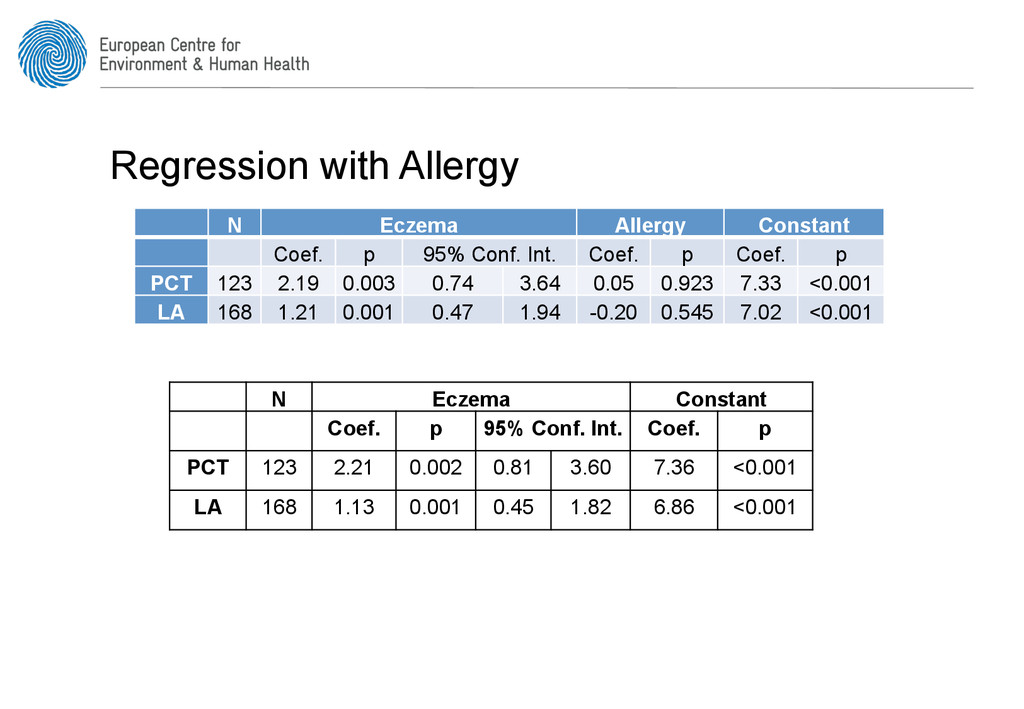
suffering Asthma – Allergy not significant – Also corrected for IMD, which made no difference – No significant difference between PCT & LA N Eczema Constant Coef. p 95% Conf. Int. Coef. p PCT 123 2.21 0.002 0.81 3.60 7.36 <0.001 LA 168 1.13 0.001 0.45 1.82 6.86 <0.001 Linear Regression
same individuals • But these are difficult/expensive to access and don’t exist with sufficiently detailed medical reporting • Assuming individuals don’t move around too much / rates in one place don’t change over time
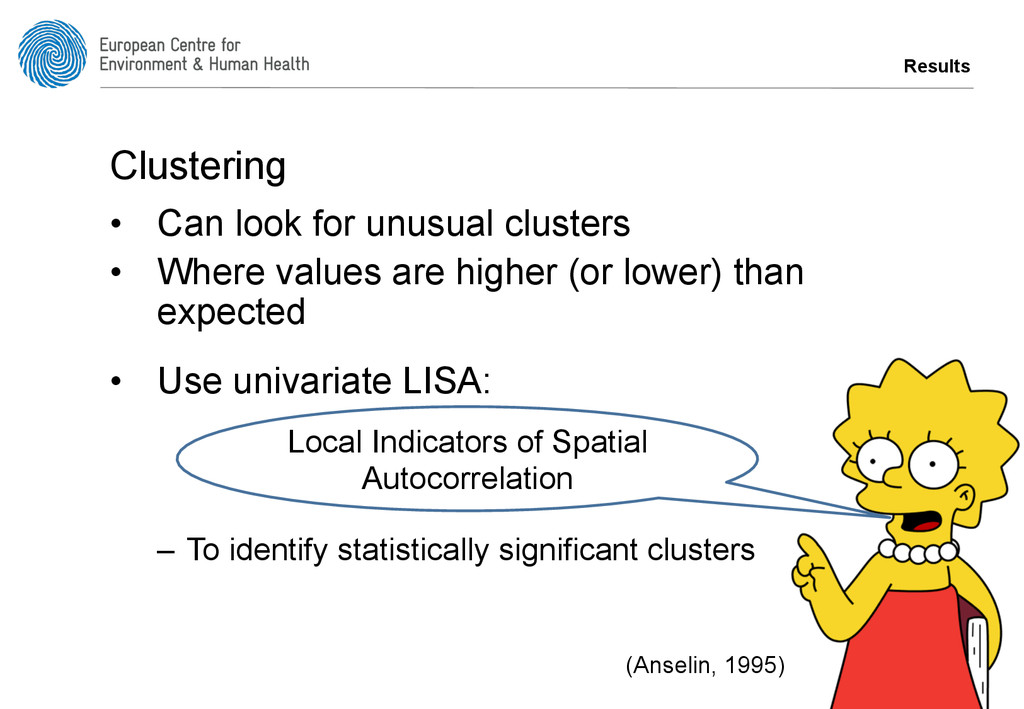
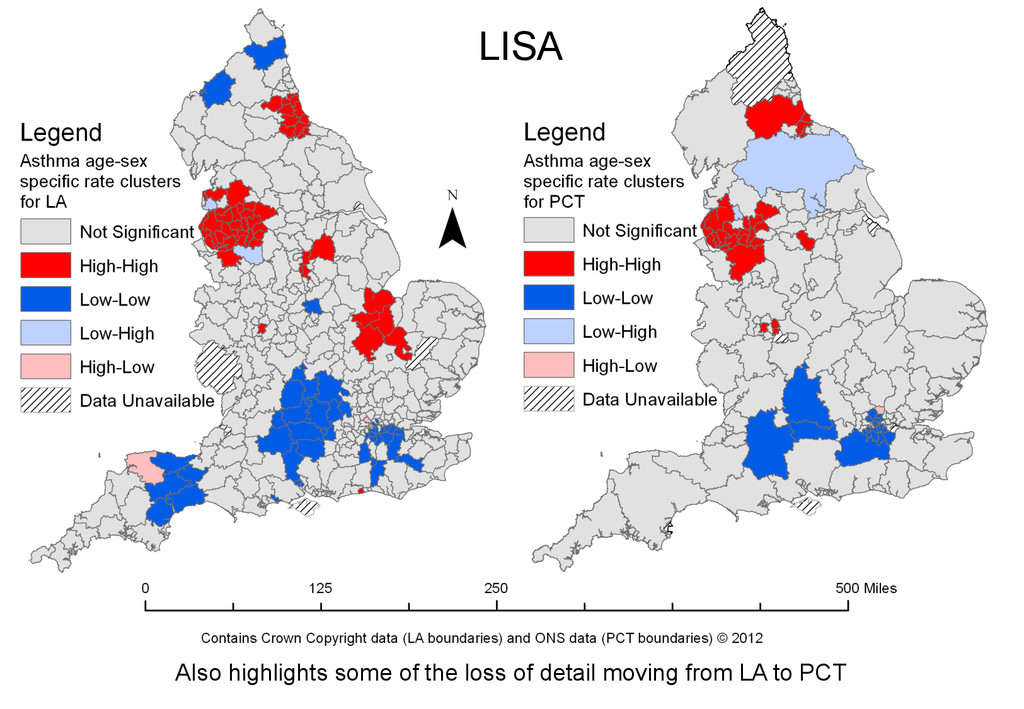
values are higher (or lower) than expected • Use univariate LISA: – To identify statistically significant clusters Local Indicators of Spatial Autocorrelation (Anselin, 1995)
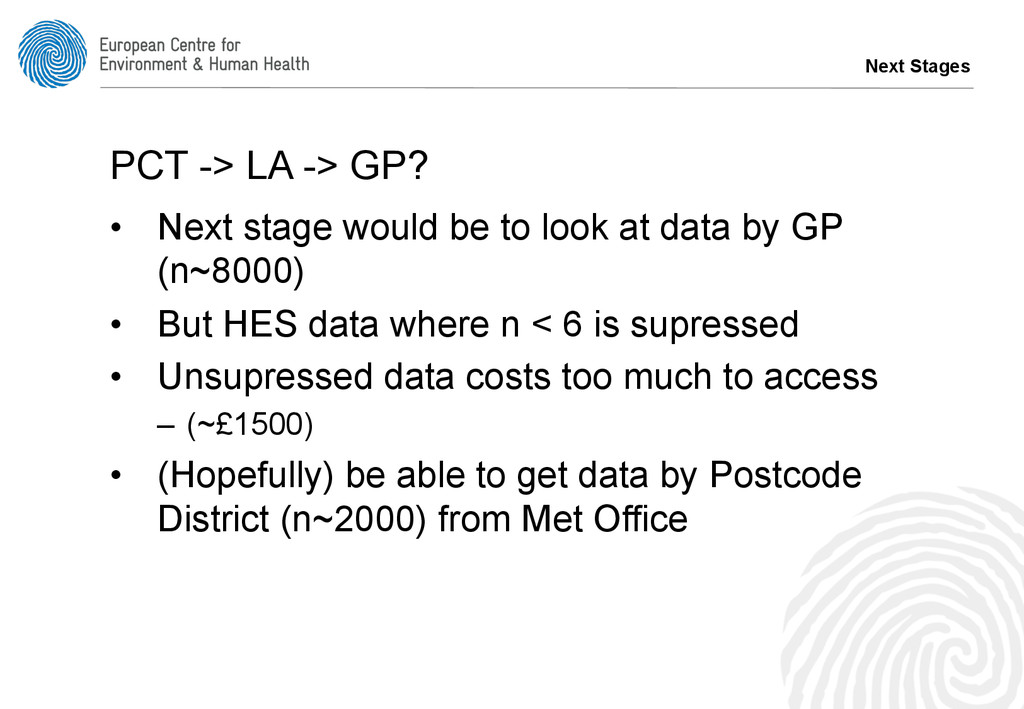
would be to look at data by GP (n~8000) • But HES data where n < 6 is supressed • Unsupressed data costs too much to access – (~£1500) • (Hopefully) be able to get data by Postcode District (n~2000) from Met Office
Atopy, using these data, MAUP is not an issue • Need more data to further explore the issue – Ideally GP, but Postcode District will provide more information • Moving from LA to PCT can result in a loss of data
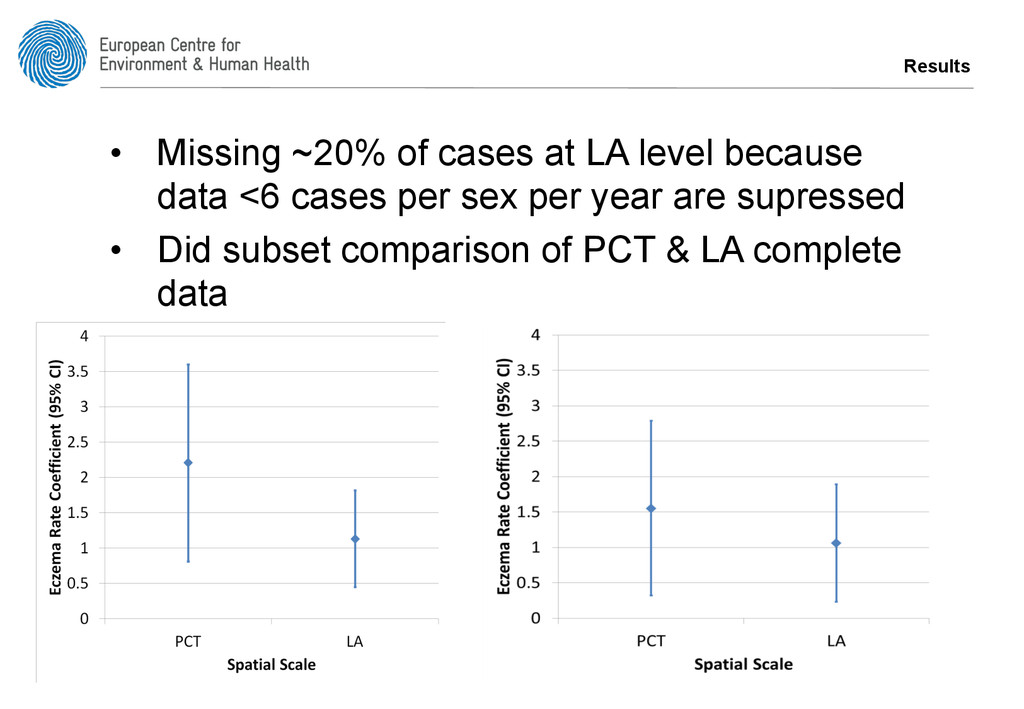
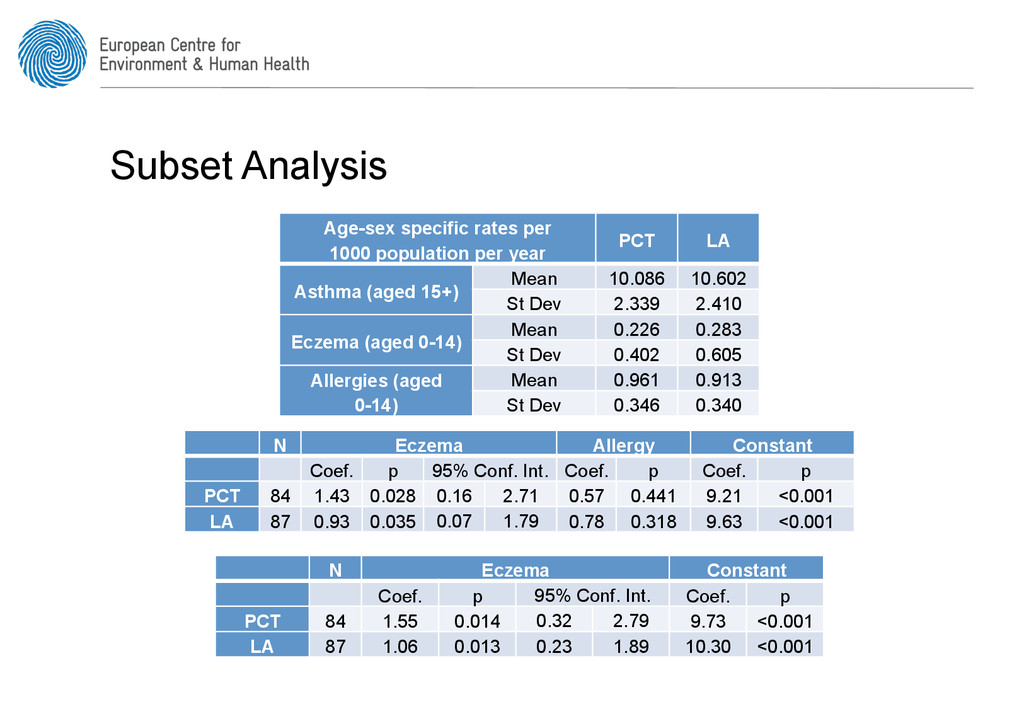
PCT LA Asthma (aged 15+) Mean 10.086 10.602 St Dev 2.339 2.410 Eczema (aged 0-14) Mean 0.226 0.283 St Dev 0.402 0.605 Allergies (aged 0-14) Mean 0.961 0.913 St Dev 0.346 0.340 N Eczema Allergy Constant Coef. p 95% Conf. Int. Coef. p Coef. p PCT 84 1.43 0.028 0.16 2.71 0.57 0.441 9.21 <0.001 LA 87 0.93 0.035 0.07 1.79 0.78 0.318 9.63 <0.001 N Eczema Constant Coef. p 95% Conf. Int. Coef. p PCT 84 1.55 0.014 0.32 2.79 9.73 <0.001 LA 87 1.06 0.013 0.23 1.89 10.30 <0.001
![www.ecehh.org [email protected] Questions?](https://files.speakerdeck.com/presentations/70b59760673b0131239b1ed4354c453c/slide_24.jpg)