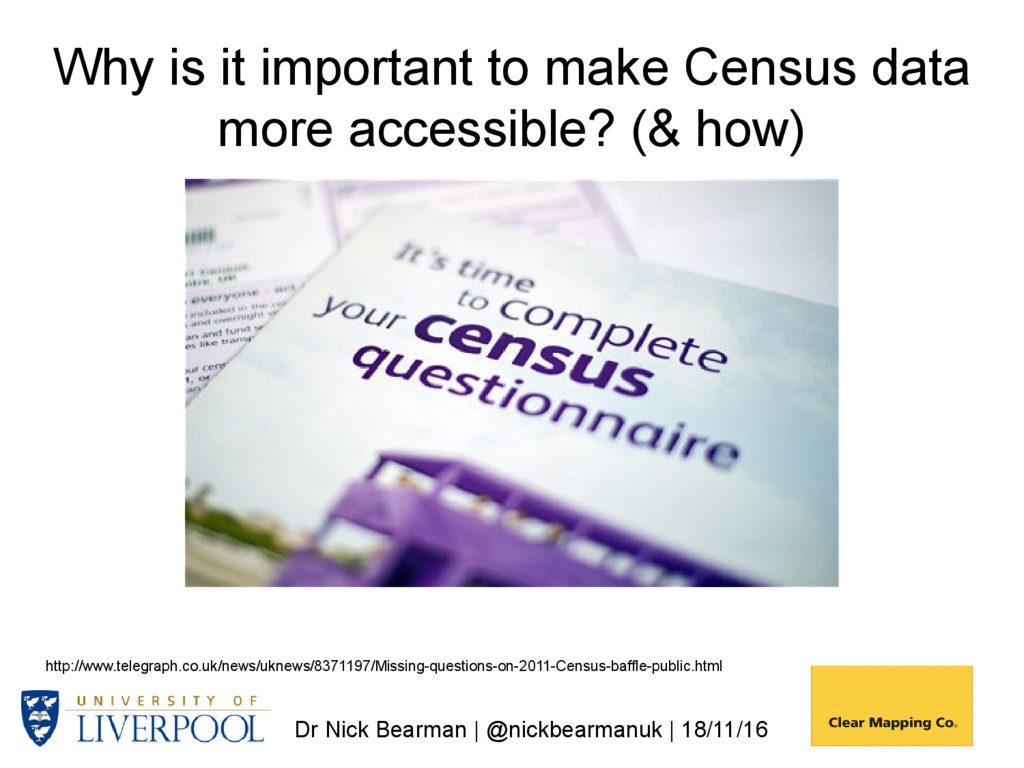
important to make Census data more accessible? (& how) http://www.telegraph.co.uk/news/uknews/8371197/Missing-questions-on-2011-Census-baffle-public.html
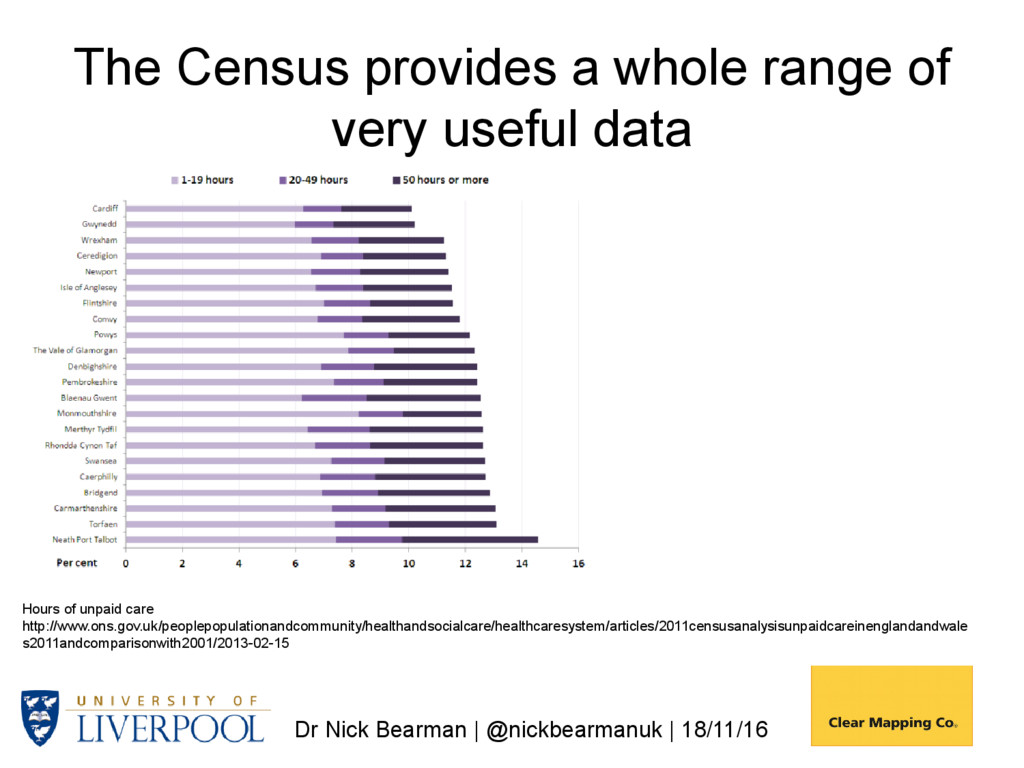
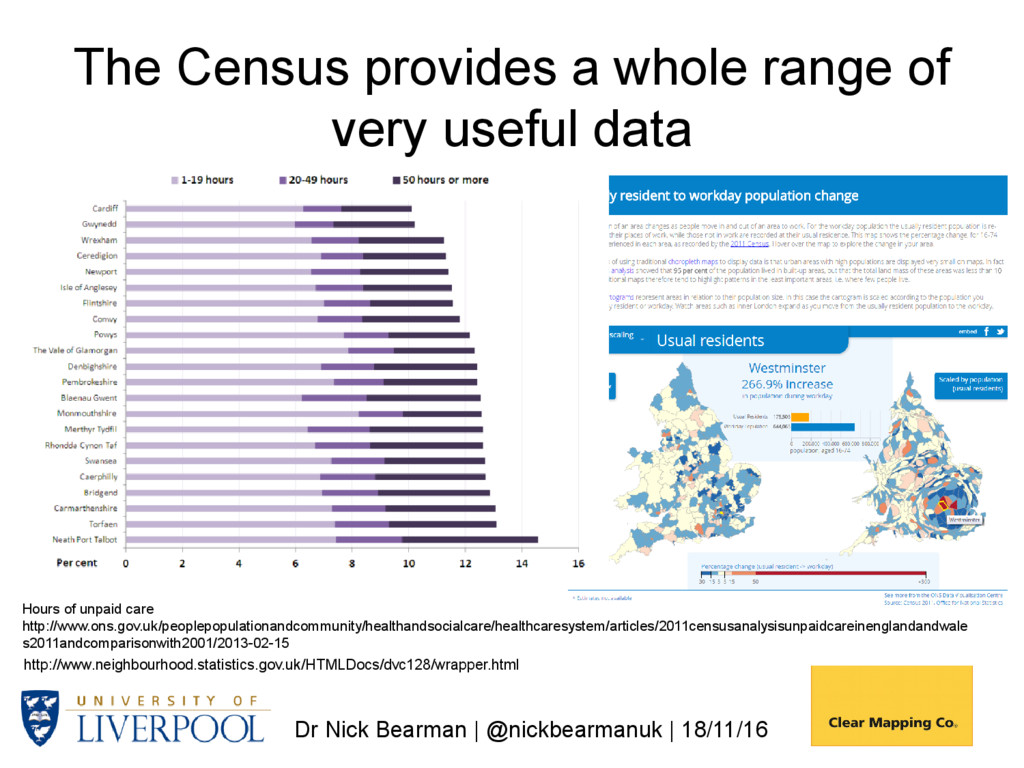
a whole range of very useful data Hours of unpaid care http://www.ons.gov.uk/peoplepopulationandcommunity/healthandsocialcare/healthcaresystem/articles/2011censusanalysisunpaidcareinenglandandwale s2011andcomparisonwith2001/2013-02-15
provides a whole range of very useful data Hours of unpaid care http://www.ons.gov.uk/peoplepopulationandcommunity/healthandsocialcare/healthcaresystem/articles/2011censusanalysisunpaidcareinenglandandwale s2011andcomparisonwith2001/2013-02-15
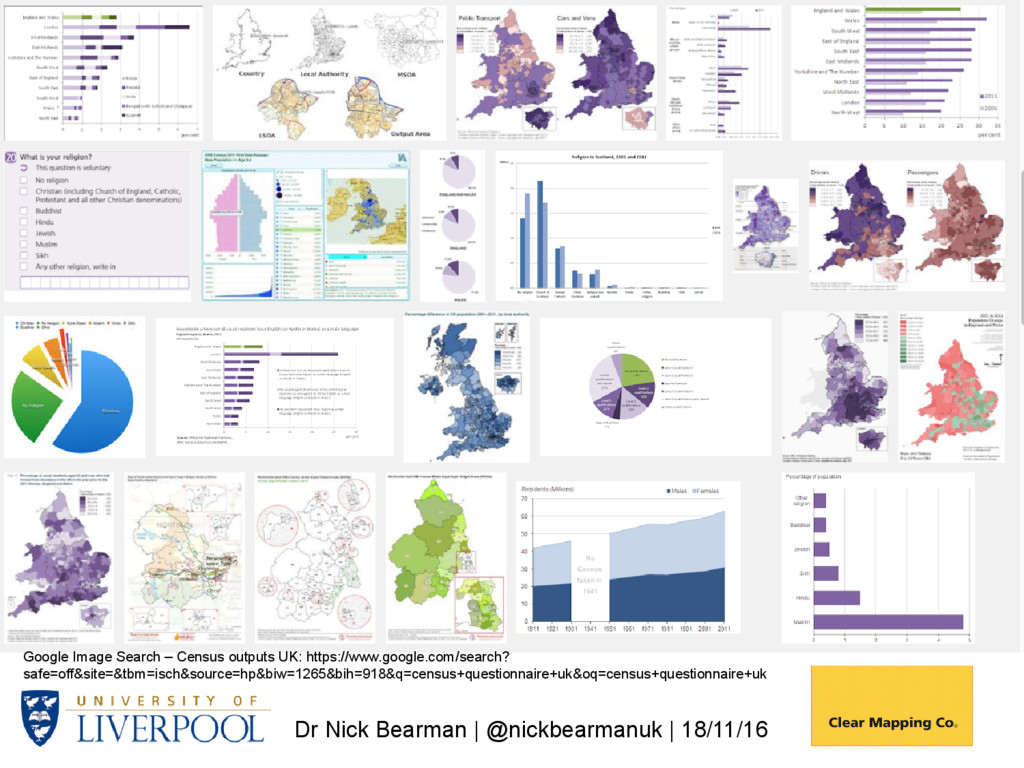
a whole range of very useful data Google Image Search – Census outputs UK: https://www.google.com/search? safe=off&site=&tbm=isch&source=hp&biw=1265&bih=918&q=census+questionnaire+uk&oq=census+questionnaire+uk
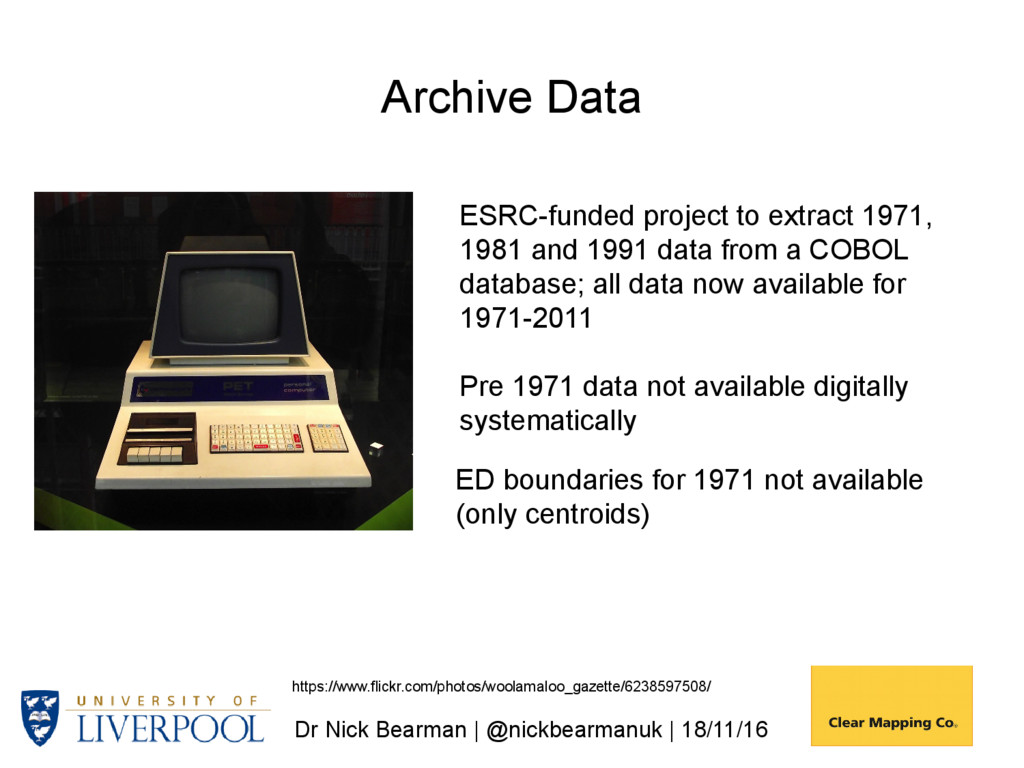
boundaries for 1971 not available (only centroids) ESRC-funded project to extract 1971, 1981 and 1991 data from a COBOL database; all data now available for 1971-2011 Pre 1971 data not available digitally systematically https://www.flickr.com/photos/woolamaloo_gazette/6238597508/
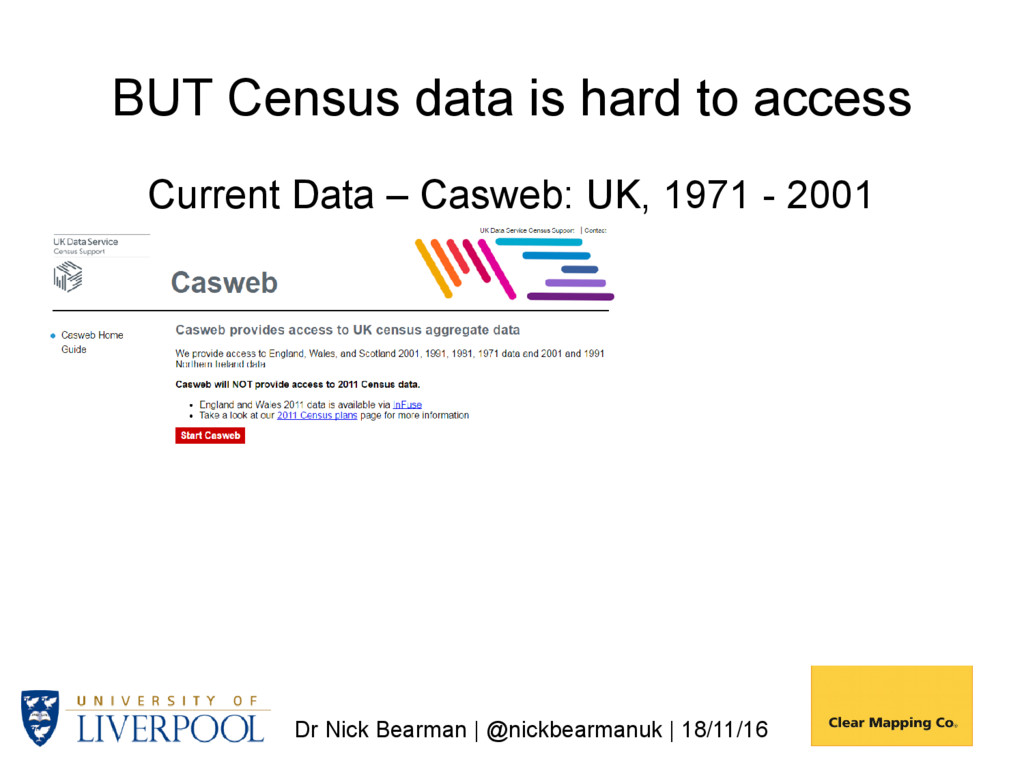
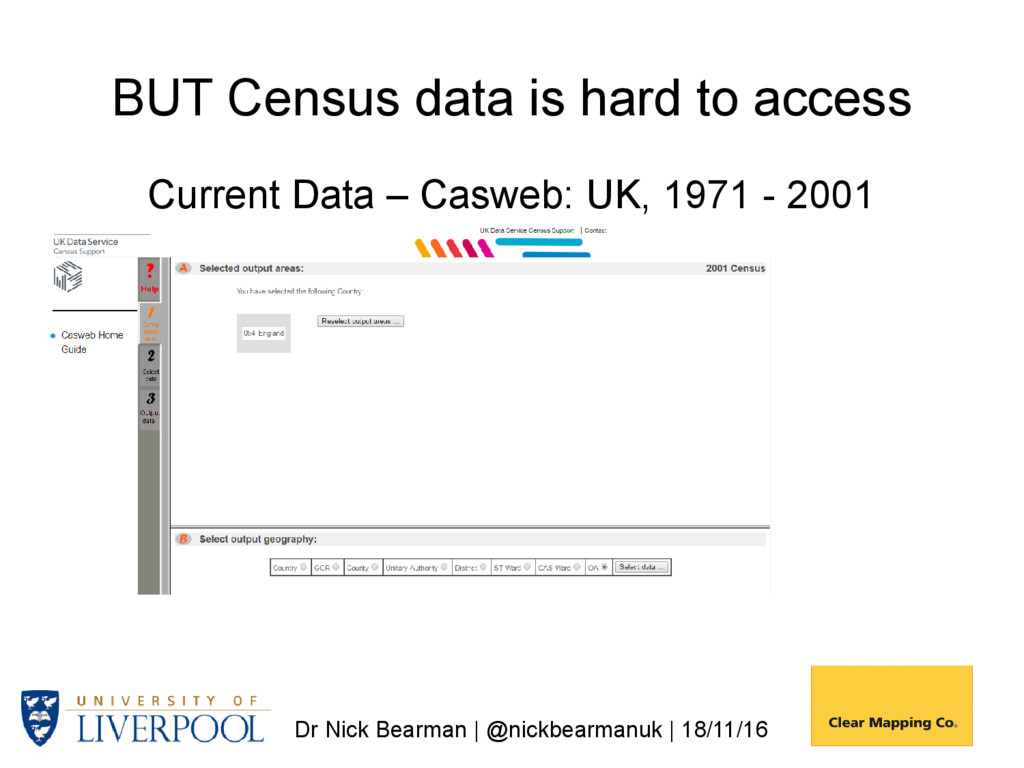
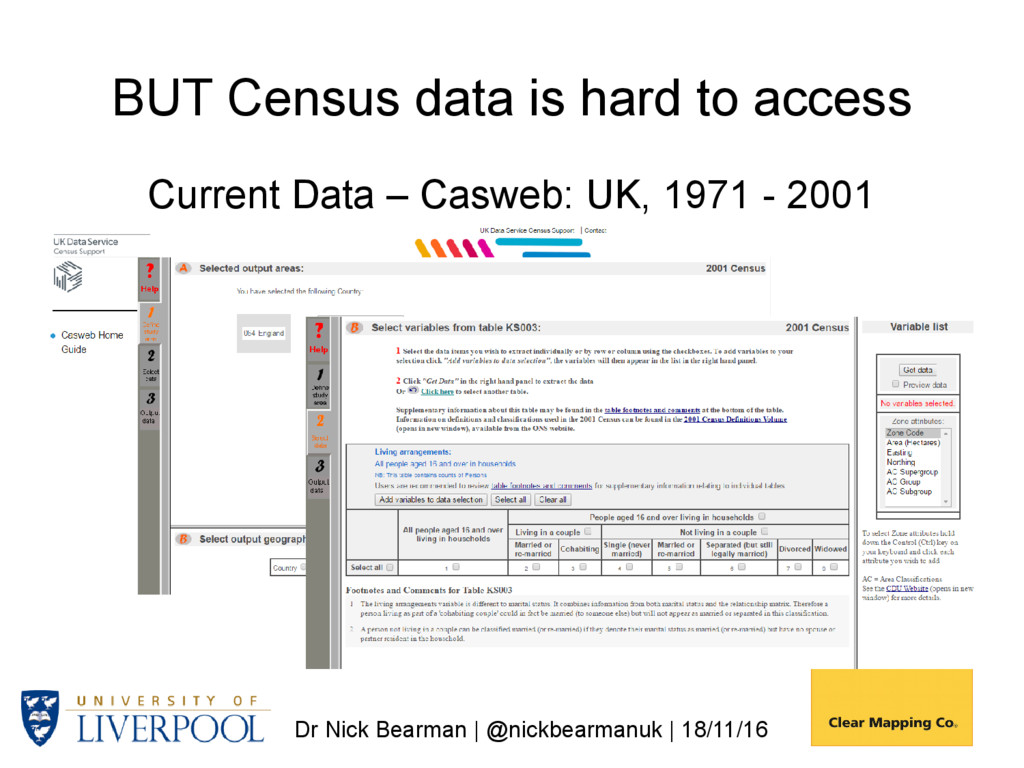
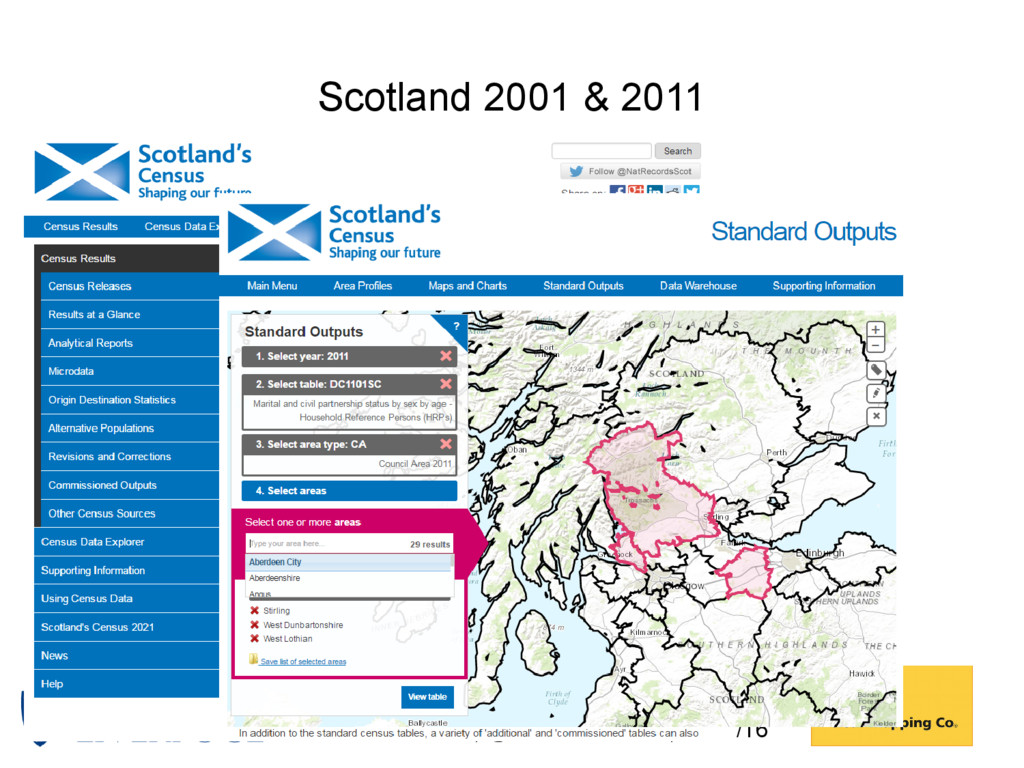
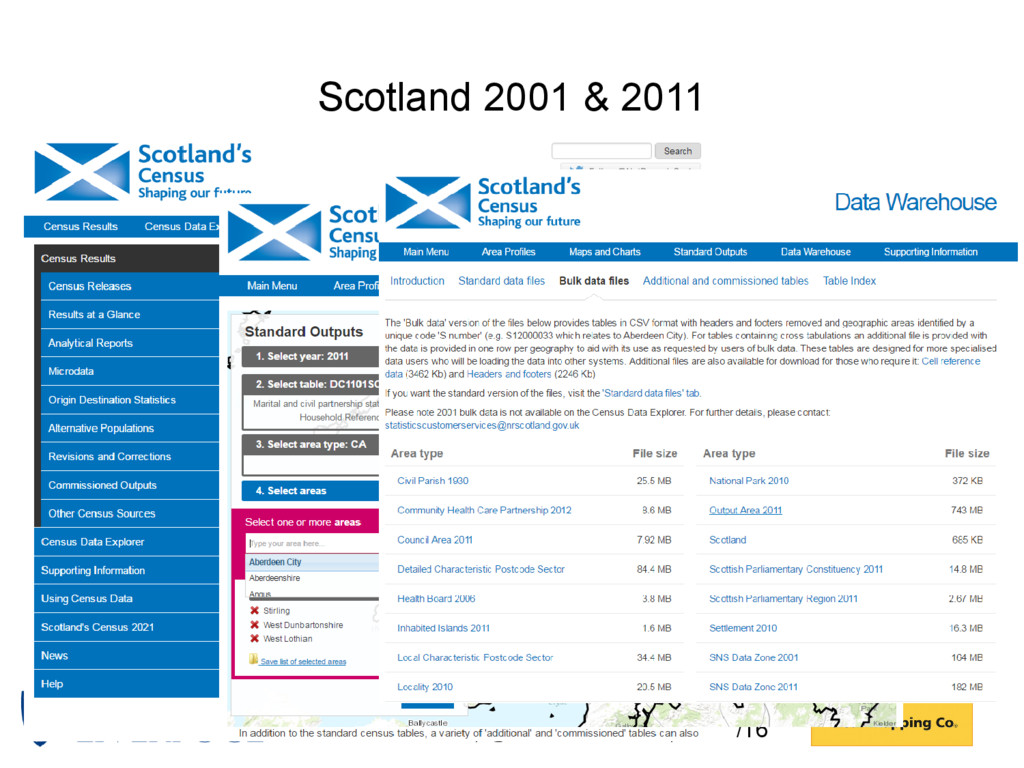
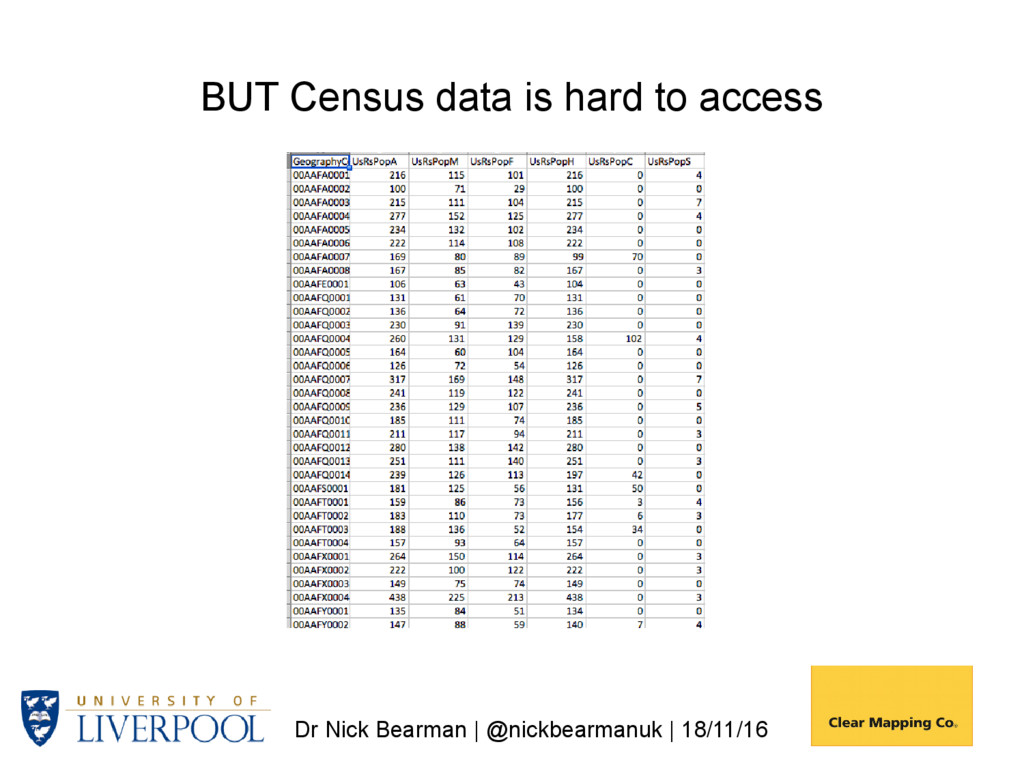
make Census data easier to access Particularly to look at how areas change over time If the data is easier to access, more people will use it What’s the problem?
made available in Output Areas ~ 100 households Comparing these small areas over time is difficult, as they change We wanted to make Census data easier to access
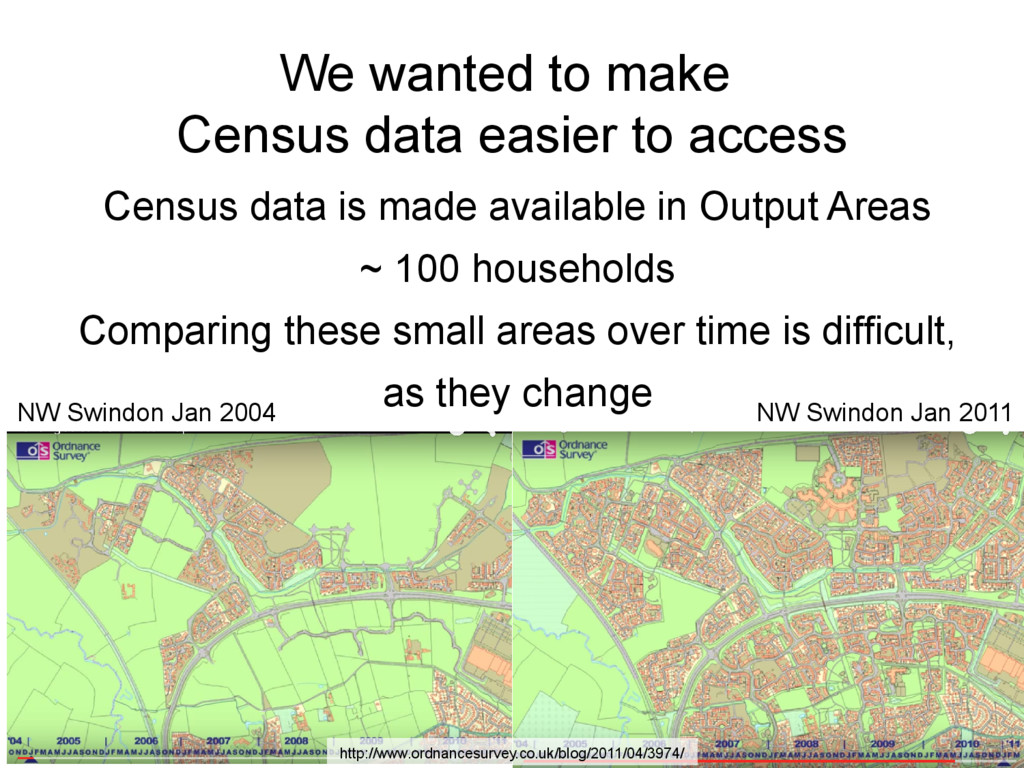
made available in Output Areas ~ 100 households Comparing these small areas over time is difficult, as they change We wanted to make Census data easier to access NW Swindon Jan 2004 NW Swindon Jan 2011 http://www.ordnancesurvey.co.uk/blog/2011/04/3974/
can be tricky to do Particularly if you want to go from 1971/81/91 (enumeration districts) to 2001/11 (output areas) Blue = 1991 Enumeration districts; Red = 2011 Output Areas
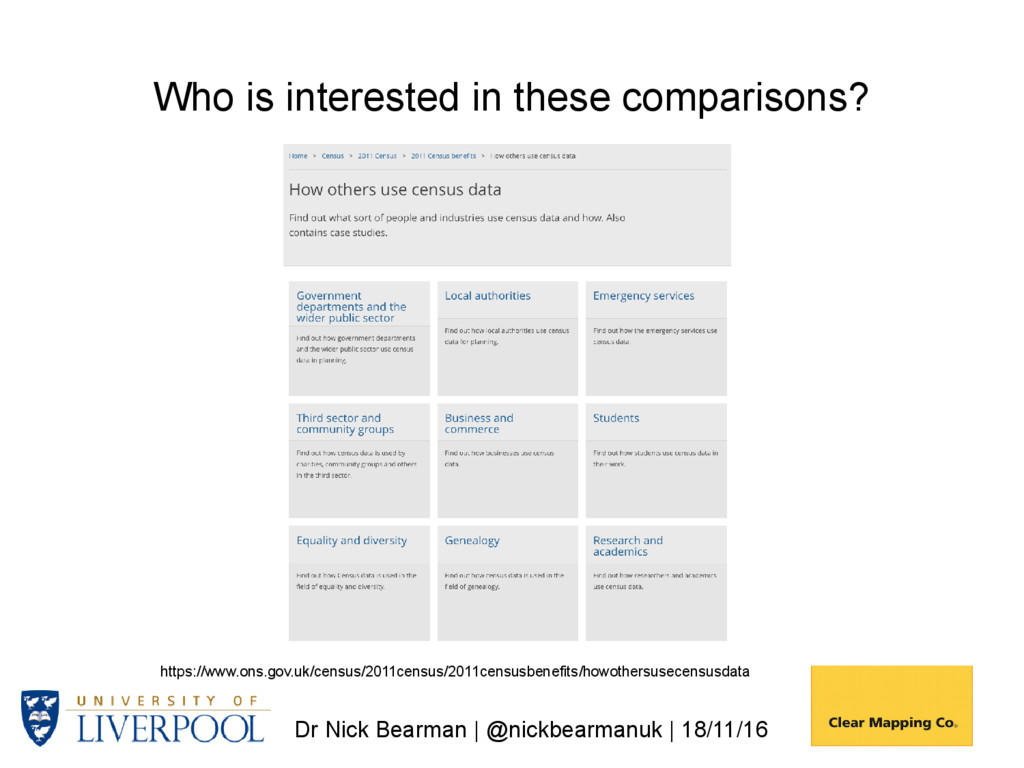
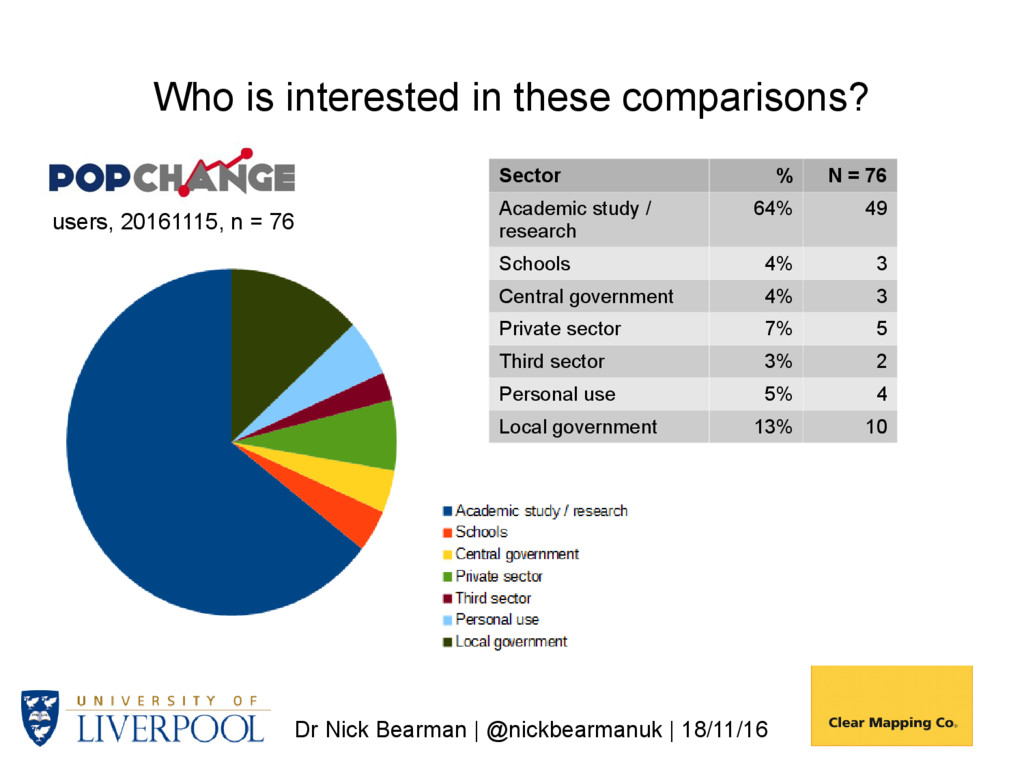
in these comparisons? Sector % N = 76 Academic study / research 64% 49 Schools 4% 3 Central government 4% 3 Private sector 7% 5 Third sector 3% 2 Personal use 5% 4 Local government 13% 10 users, 20161115, n = 76
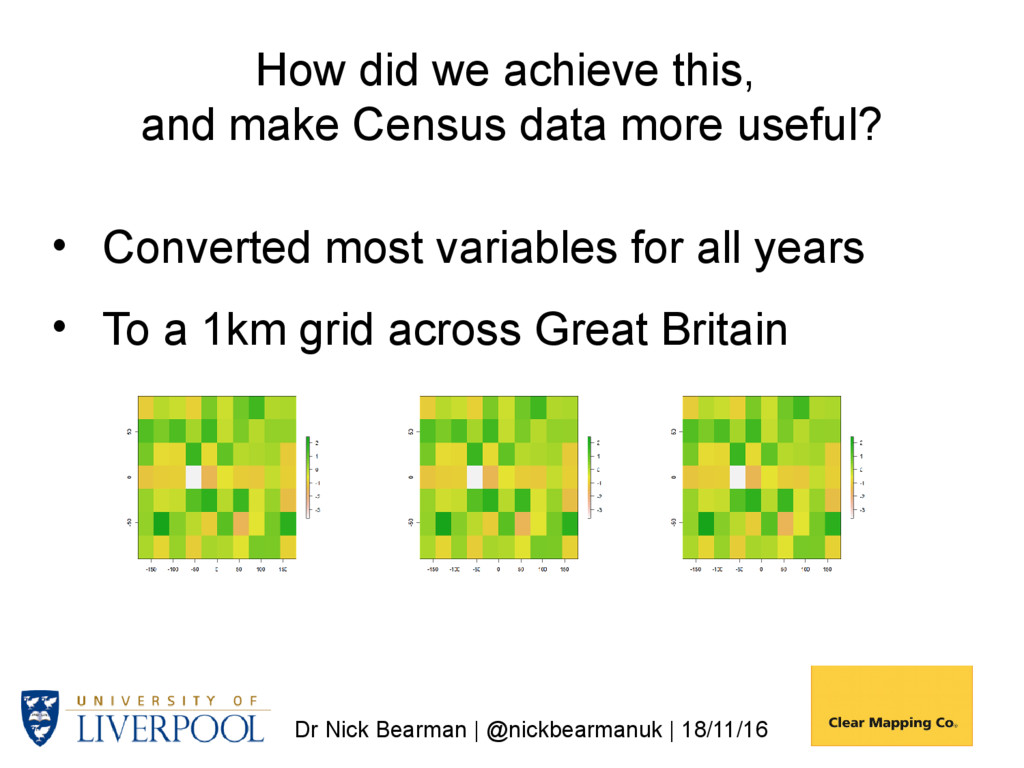
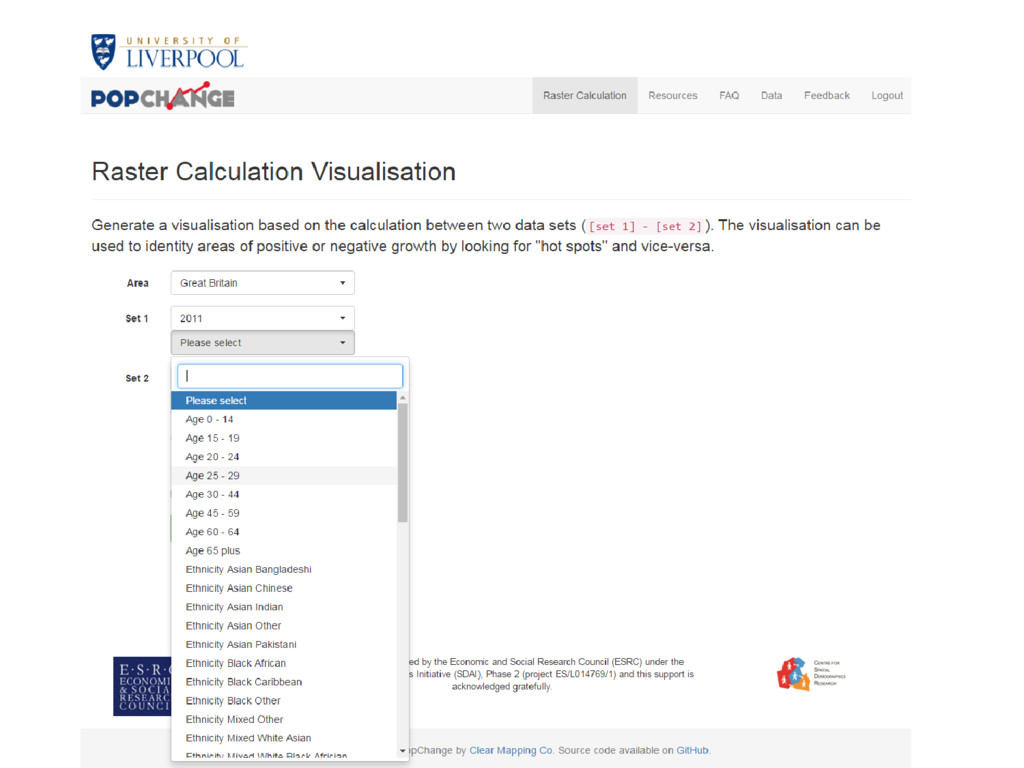
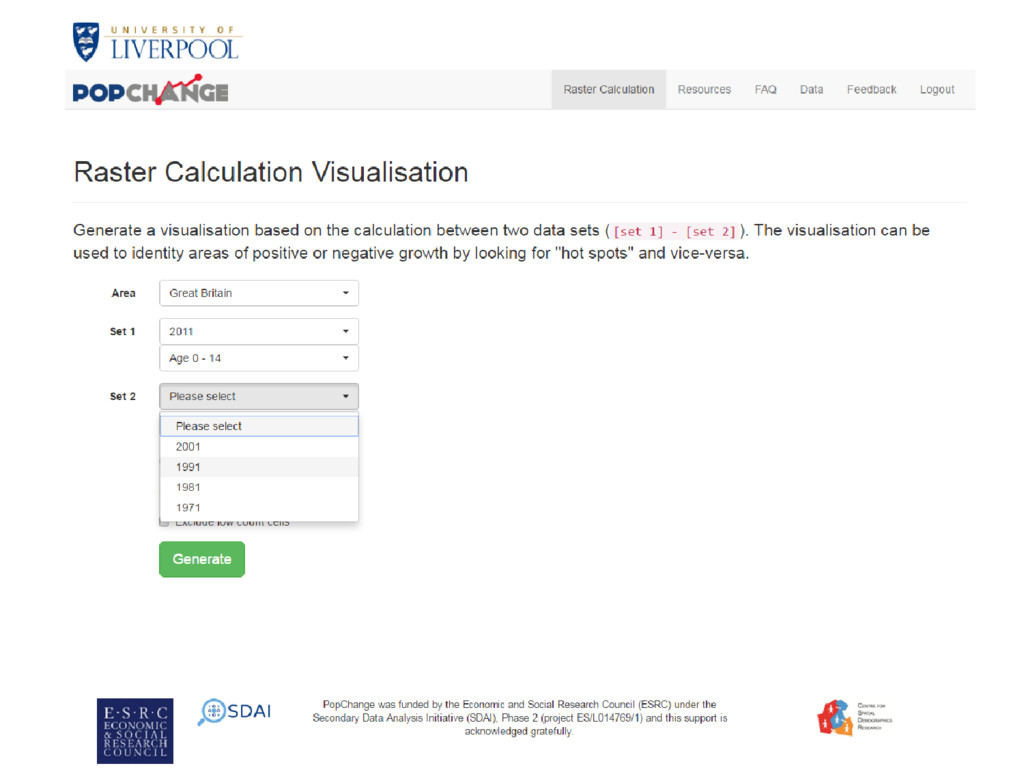
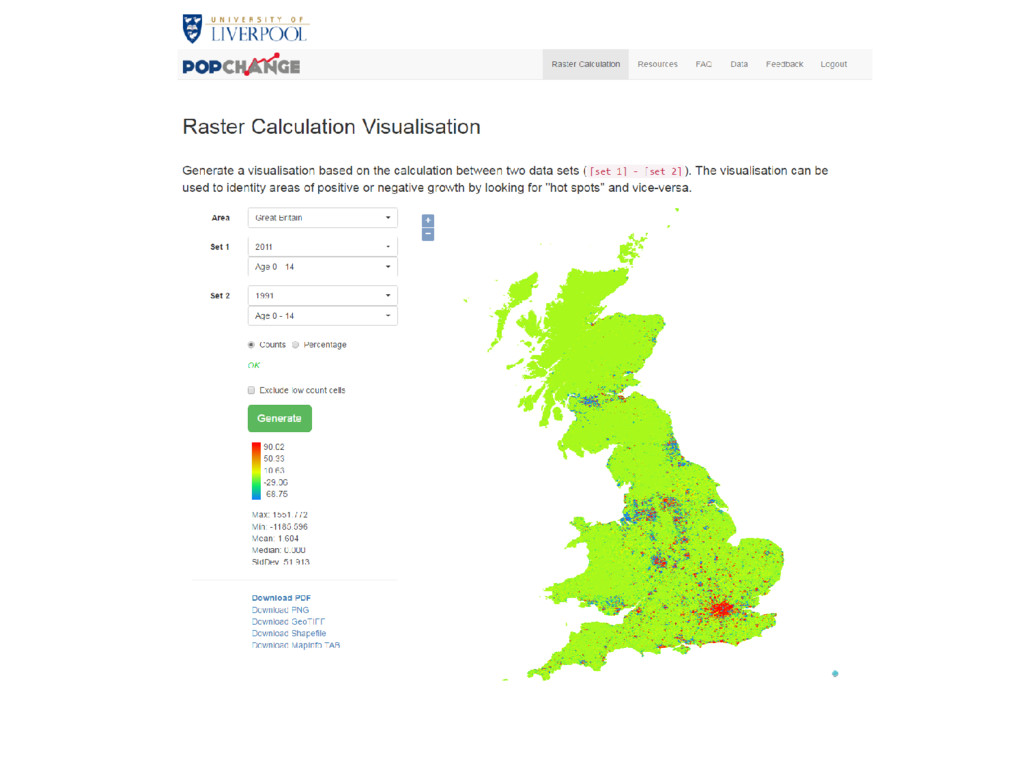
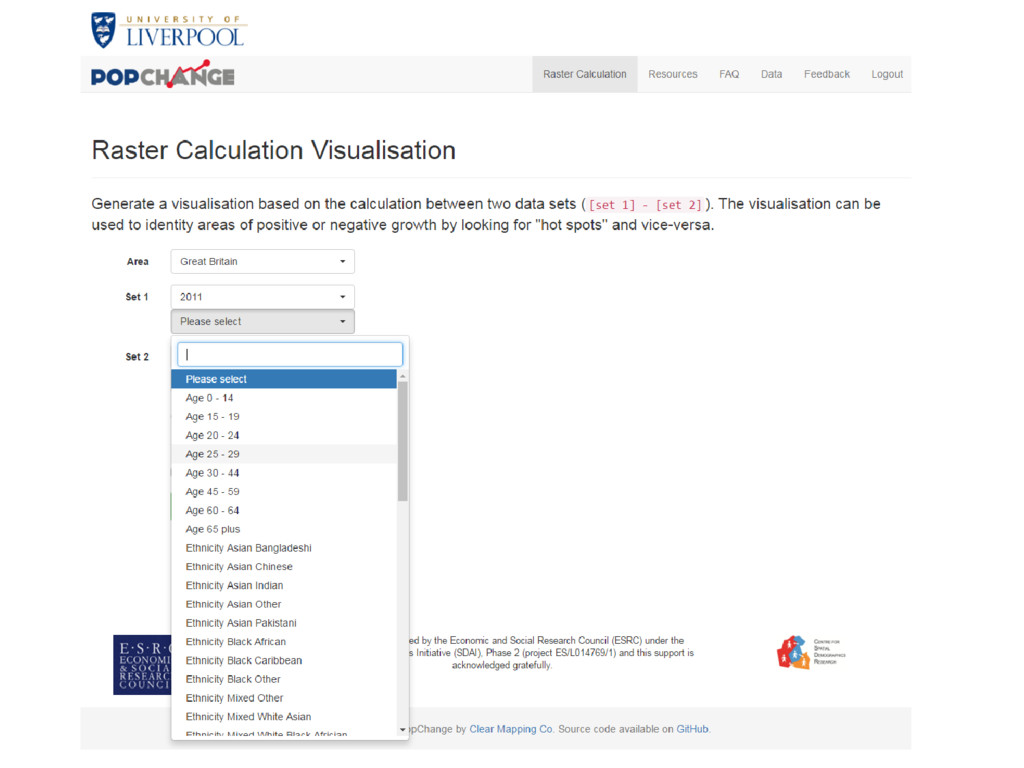
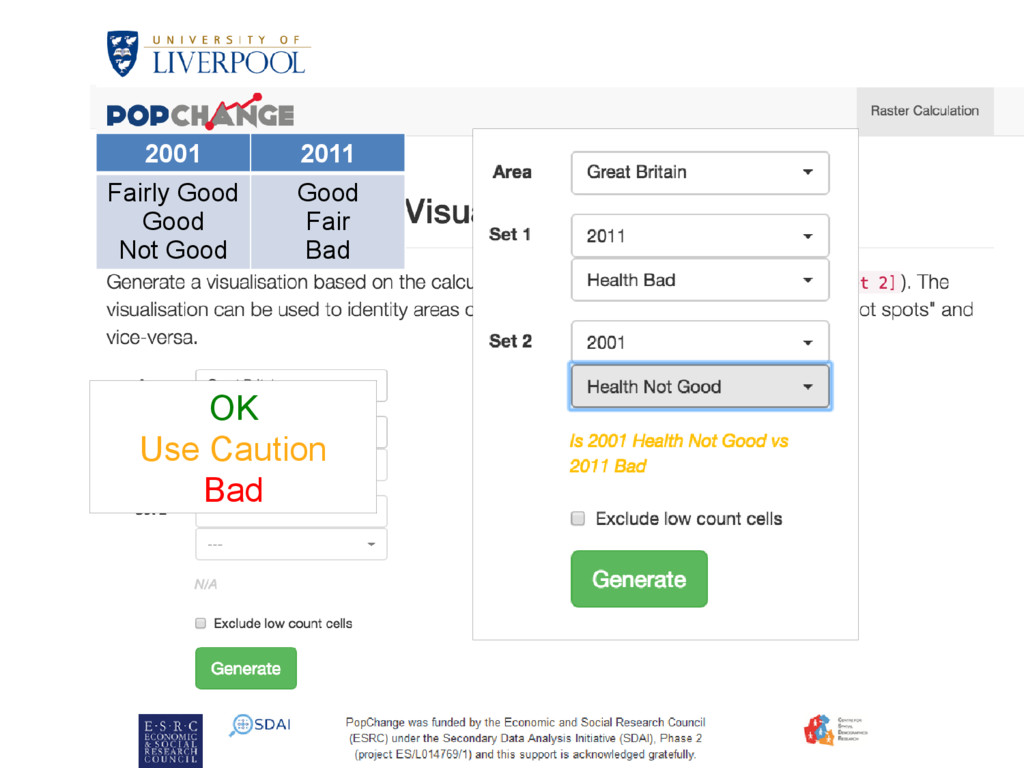
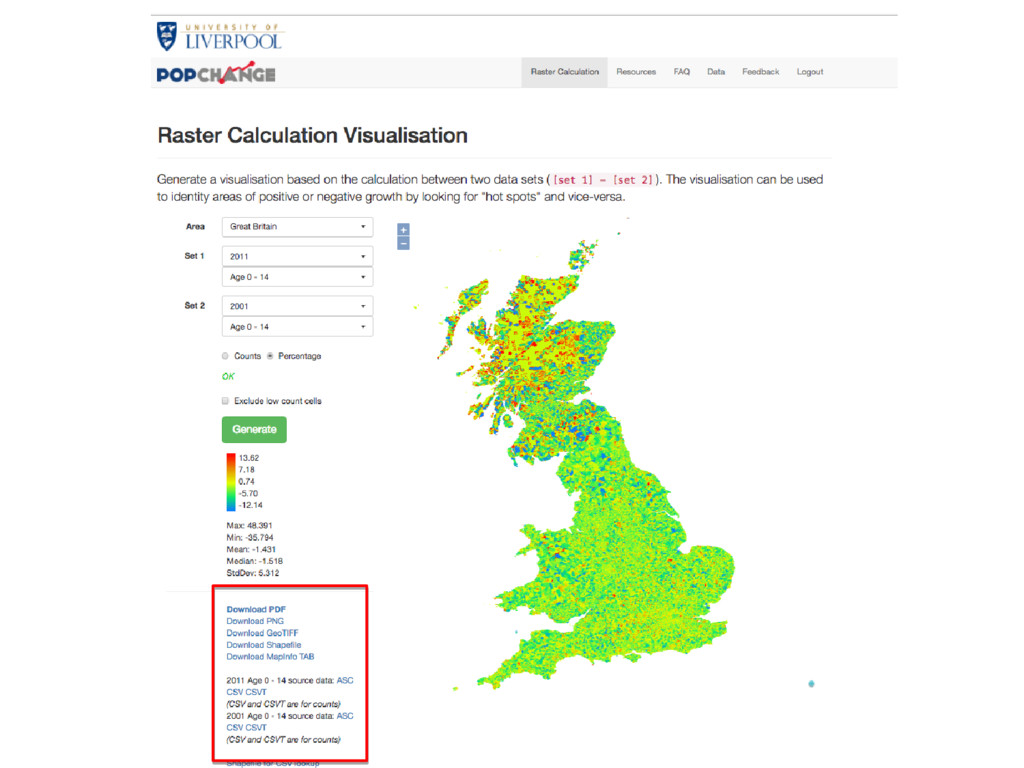
achieve this, and make Census data more useful? We also: • Created an online resource to do comparisons • Limited the comparisons & variables • Simple interface and output • But option to get data if you wish
achieve this, and make Census data more useful? With Census data that is easier to use, we hope: • More people can make use of the data • More people can look at change over time for small areas • We can highlight how useful GIS can be • We can how how important ease of use data is
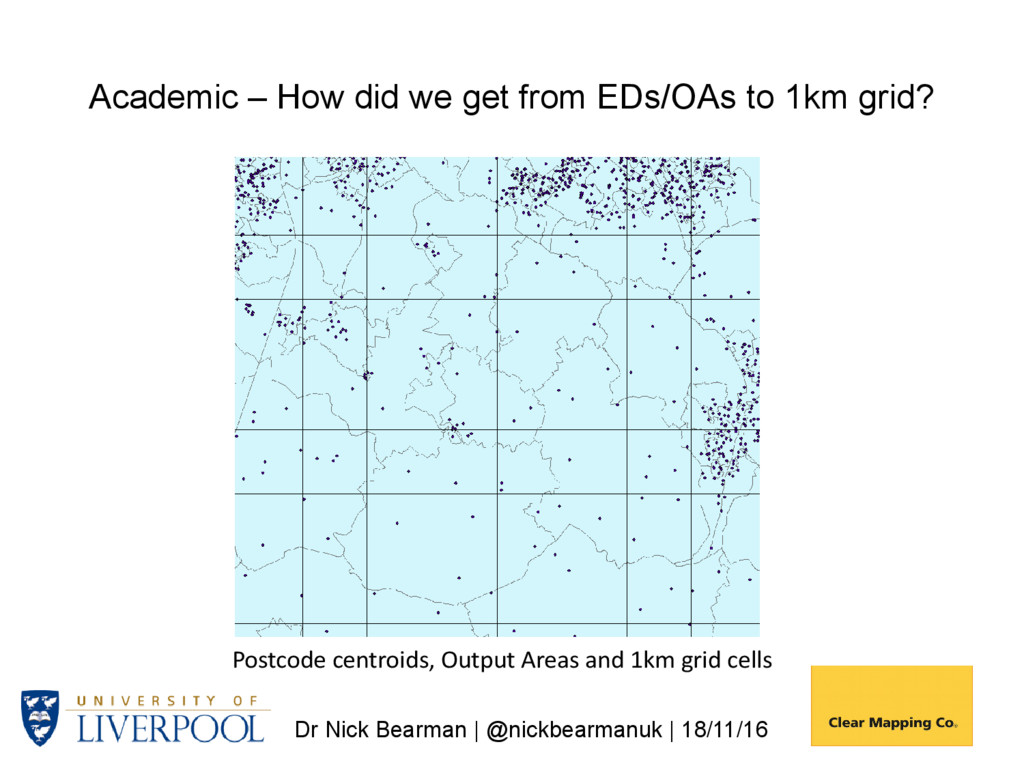
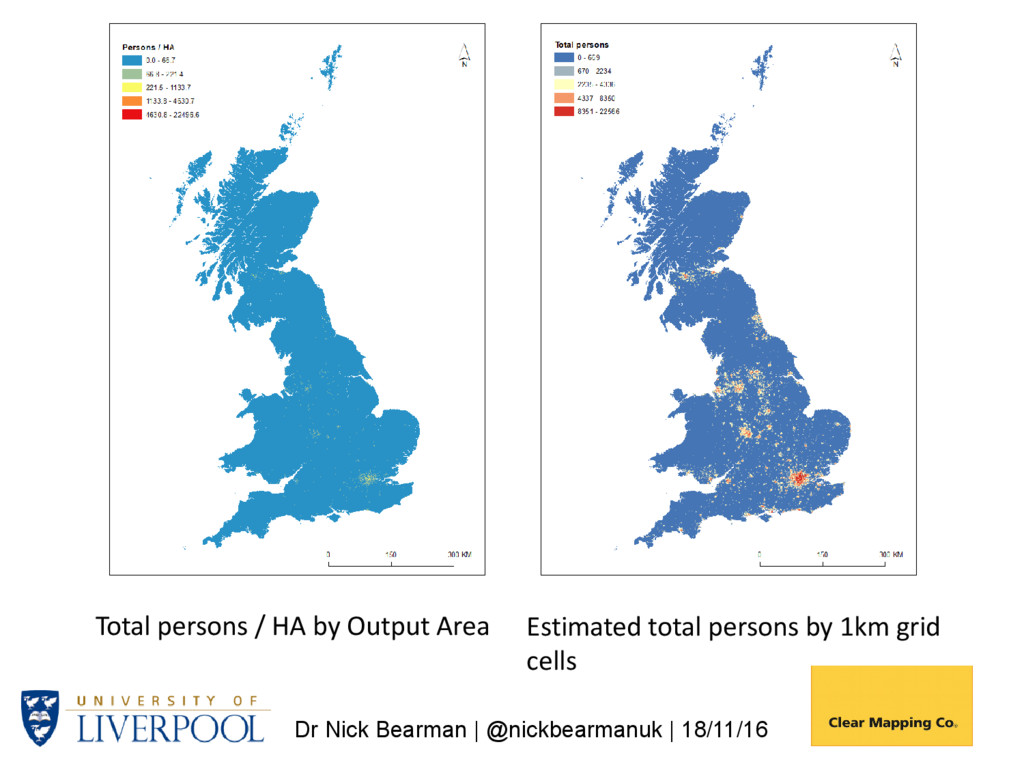
Postcode Density 1. Generate a postcode intensity grid using kernel estimation – 1km cells 2. Overlay 1 with source zones (e.g., Output Areas (OAs) giving OAG) 3. Compute populations (OAG_Estimate) for each OAG zone with: • WtArea = Wt OAG_Area; • WtAreaSum = WtArea summed by OA; • OAG_Estimate = WtArea / WtAreaSum OAPop 4. Aggregate OAG_Estimate values by grid cell Population is then allocated to 1km grids, based on postcode densities (i.e. more postcodes -> more people)
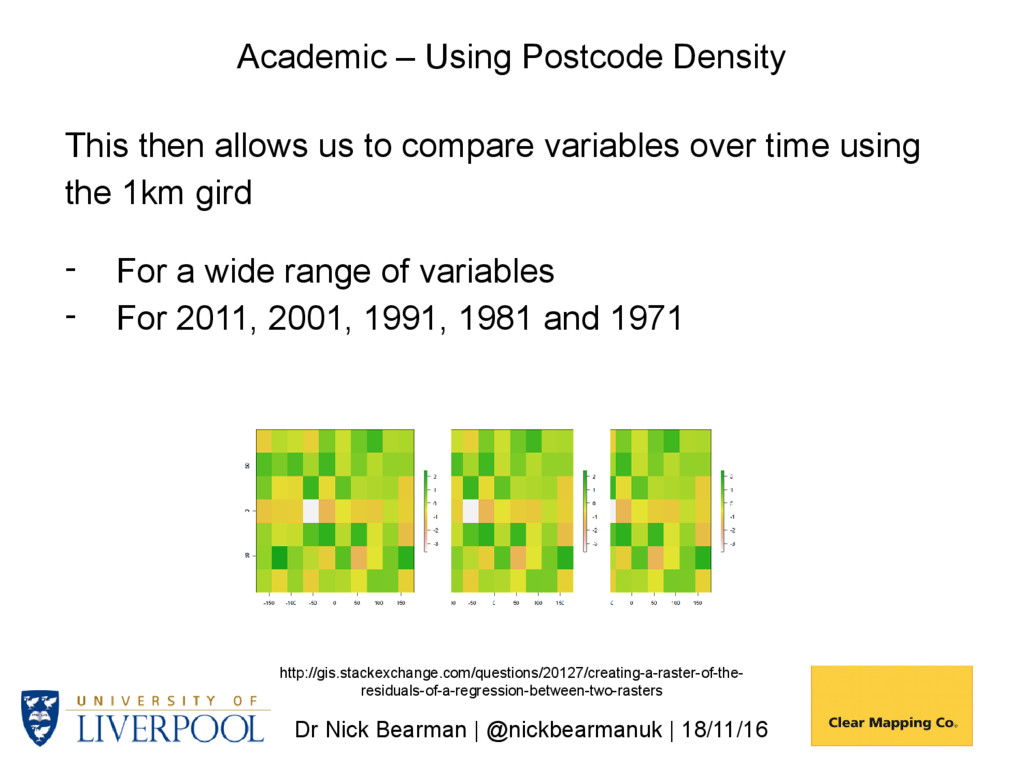
us to compare variables over time using the 1km gird - For a wide range of variables - For 2011, 2001, 1991, 1981 and 1971 http://gis.stackexchange.com/questions/20127/creating-a-raster-of-the- residuals-of-a-regression-between-two-rasters Academic – Using Postcode Density
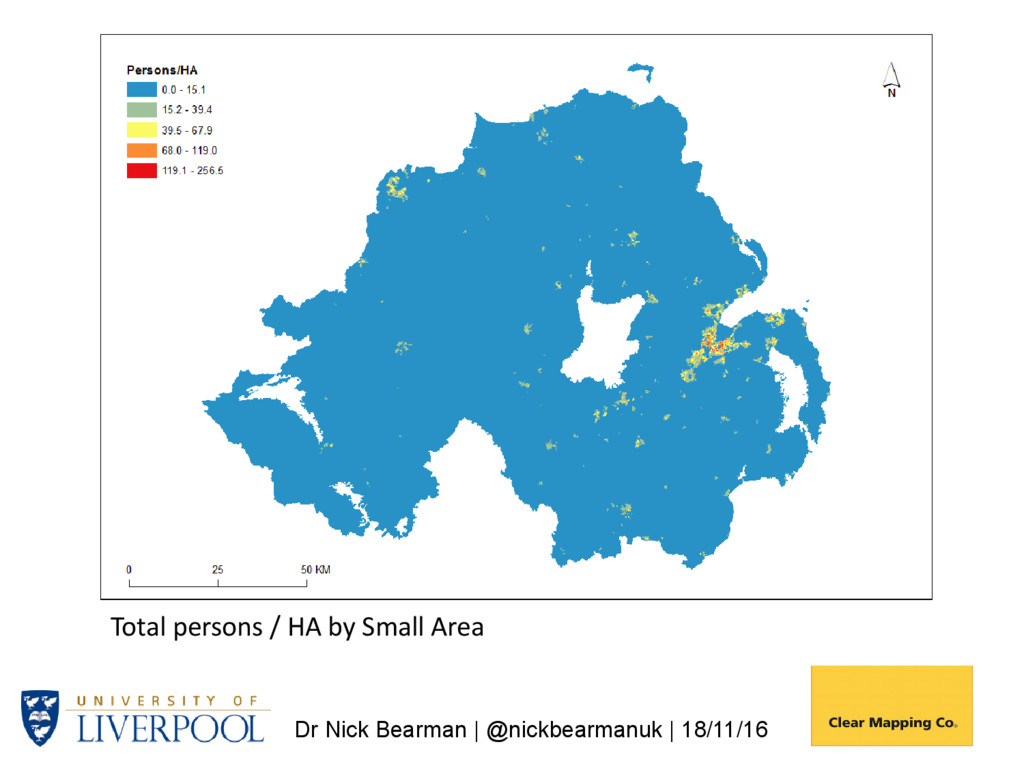
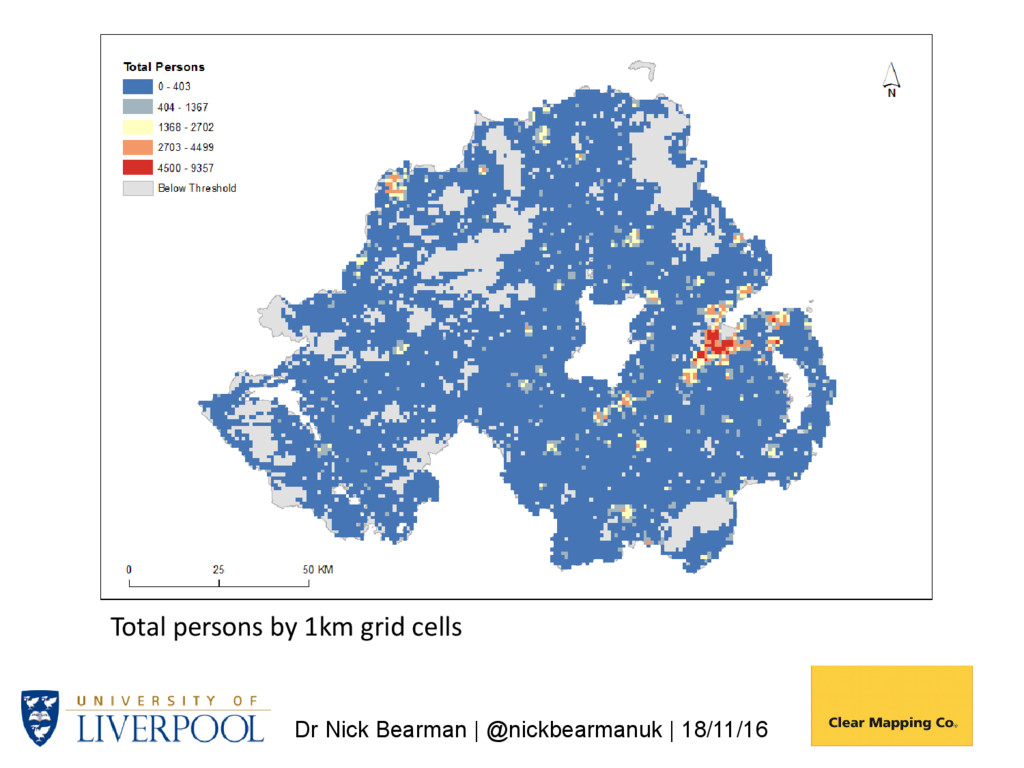
it work? • There was a gridded output for 1971 based on counts, but this is now missing • 1981 onwards there is no gridded output for GB, which is why we need this recourse • There is a gridded resource for Northern Ireland for 1971 – 2011, so we can compare
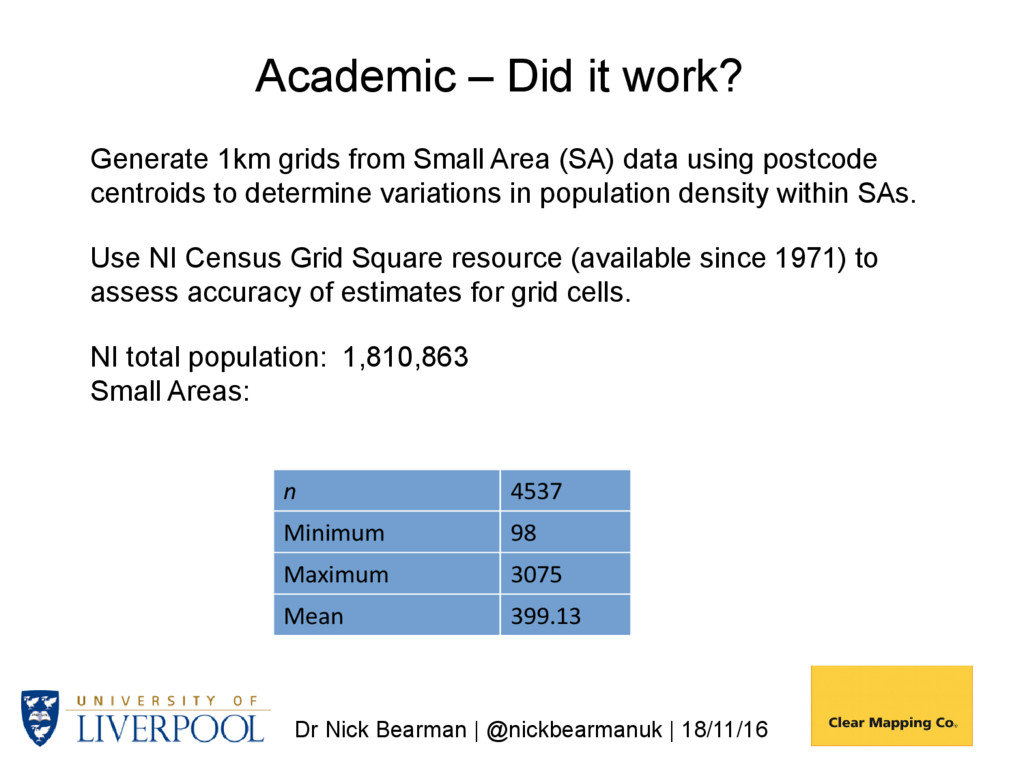
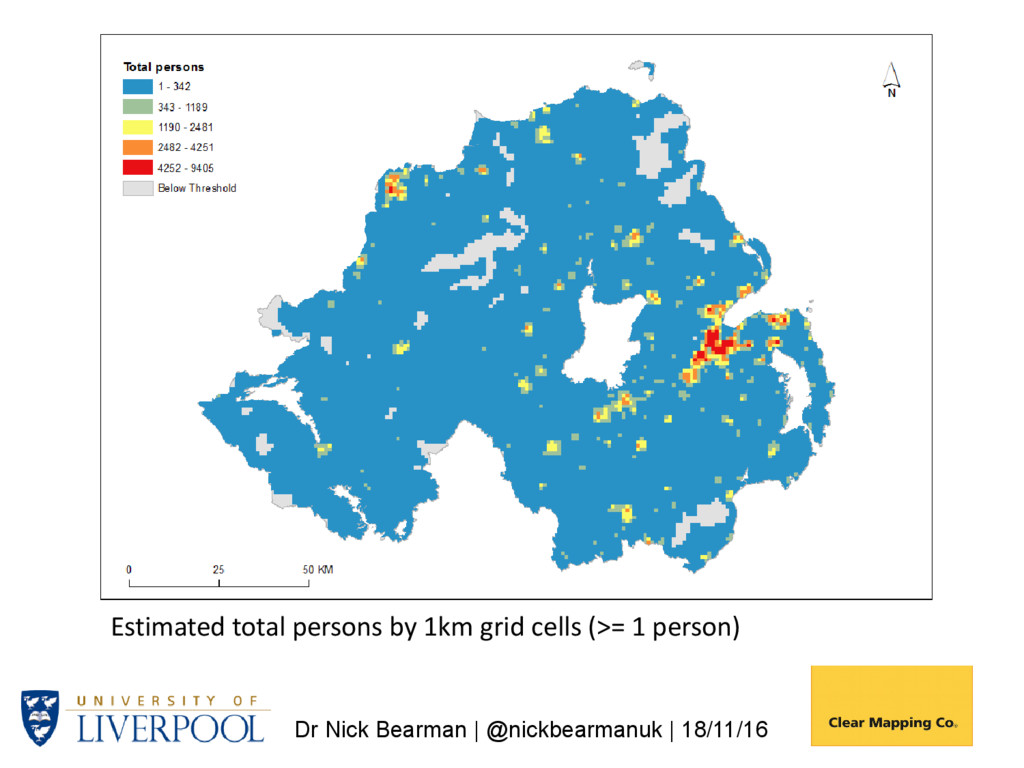
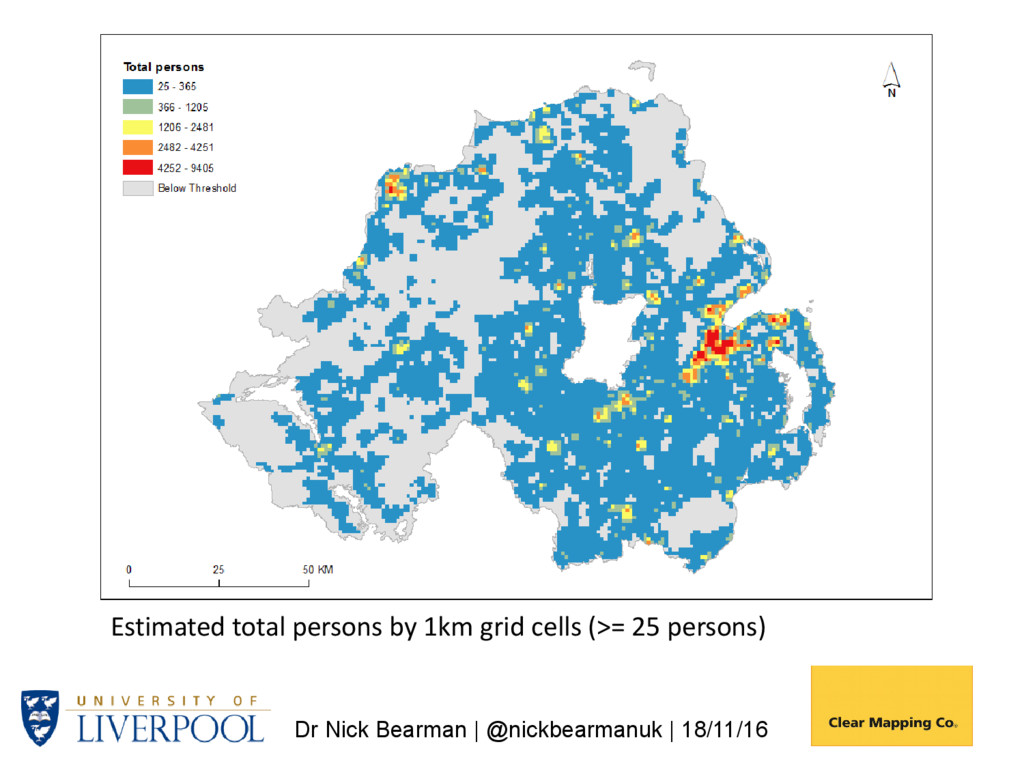
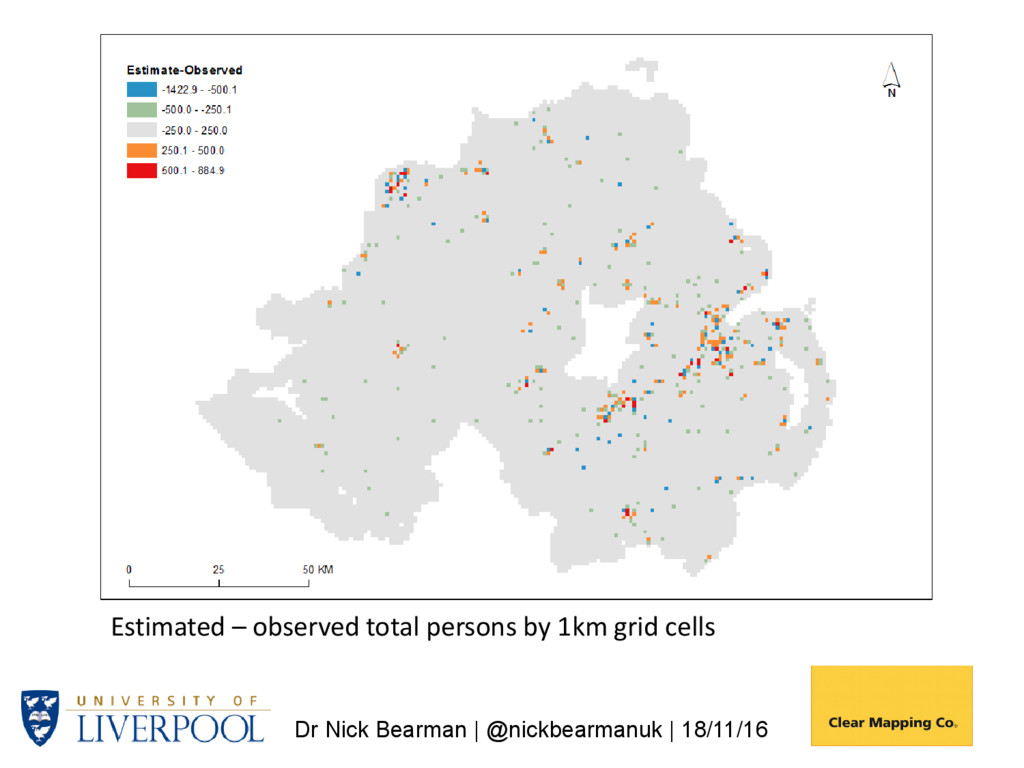
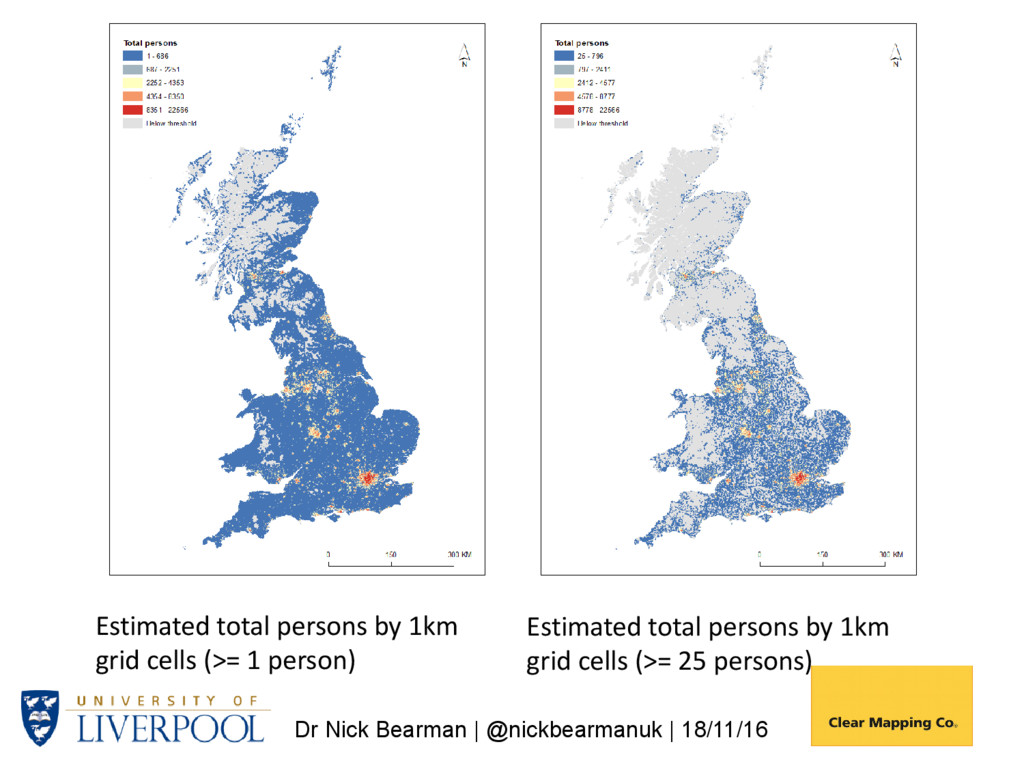
it work? Generate 1km grids from Small Area (SA) data using postcode centroids to determine variations in population density within SAs. Use NI Census Grid Square resource (available since 1971) to assess accuracy of estimates for grid cells. NI total population: 1,810,863 Small Areas: n 4537 Minimum 98 Maximum 3075 Mean 399.13
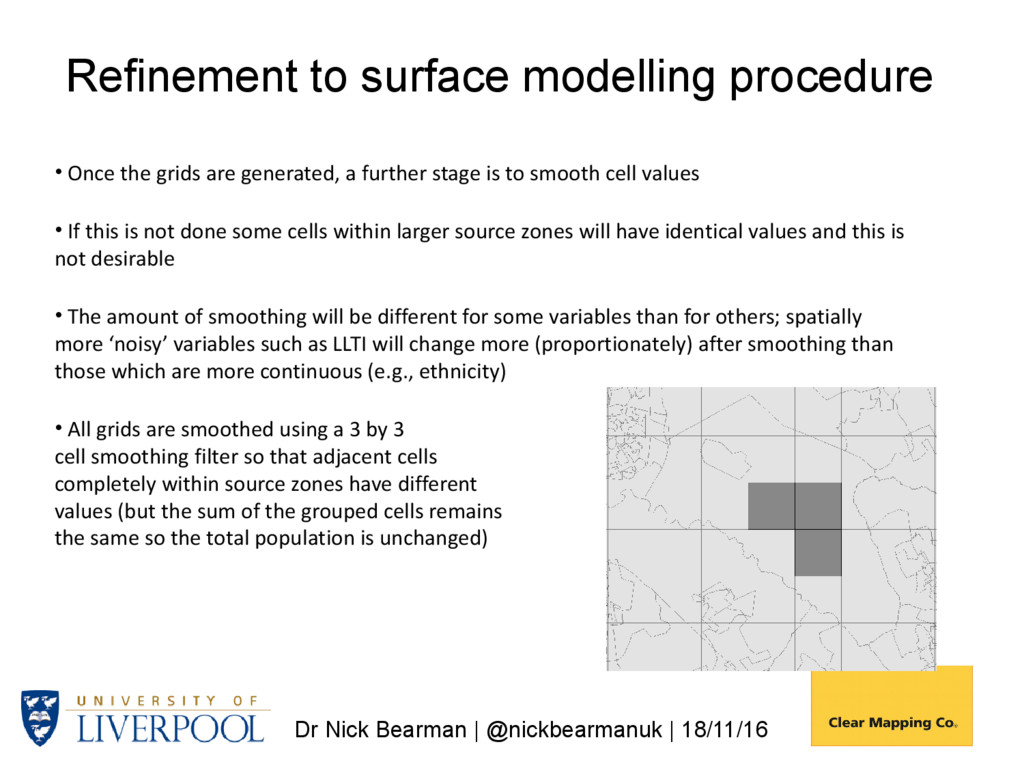
modelling procedure • Once the grids are generated, a further stage is to smooth cell values • If this is not done some cells within larger source zones will have identical values and this is not desirable • The amount of smoothing will be different for some variables than for others; spatially more ‘noisy’ variables such as LLTI will change more (proportionately) after smoothing than those which are more continuous (e.g., ethnicity) • All grids are smoothed using a 3 by 3 cell smoothing filter so that adjacent cells completely within source zones have different values (but the sum of the grouped cells remains the same so the total population is unchanged)
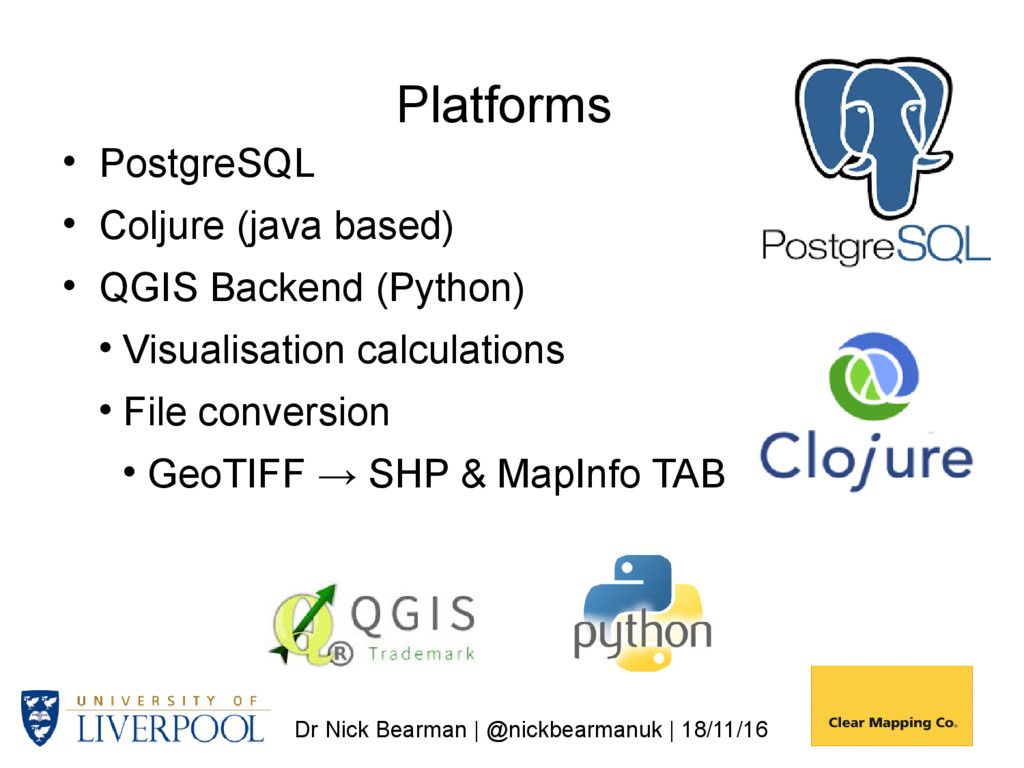
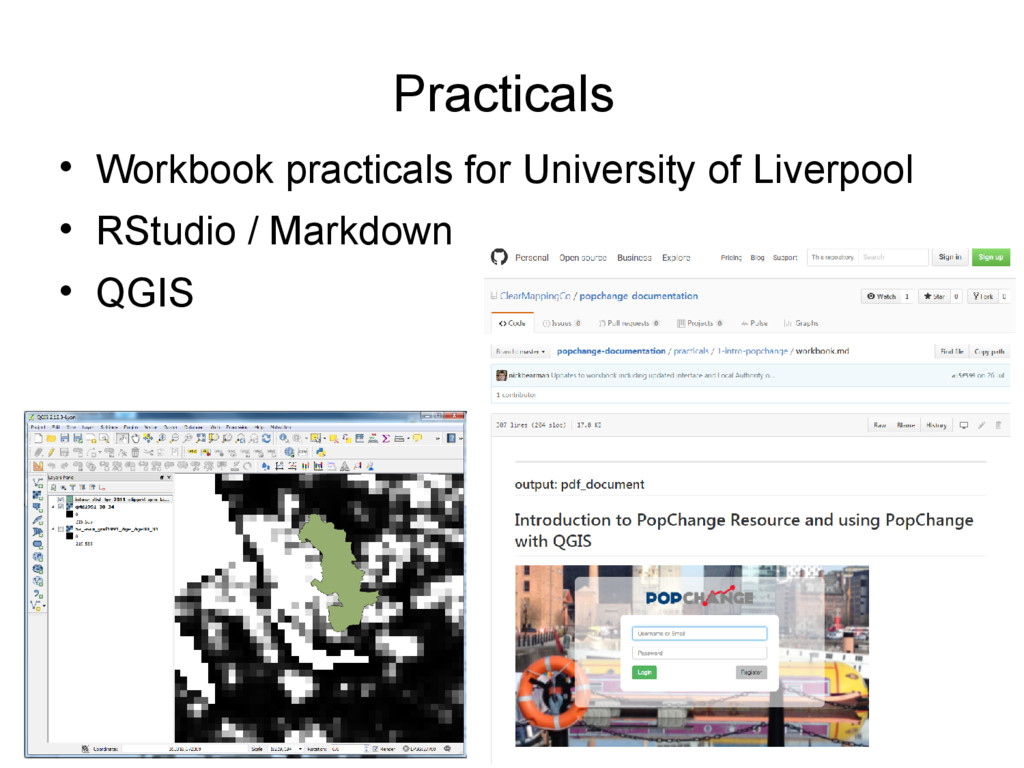
populations to grid cells and smoothing completed in R/RStudio • Version controlled with Git • R script available on GitHub https://github.com/nickbearman/popchange Technical – how did we create the grids and the online interface?
• Ensures code is available to anyone who wishes to access it • Allows future collaboration • We have plans for expansion of the tools through another (potential) project
workshop Talk on PopChange and practical session University of Liverpool in London 33 Finsbury Square, London EC2A 1AG Date Mon 6th Feb Email list / Twitter for details! as workshop in London