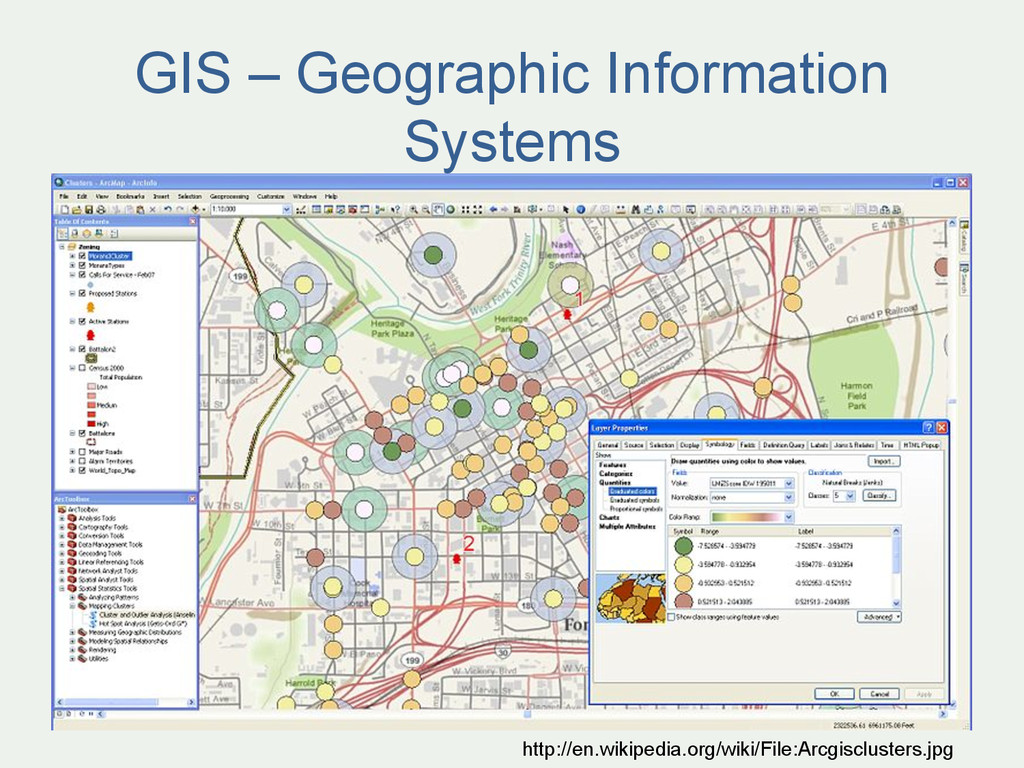
Using this information to answer questions – How have housing conditions changed in the past ten years? http://www.flickr.com/photos/dsleeter_2000/3097476532
for statistical computing and graphics” • freely available = ‘free as in beer’ and ‘free as in speech’ • graphics = GIS • user contributed – GIS • packages / libraries
you did and repeat specific pieces of work – Lots of reproducible examples on the web – Easily scriptable. 134,567 maps? easy! – 2011 Census Open Atlas – http://www.alex-singleton.com/r/2014/02/05/2011-census-open-atlas-project-version-two/
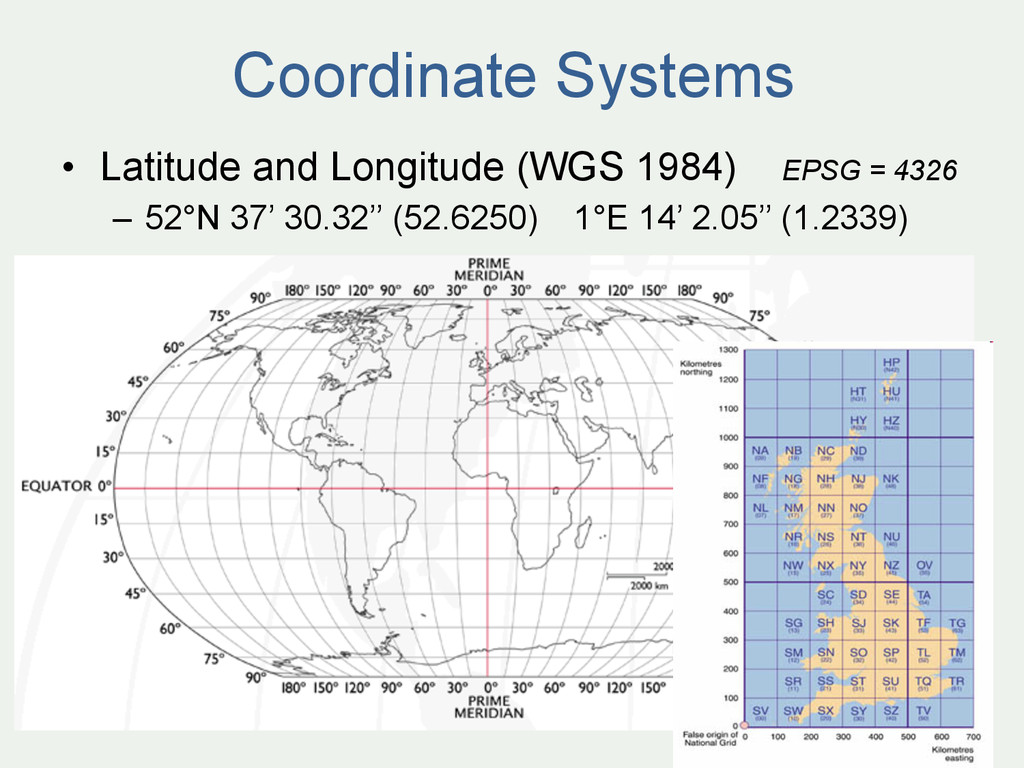
52°N 37’ 30.32’’ (52.6250) 1°E 14’ 2.05’’ (1.2339) • British National Grid (Eastings & Northings) – Easting: 619301 Northing: 307416 EPSG = 27700 • Why is it important? – Some data in WGS84 (lat/long) – Some use BNG (Eastings/Northings) – Need to convert between the two Coordinate Systems
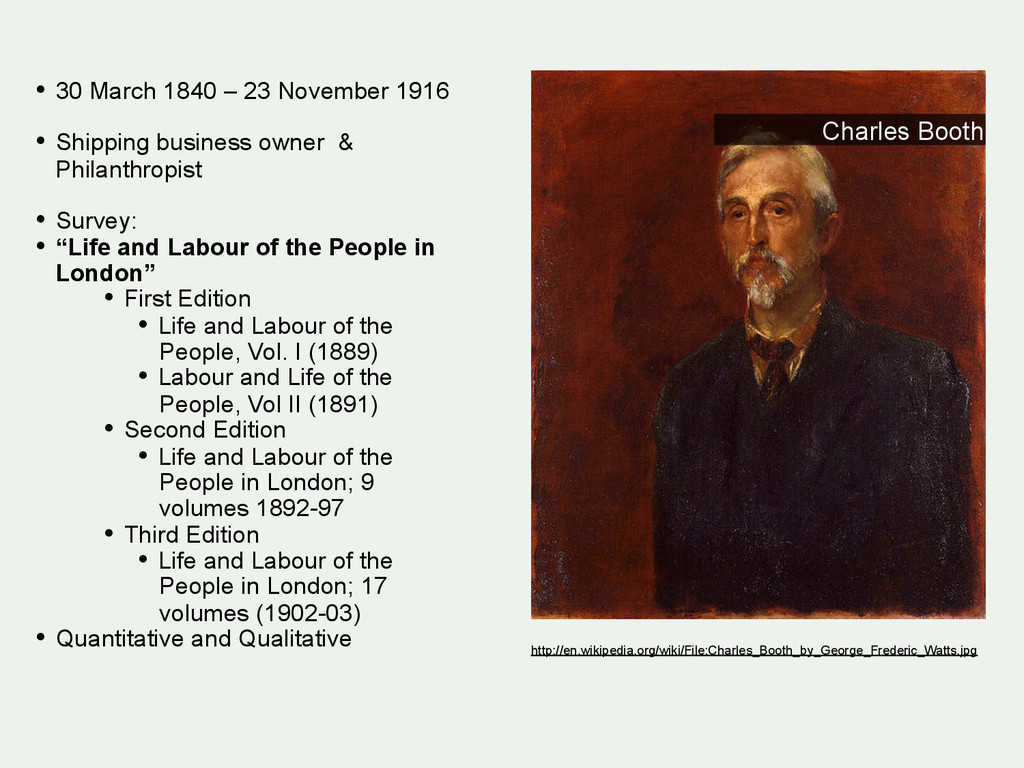
• Shipping business owner & Philanthropist • Survey: • “Life and Labour of the People in London” • First Edition • Life and Labour of the People, Vol. I (1889) • Labour and Life of the People, Vol II (1891) • Second Edition • Life and Labour of the People in London; 9 volumes 1892-97 • Third Edition • Life and Labour of the People in London; 17 volumes (1902-03) • Quantitative and Qualitative
casual. Chronic want. LIGHT BLUE: Poor. 18s. to 21s. a week for a moderate family PURPLE: Mixed. Some comfortable others poor PINK: Fairly comfortable. Good ordinary earnings. RED: Middle class. Well-to-do. YELLOW: Upper-middle and Upper classes. Wealthy.
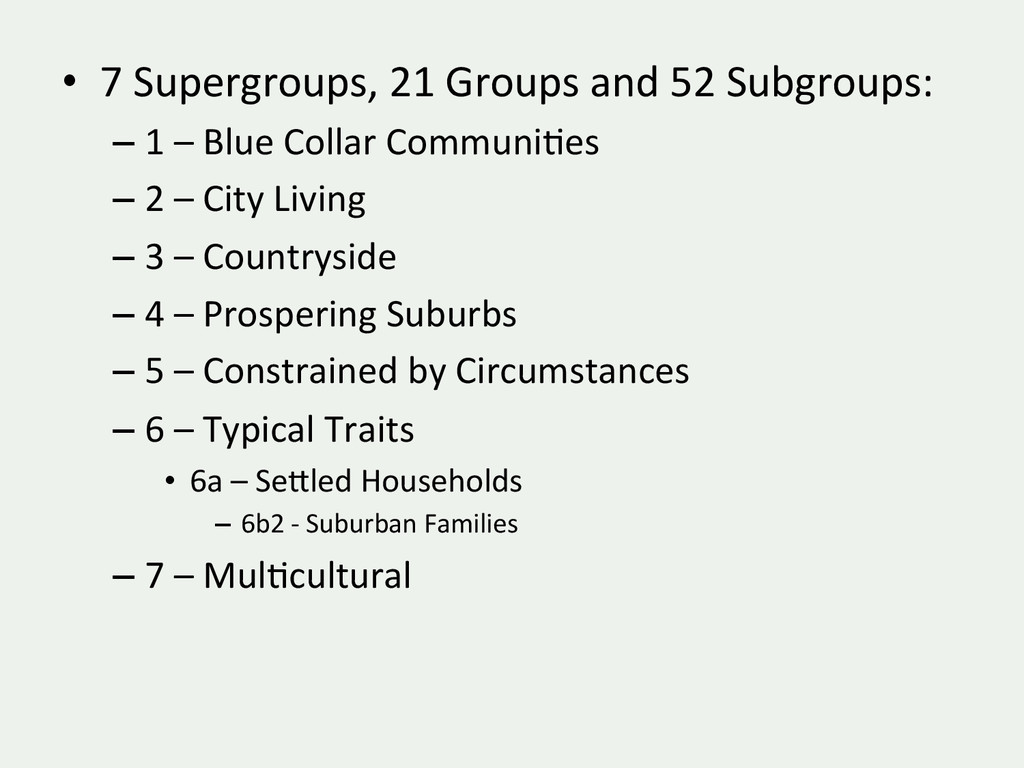
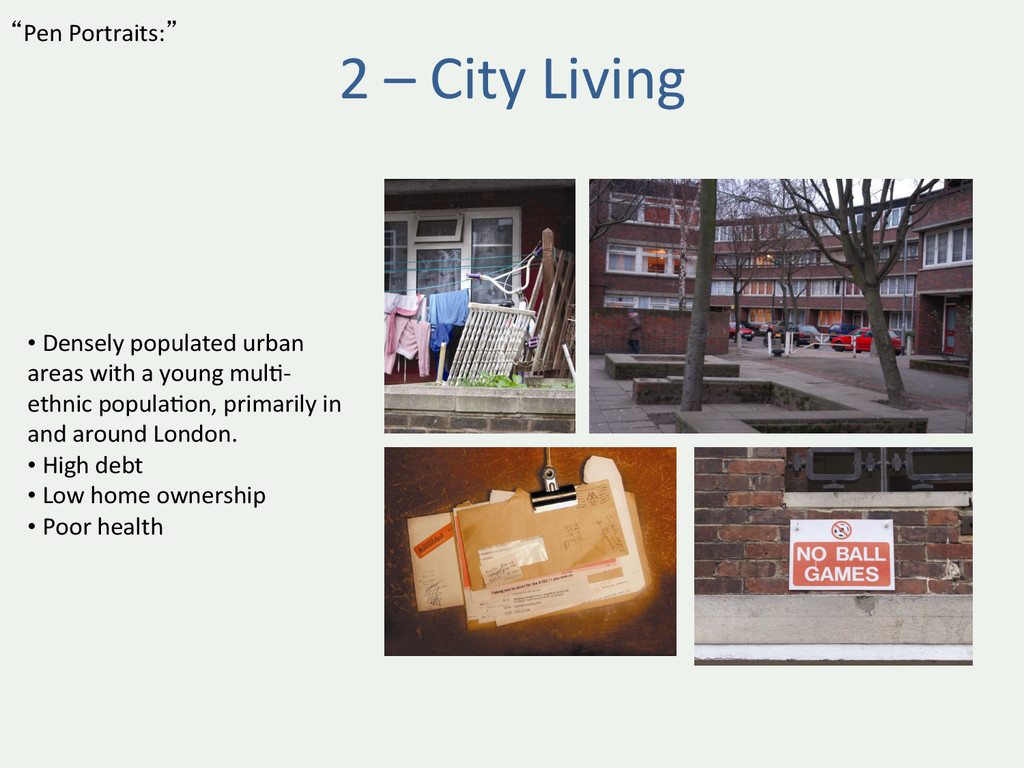
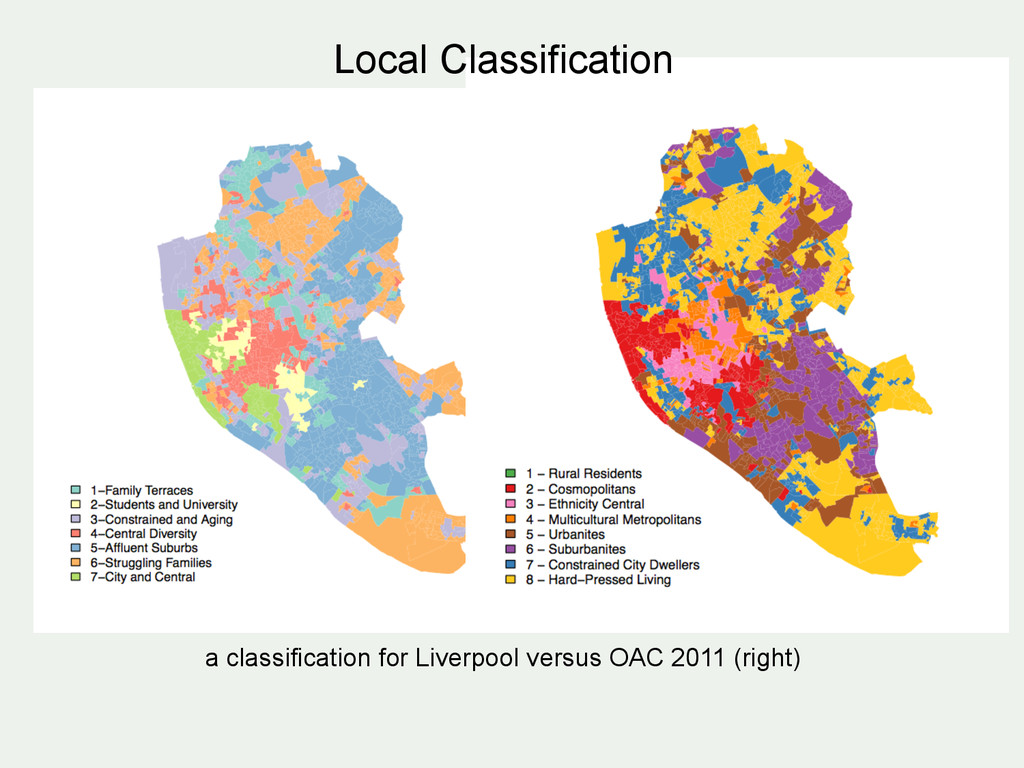
poorly paid young people and a relaFvely high ethnic mix are key characterisFcs. These young families live in the terraced streets of many major ciFes, including Birmingham, Bradford and London.
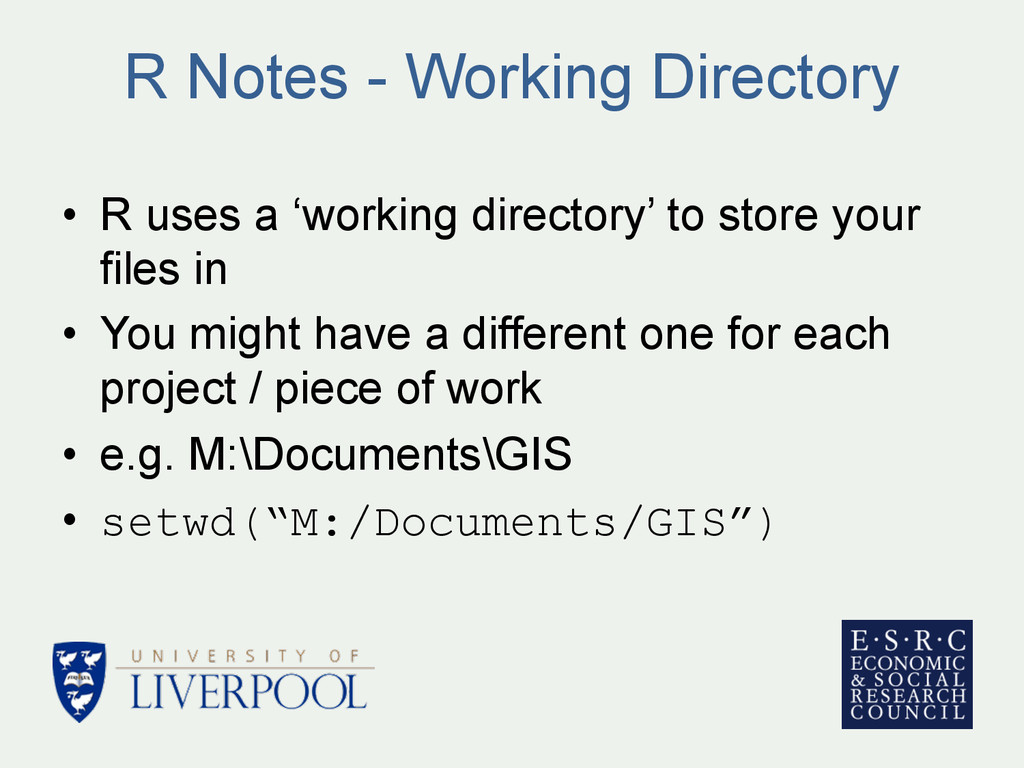
directory’ to store your files in • You might have a different one for each project / piece of work • e.g. M:\Documents\GIS • setwd(“M:/Documents/GIS”)
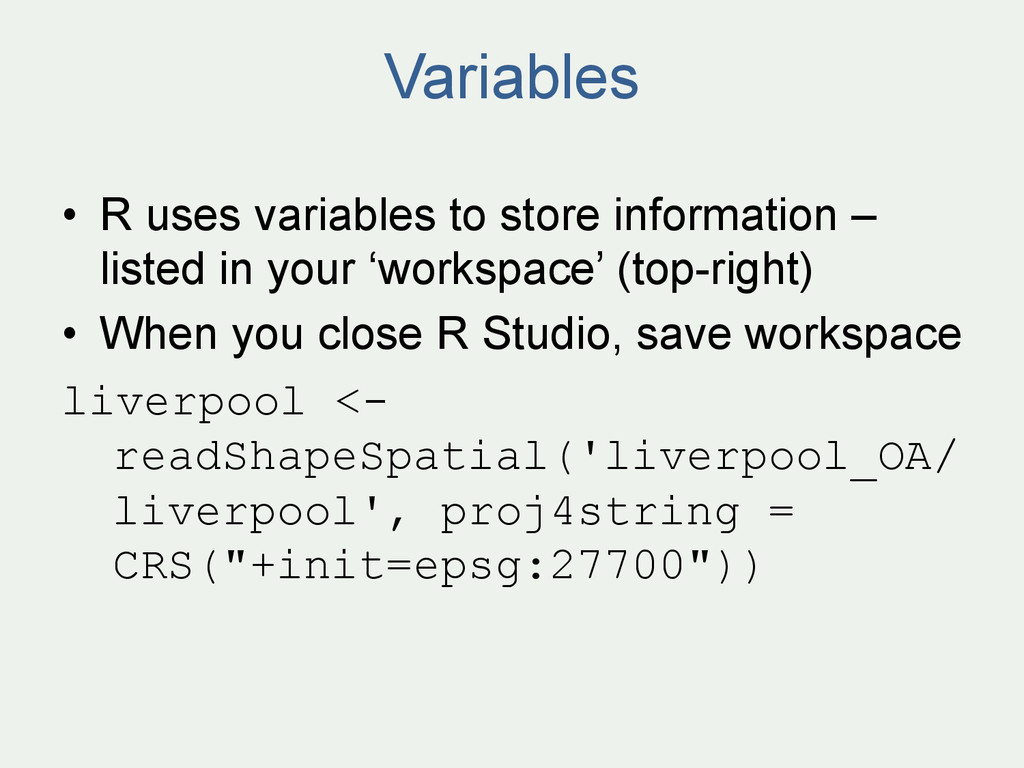
in your ‘workspace’ (top-right) • When you close R Studio, save workspace liverpool <- readShapeSpatial('liverpool_OA/ liverpool', proj4string = CRS("+init=epsg:27700"))
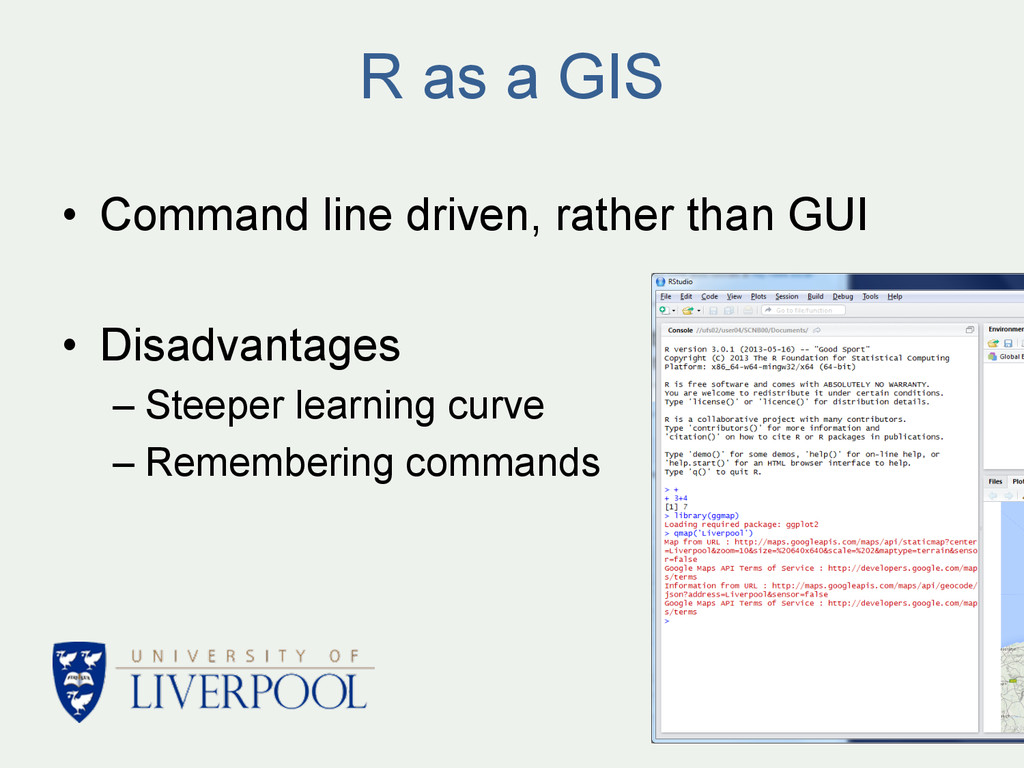
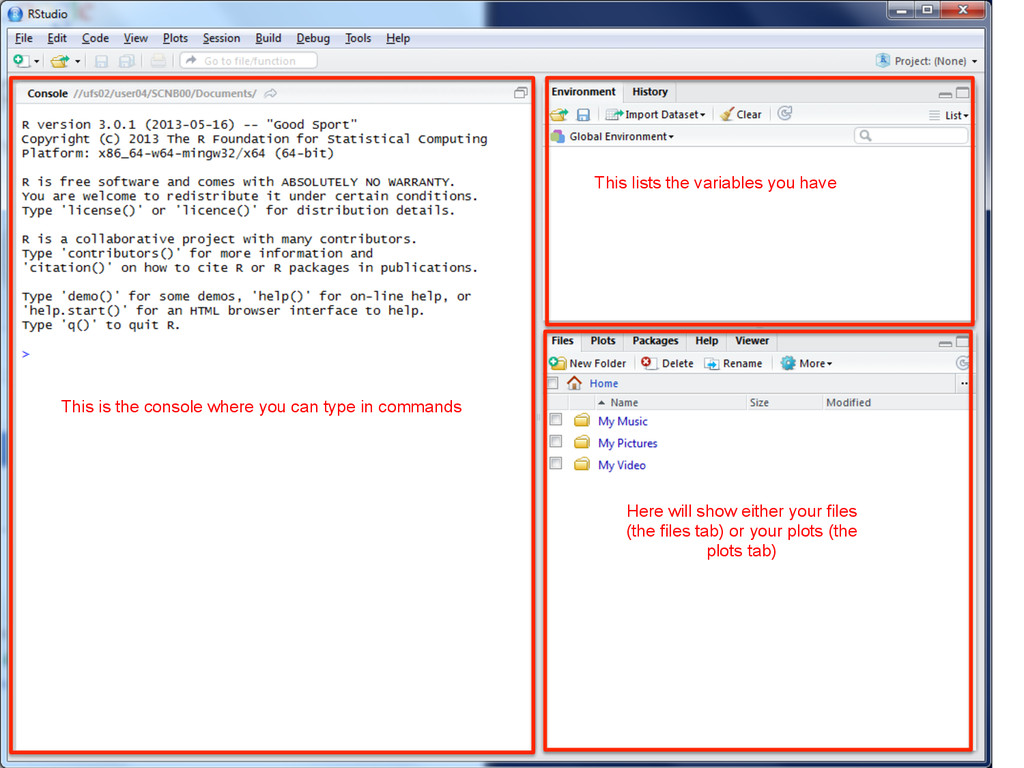
can type in commands Here will show either your files (the files tab) or your plots (the plots tab) This lists the variables you have This is where you can write scripts
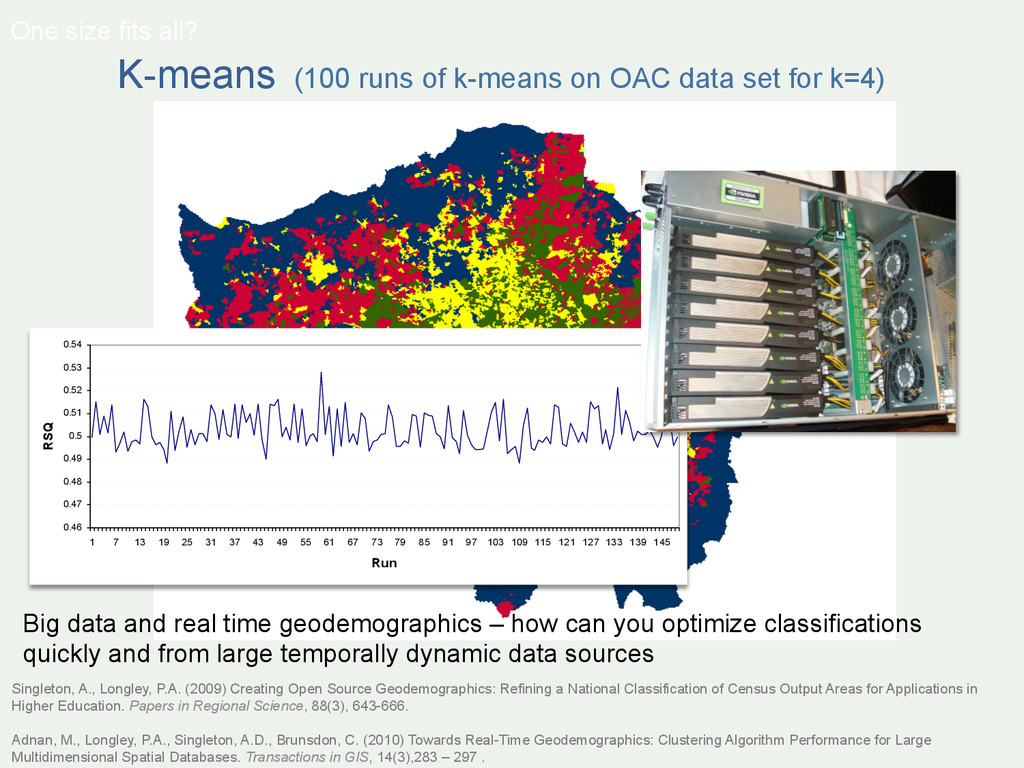
k=4) 0.46 0.47 0.48 0.49 0.5 0.51 0.52 0.53 0.54 1 7 13 19 25 31 37 43 49 55 61 67 73 79 85 91 97 103 109 115 121 127 133 139 145 Run RSQ Singleton, A., Longley, P.A. (2009) Creating Open Source Geodemographics: Refining a National Classification of Census Output Areas for Applications in Higher Education. Papers in Regional Science, 88(3), 643-666. Adnan, M., Longley, P.A., Singleton, A.D., Brunsdon, C. (2010) Towards Real-Time Geodemographics: Clustering Algorithm Performance for Large Multidimensional Spatial Databases. Transactions in GIS, 14(3),283 – 297 . One size fits all? Big data and real time geodemographics – how can you optimize classifications quickly and from large temporally dynamic data sources
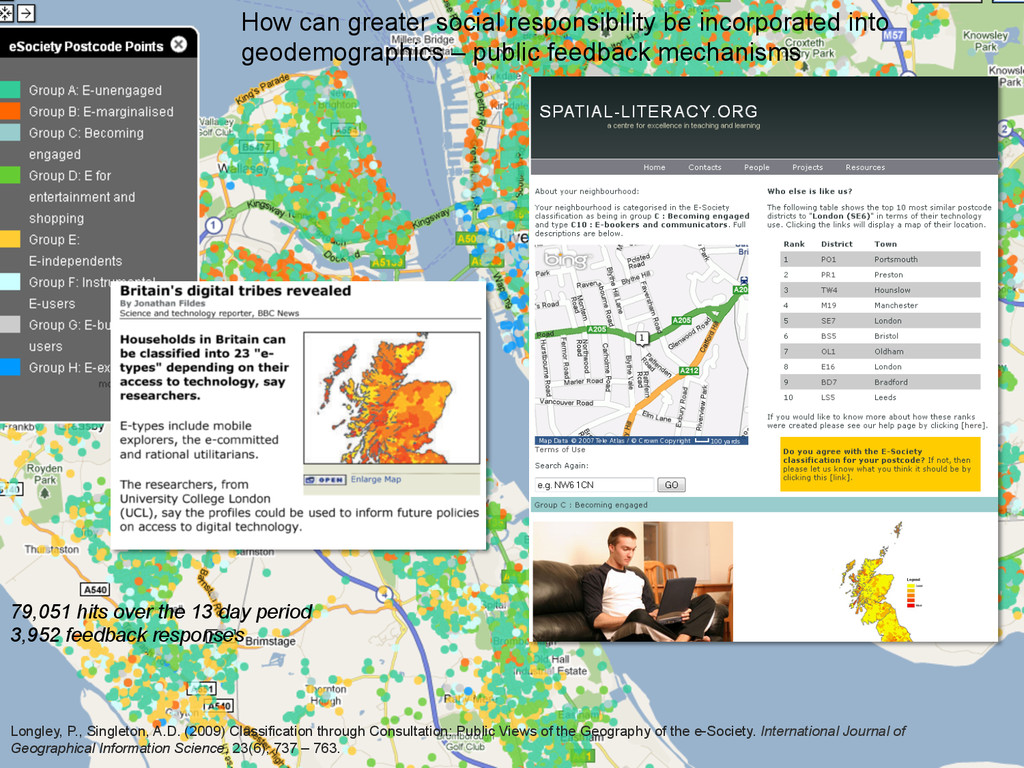
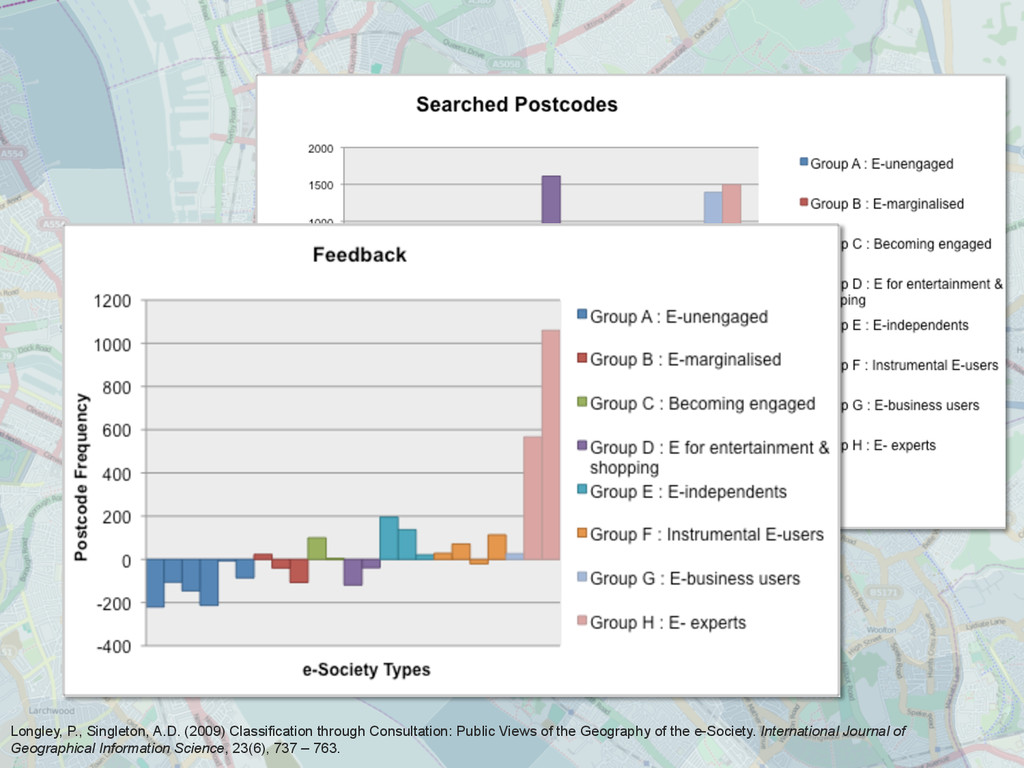
of the Geography of the e-Society. International Journal of Geographical Information Science, 23(6), 737 – 763. 79,051 hits over the 13 day period 3,952 feedback responses How can greater social responsibility be incorporated into geodemographics – public feedback mechanisms
– www.youtube.com/user/marinstatlectures/playlists – http://cran.r-project.org/doc/contrib/intro-spatial-rl.pdf • R problems – www.alex-singleton.com/R-Tutorial-Materials/ – “Why doesn’t my code work? - Common things to check”