Upgrade to Pro — share decks privately, control downloads, hide ads and more …

Deceived by monitoring

Deceived by monitoring

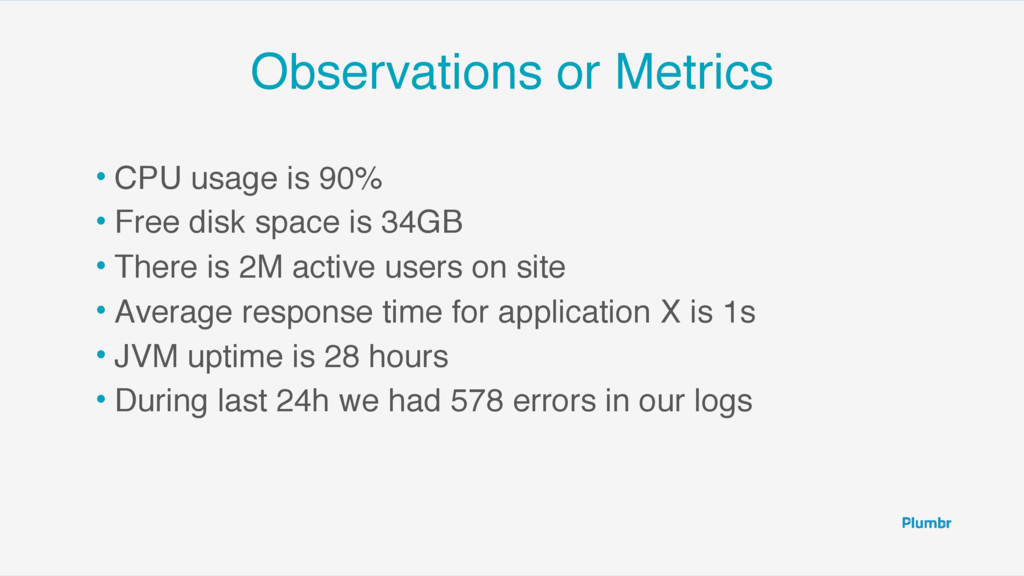
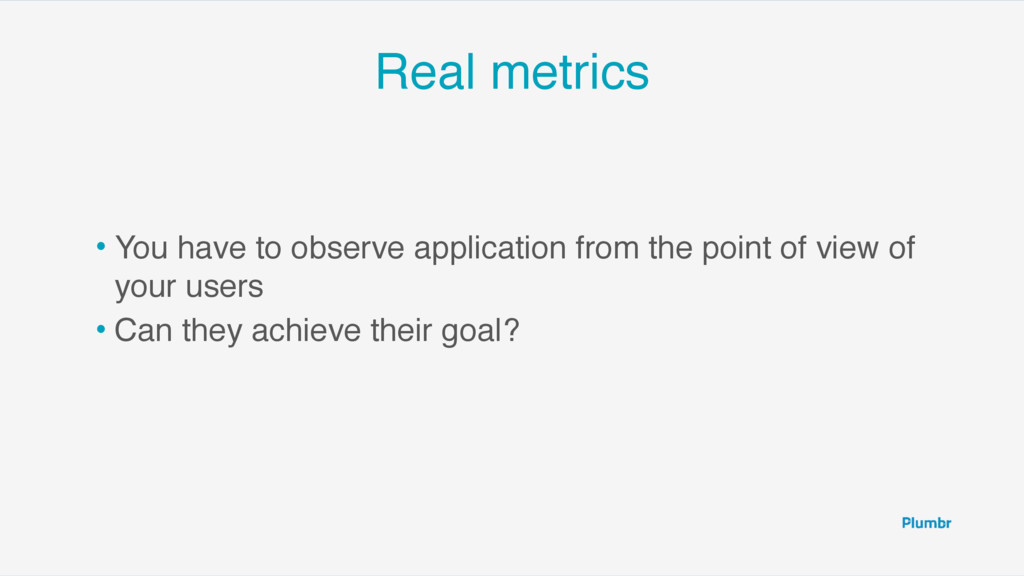
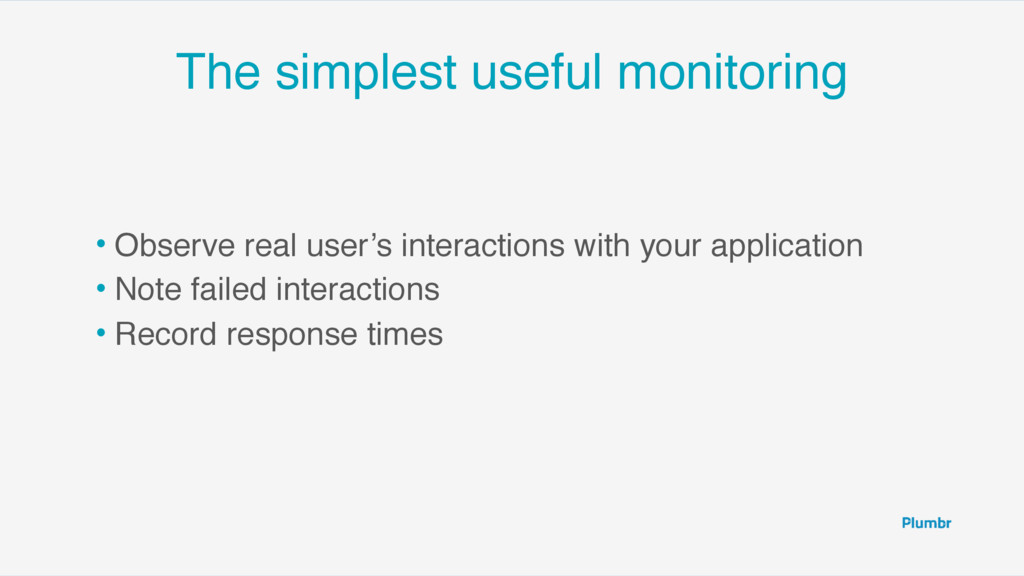
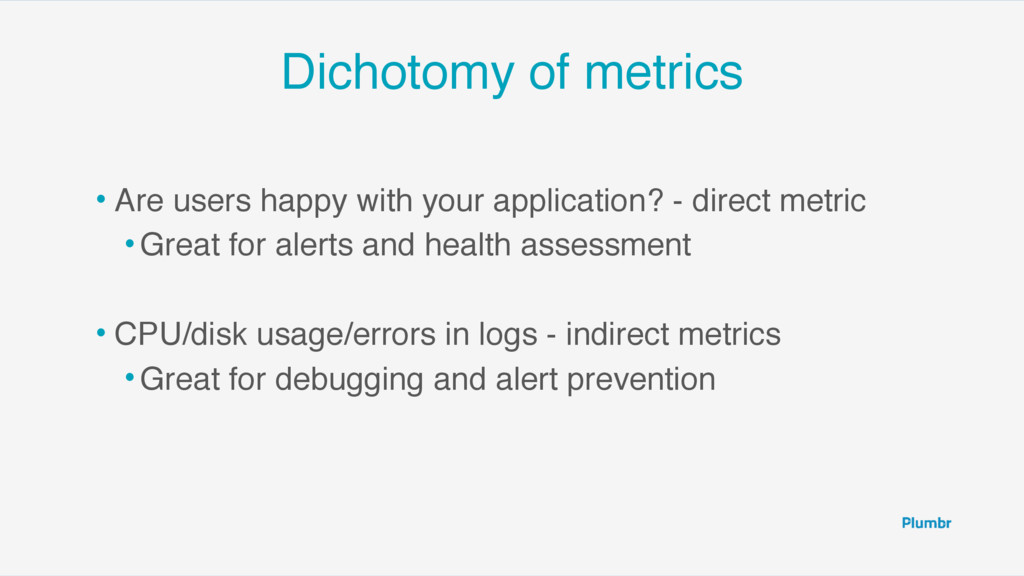
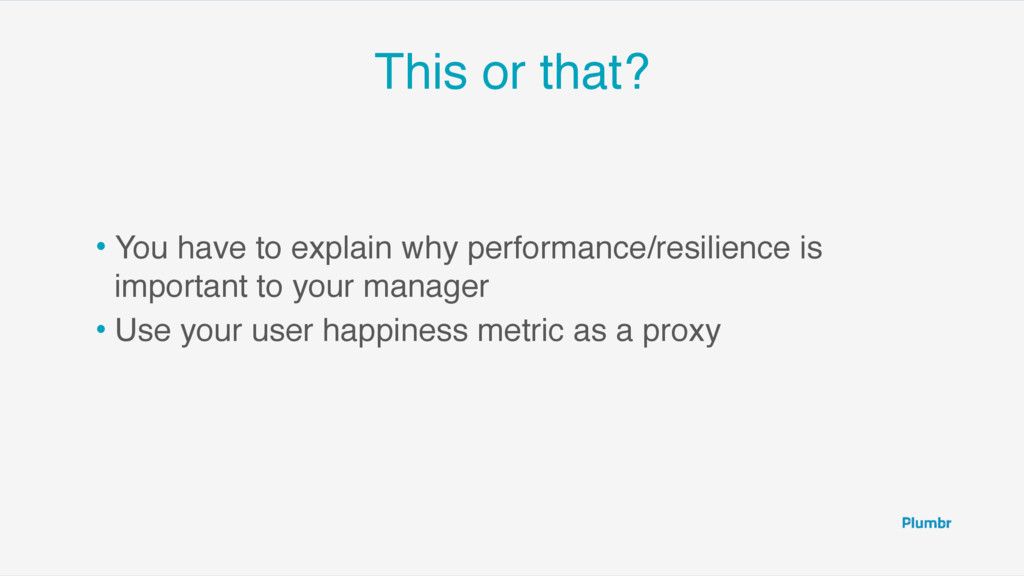
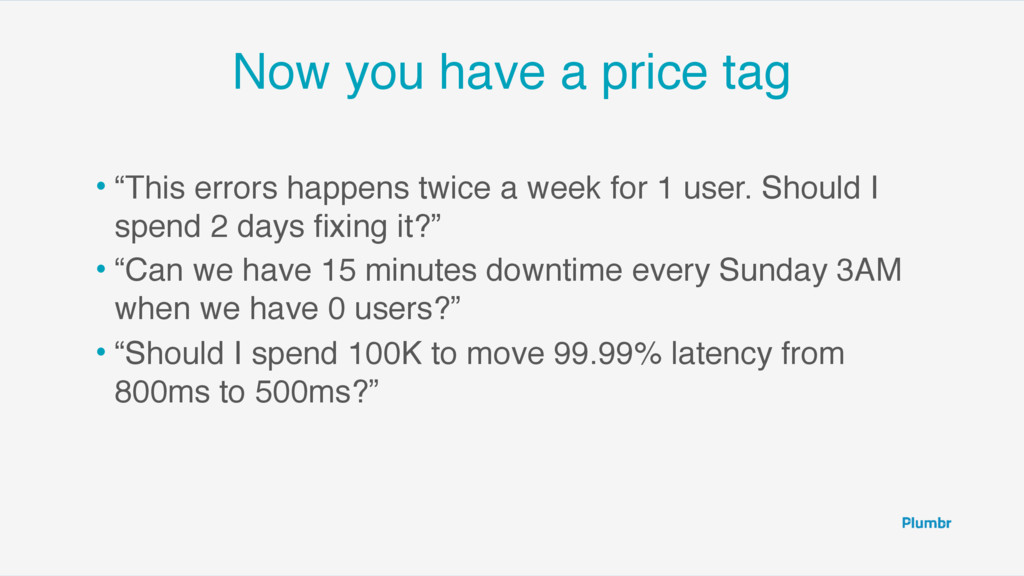
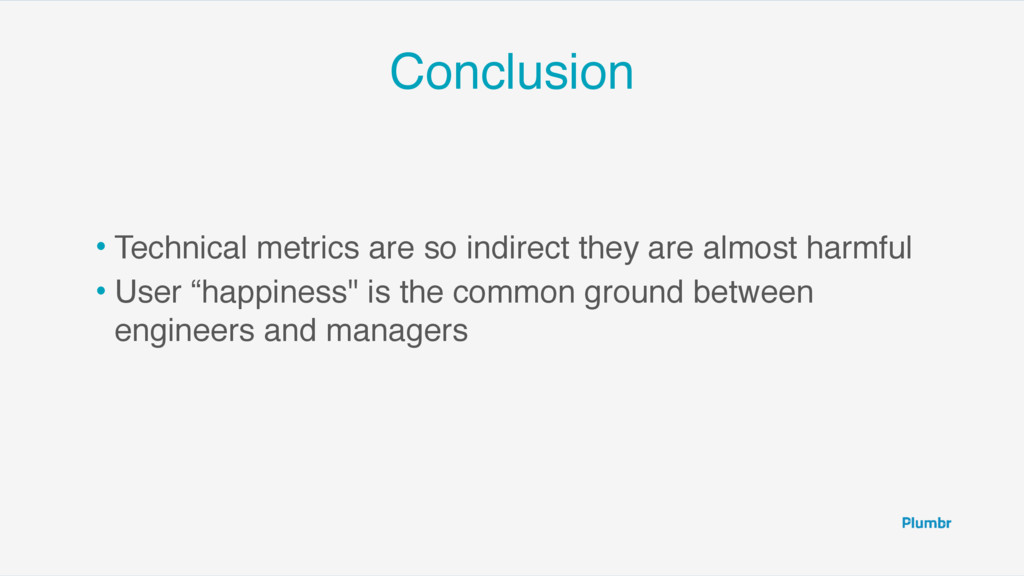
What is the main metric you monitor to judge the health of your system? Average CPU load? The slowest query in DB? We have talked with many teams, both developers and operations, about what they monitor and what metric they collect to assess the health of their product. Too many times we heard about CPU monitoring, log aggregation, average response times etc. Only in rare cases end-user satisfaction and it’s impact to business was measured. From this talk attendees will learn: * why you should invite business people to help define important monitoring metrics * why monitoring only technical gauges is not enough * the most misleading metric: the average value and the power of percentiles

Nikita Salnikov-Tarnovski

February 07, 2017
Tweet

More Decks by Nikita Salnikov-Tarnovski

Other Decks in Programming

Transcript

  1. Me • Nikita Salnikov-Tarnovski, @iNikem • Java developer for 16

    years • 7 years mainly performance problems solving • Master Developer at Plumbr
  2. What is monitoring “monitoring and management of performance and availability

    of software applications [with the goal] to detect and diagnose complex application performance problems to maintain an expected level of service”. Wikipedia
  3. Huh, WAT? • Observe the state of the system •

    Understand is it “good” or “bad” •If “bad” make it “good” • Make it “better” in the future
  4. Observations or Metrics • CPU usage is 90% • Free

    disk space is 34GB • There is 2M active users on site • Average response time for application X is 1s • JVM uptime is 28 hours • During last 24h we had 578 errors in our logs
  5. Goals of the application • The goal is not to

    use X% of CPU • And not to keep disk mostly empty • And even not to be fast
  6. Real metrics • You have to observe application from the

    point of view of your users • Can they achieve their goal?
  7. The simplest useful monitoring • Observe real user’s interactions with

    your application • Note failed interactions • Record response times
  8. Percentiles Q: How many of your users will experience at

    least one response that is longer than the 99.99%lie? A: 18% Gil Tene, How NOT to measure latency
  9. Percentiles • Always record your maximum value • Forget about

    median/average • Follow your 99%’lie or higher • Plot them on logarithmic scale
  10. 16

  11. Dichotomy of metrics • Are users happy with your application?

    - direct metric •Great for alerts and health assessment • CPU/disk usage/errors in logs - indirect metrics •Great for debugging and alert prevention
  12. This or that? • You have to explain why performance/resilience

    is important to your manager • Use your user happiness metric as a proxy
  13. Suits and beards • Let business people decide which services

    and which users are more important • Then you don’t need to prove the importance of any performance fix any more :)
  14. Suits and beards • And you have a perfect priority

    for improvements • That actually makes sense to your manager!
  15. When you talk to a suit • “How many operations

    can fail” •“Are you stupid? Of course 0!” • “How much time can the system be down” •“Are you kidding me? No downtime!” • “How fast must operations be” •“What a question is this? As fast as possible!”
  16. Now you have a price tag • “This errors happens

    twice a week for 1 user. Should I spend 2 days fixing it?” • “Can we have 15 minutes downtime every Sunday 3AM when we have 0 users?” • “Should I spend 100K to move 99.99% latency from 800ms to 500ms?”
  17. Conclusion • Technical metrics are so indirect they are almost

    harmful • User “happiness" is the common ground between engineers and managers
  18. Solving performance problems is hard. We don’t think it needs

    to be. @JavaPlumbr/@iNikem http://plumbr.eu