Upgrade to Pro — share decks privately, control downloads, hide ads and more …

Introduction to Druid

Introduction to Druid

More Decks by Nikita Salnikov-Tarnovski

Other Decks in Programming

Transcript

  1. Why me? • I introduced Druid to a team •

    We are happy about it • I like their design choices •but not there code :(
  2. Questions to ask • What was the slowest service during

    last flash sale? • What sql query has the biggest impact on user satisfaction? • Who are my most unhappy users this week? • Are we getting better?
  3. Data to collect { "accountId": "XXXX", "transactionId": "9b6bbb93-0f64-389b-beae-ccd294f2286d", "jvmId": [

    "H0QXvFsZ"], "originatingJvm": "H0QXvFsZ", "applicationKey": "535624dd815fb8762c378ac6b15937dc", "rootCause": [454708], "problemId": ["454708:600492565"], "problemsDuration": 4572, "userId": 42, "transactionStart": "1493548894024", "transactionDuration": "5432", "success": "0", "slow": "0", "failed": "1", "status": "failed", "serviceId": "6d17705ebf2724d96da48cc349e6c12d", "jobId": null, "isBrowser": false, "browserAgent": "MSIE", "country": "US" } { "accountId": "XXXX", "jvmId": "YYY", "timestamp": 1493548969876, "allocationRate": 14968164, "usedMemHeap": 574524040, "usedMemNative": 1125826560, "usedPermGen": 64078208 }
  4. Data point • Timestamp • Dimensions •who, where, what •means

    to select a subset of data • Metrics •how many •measured values you are interested in
  5. Practical implications +Failure of a single node does not affect

    you much -Very high operational overhead
  6. Data storage • All data is stored in files called

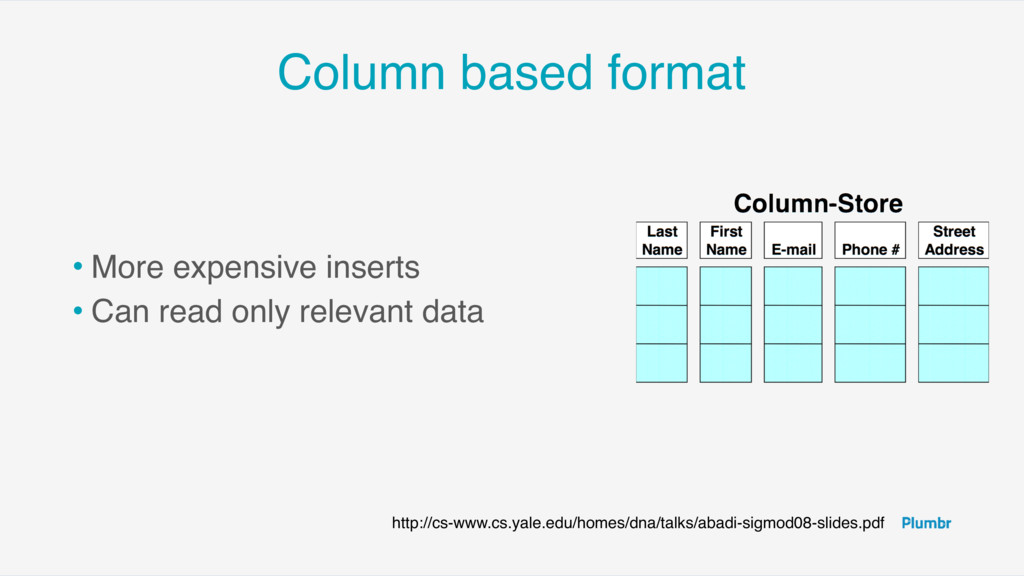
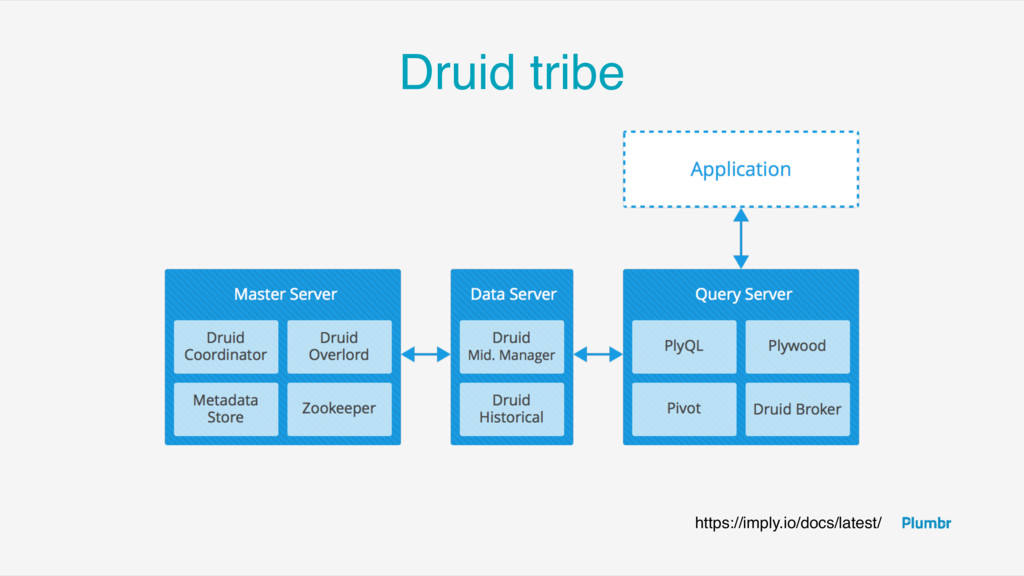
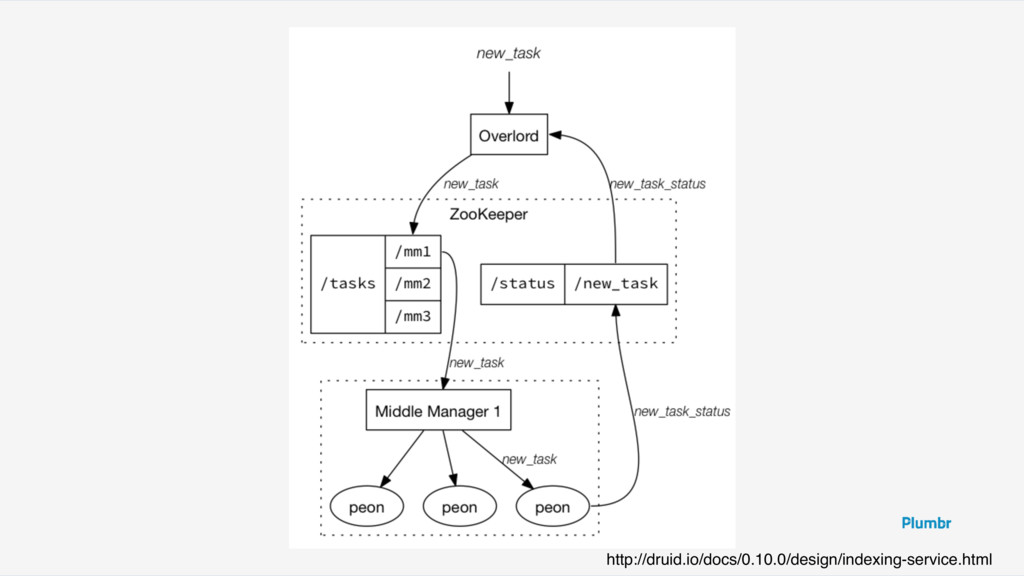
    “segments” • Contains all the information for some period of time •including indices, dictionaries • Immutable columnar format • Can be further sharded
  7. Data distribution • Segments are held in deep storage •HDFS,

    S3, Azure, Google Cloud, Cassandra, etc • Coordinator says to each historical node what to load • Historicals can be organised in tiers
  8. Practical implications +Every single historical can die without any impact

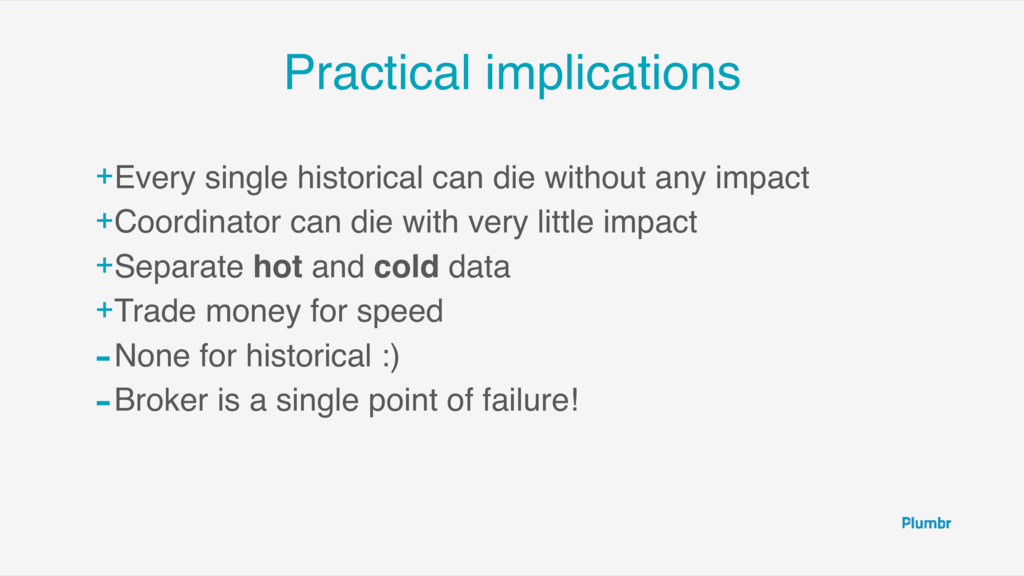
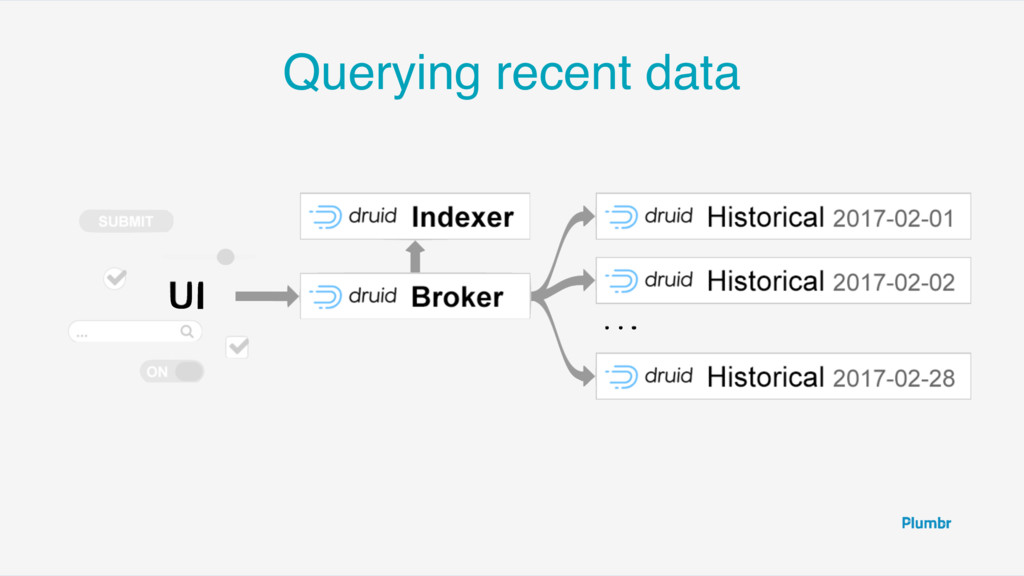
    +Coordinator can die with very little impact +Separate hot and cold data +Trade money for speed -None for historical :) -Broker is a single point of failure!
  9. Queries • SQL-like PlyQL • JSON over HTTP • We

    have built a small DSL over that json format
  10. Benchmarks are lies! • They are all requests to our

    Druid for some period • It says nothing about performance in your case
  11. Roll-up • We collect data every 5 seconds • But

    query with granularity 1 minute • We can aggregate data during index • usedMemHeap -> max(usedMemHeap) • allocationRate -> avg(allocationRate) { "accountId": "XXXX", "jvmId": "YYY", "timestamp": 1493548969876, "allocationRate": 14968164, "usedMemHeap": 574524040, "usedMemNative": 1125826560, "usedPermGen": 64078208 }
  12. Roll-up results • 1B records • 484G in Kafka, uncompressed

    json • 185G with unique ids • 9.18G rolled-up data without ids
  13. Take away • We are quite happy with it :)

    • Good tool for quite narrow problem
  14. Solving performance problems is hard. We don’t think it needs

    to be. @JavaPlumbr/@iNikem http://plumbr.eu