Upgrade to Pro — share decks privately, control downloads, hide ads and more …

Where is my memory

Where is my memory

Nikita Salnikov-Tarnovski

October 26, 2015
Tweet

More Decks by Nikita Salnikov-Tarnovski

Other Decks in Programming

Transcript

  1. Who am I • Nikita Salnikov-Tarnovski • Founder and Master

    Developer from • @iNikem / @JavaPlumbr
  2. Plumbr • Application performance monitor with root cause detection •

    In case of problem reports you exact details • Memory leaks, class loader leaks, GC related problems, contented locks, slow JDBC and HTTP requests, OOMs
  3. Agenda • Quick overview of JVM and memory • A

    word on Garbage Collector • Reachability, memory leaks and OOM • Memory usage monitoring • Heap dump • Eclipse Memory Analyser Tool
  4. JVM process memory • JVM is just usual process from

    OS point of view • And requires some memory for itself: • GC • JIT • JNI • threads
  5. JVM application memory • And then comes your application •

    Heap • Permanent Generation • Threads • And native memory • Off-heap allocations • Metaspace
  6. Default sizes • Default sizes of these regions depends on

    the computer • java -XX:+UnlockDiagnosticVMOptions -XX: +PrintFlagsFinal -version • MaxHeapSize • MaxPermSize/MaxMetaspaceSize • ThreadStackSize • http://docs.oracle.com/javase/8/docs/technotes/guides/vm/gctuning/toc.html
  7. How to change them • You almost always want to

    go with non-default sizes • -Xmx2g • -XX:MaxPermSize=128m • -Xss512k (rarely) • -XX:MaxMetaspaceSize=128m (rarely)
  8. You have to fit • All that memory HAS to

    come from RAM • You do NOT ever let it go to swap
  9. Java memory management • JVM has automatic memory management •

    Developers don’t think about it • They just create new objects and go on
  10. Garbage Collector • Subsystem of JVM for reclaiming “unused” memory

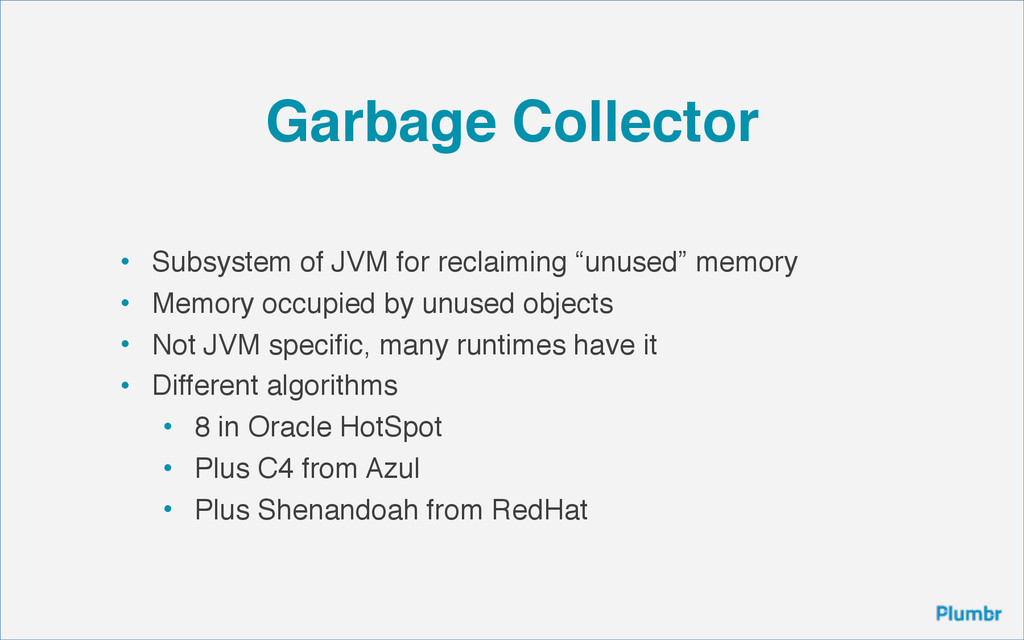
    • Memory occupied by unused objects • Not JVM specific, many runtimes have it • Different algorithms • 8 in Oracle HotSpot • Plus C4 from Azul • Plus Shenandoah from RedHat
  11. GC “wizardry” • GC is not mind reading magician •

    It always works by very specific and strict algorithm • “No references, thus garbage”
  12. GC roots • Special objects, always considered to be alive

    • Often heap objects referenced from outside the heap
  13. GC roots • System Classes • JNI references • Running

    Threads • Local variables or parameters • Native stack • Used monitors • Other :)
  14. References • From an object to the value of one

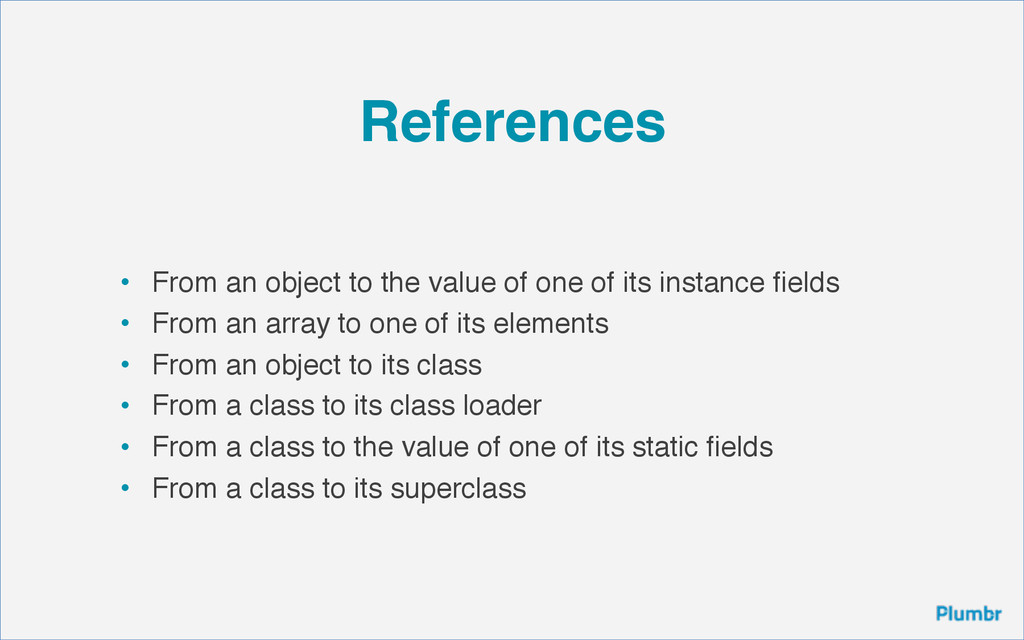
    of its instance fields • From an array to one of its elements • From an object to its class • From a class to its class loader • From a class to the value of one of its static fields • From a class to its superclass
  15. Not that hard • Those are so called “hard references”

    • There are also weak, soft and phantom references • Subclasses of java.lang.ref.Reference 18
  16. Weak Reference • You can wrap an object into a

    weak reference • If object is only weakly reachable, GC can discard it 19
  17. • GC can discard object wrapped into soft reference at

    any time. • ANY time. • But guarantees it happens before OOM Soft Reference
  18. Phantom Reference • If you find a legitimate use for

    them - call me • I have seen 2 in my 15 years in Java. 21
  19. Reachability • Mark all GC roots as “reachable” • Mark

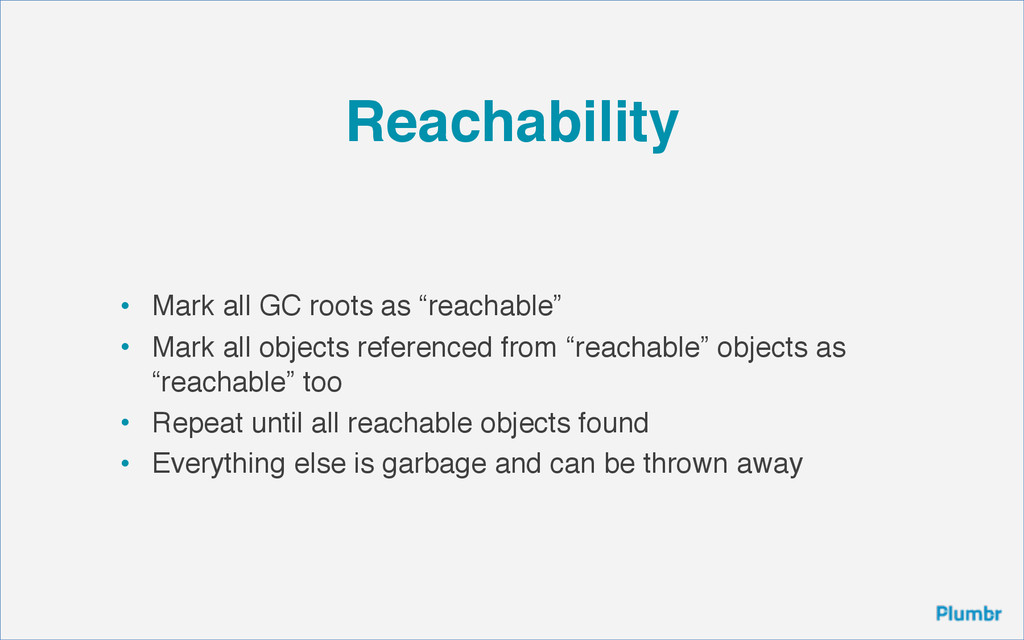
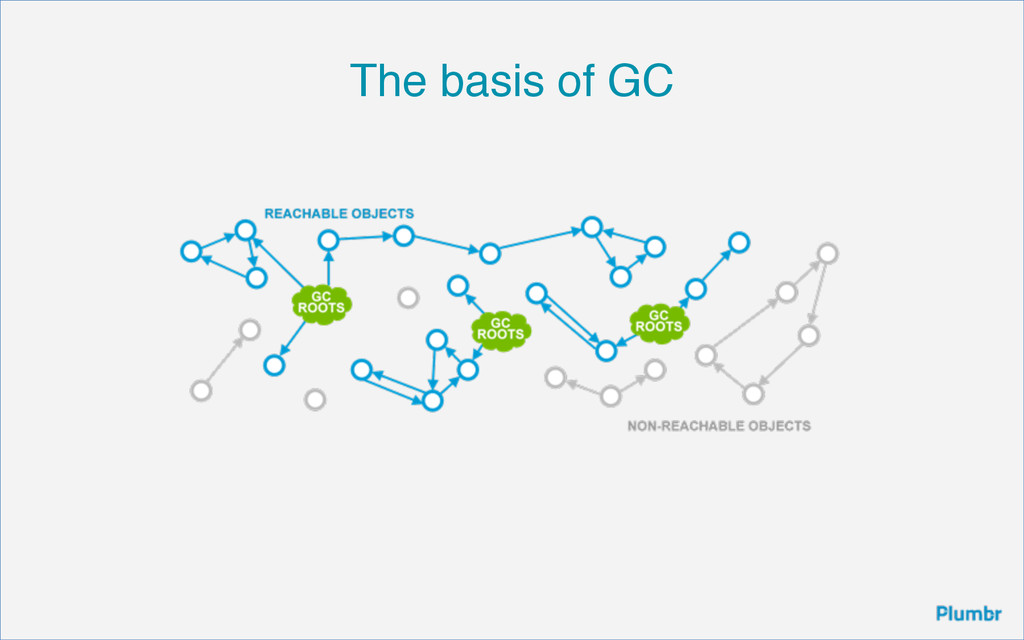
    all objects referenced from “reachable” objects as “reachable” too • Repeat until all reachable objects found • Everything else is garbage and can be thrown away
  20. Memory leak • Reachable object(s), that will never be used

    by application • Repetitive creation of such objects
  21. Examples • Caches without look-ups and eviction • String.substring •

    Immortal threads • Unclosed IO streams • Storages with longer lifespan than stored values
  22. So what? • That memory cannot be reclaimed by GC

    • Decreases the amount available to the application • If leak is growing, soon there is nothing left 29
  23. OOM • Not all of them signals of memory leaks

    • Unable to create new native thread • Out of swap space • Requested array size exceeds VM limit 31
  24. Not a memory leak • Too high allocation rate •

    Cache with wrong size • Trying to load too much data at once • Fat data structures
  25. Memory dump • One of the best ways to find

    out what consumes memory • Binary representation of objects graph written to a file • NOT an accurate representation
  26. When to get memory dump • As late as possible!

    • You want to let that needle grow and fill the whole hey sack
  27. What to do with it • Get it to a

    computer with lot of memory. • Add memory to that computer • MAT
  28. Shallow vs Deep • You can measure shallow size of

    the object • Or deep size of the subgraph starting with the object • Or retained size of the subgraph dominated by the object
  29. Shallow object size • Size of the object itself •

    With object header and all fields • But without fields’ values
  30. Retained size • r(O1)=O1+O2+O3+O4 • r(O2)=O2 • r(O3)=O3+O4 • r(O4)=O4

    • d(O1)=O1+O2+O3+O4 • d(O2)=O2+O3+O4 • d(O3)=O3+O4 • d(O4)=O4
  31. It’s not your fault • Most of the classloader leaks

    you will ever encounter are not your fault • Double-edge sword of reuse and modular development • You have no idea what do you use in your application