2025 18th International Congress on Advanced Applied Informatics Keisuke ANDO1 Takeshi UCHITANE1 Naoto MUKAI2 Kazunori IWATA3 Nobuhiro ITO1 1Aichi Institute of Technology 2Sugiyama Jogakuen University 3Aichi University 17th International Conference on Smart Computing and Artificial Intelligence Kitakyusyu, Japan, 13-19 July 2025
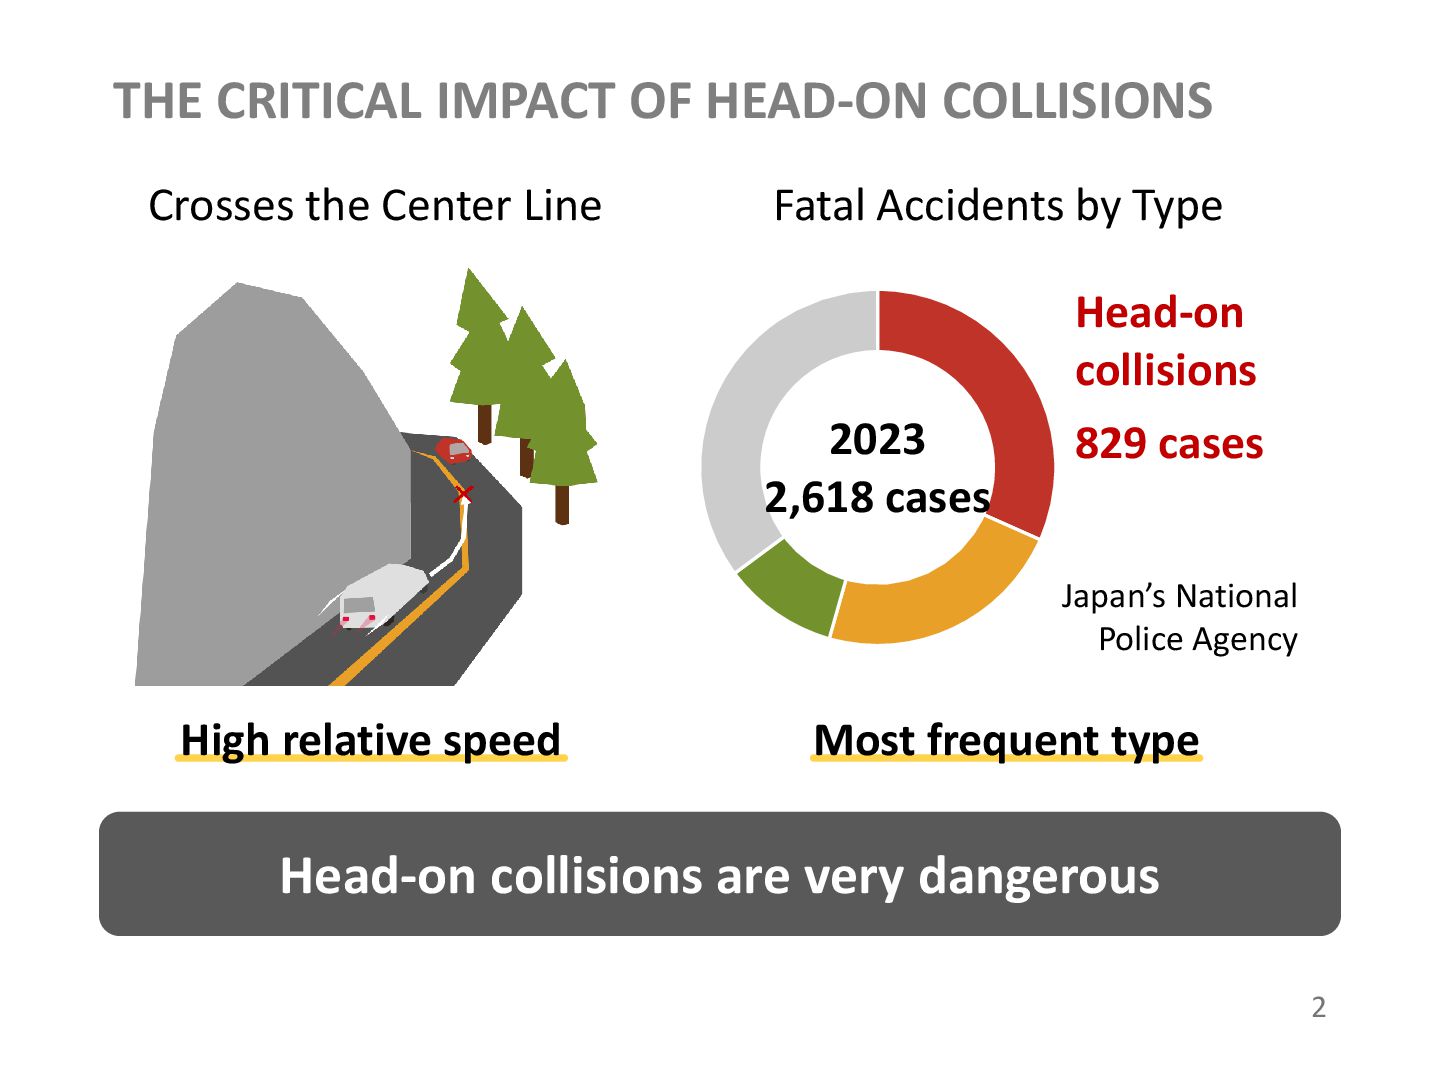
Crosses the Center Line Head-on collisions are very dangerous High relative speed Most frequent type 2023 2,618 cases Head-on collisions 829 cases Japan’s National Police Agency 2
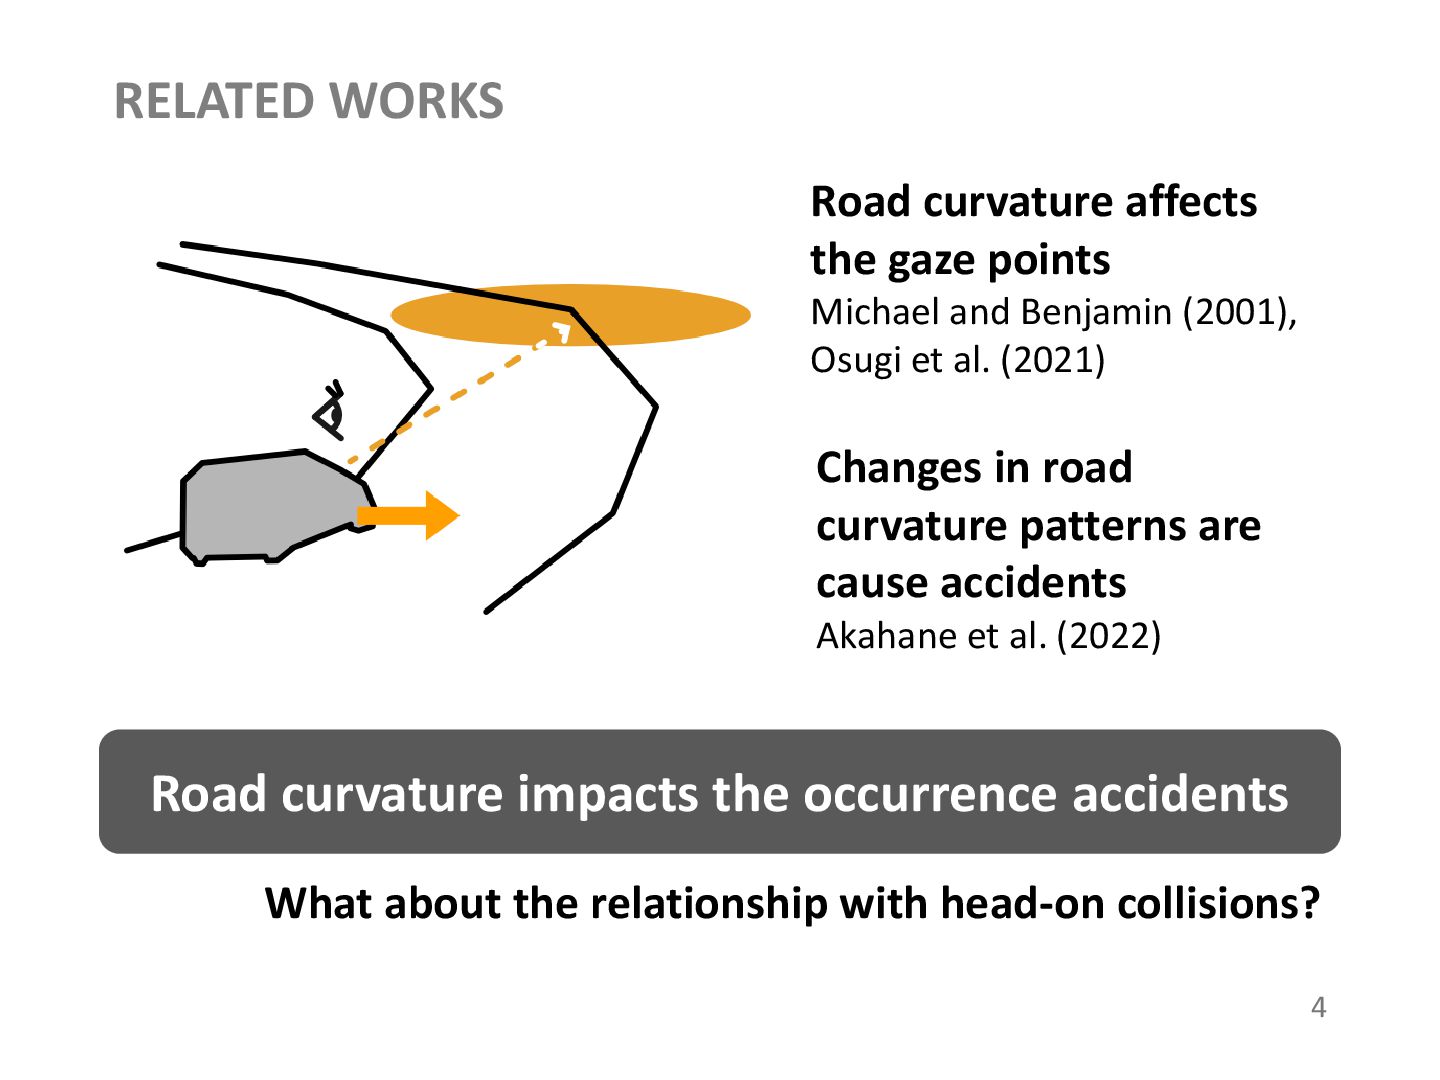
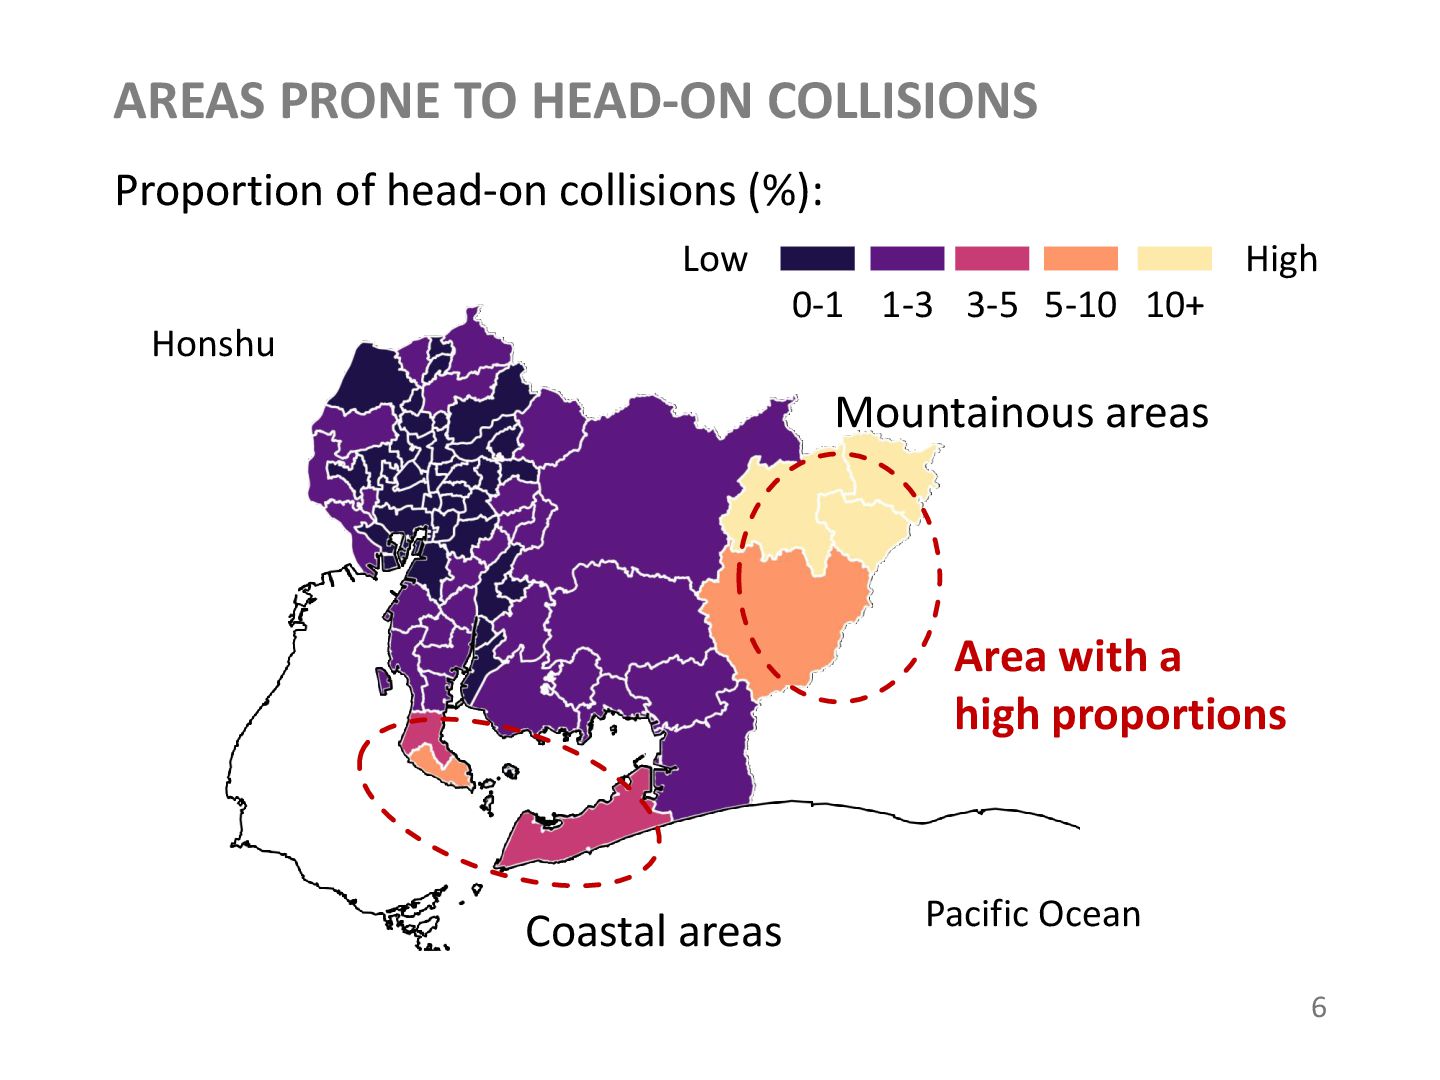
Benjamin (2001), Osugi et al. (2021) Changes in road curvature patterns are cause accidents Akahane et al. (2022) Road curvature impacts the occurrence accidents What about the relationship with head-on collisions? 4
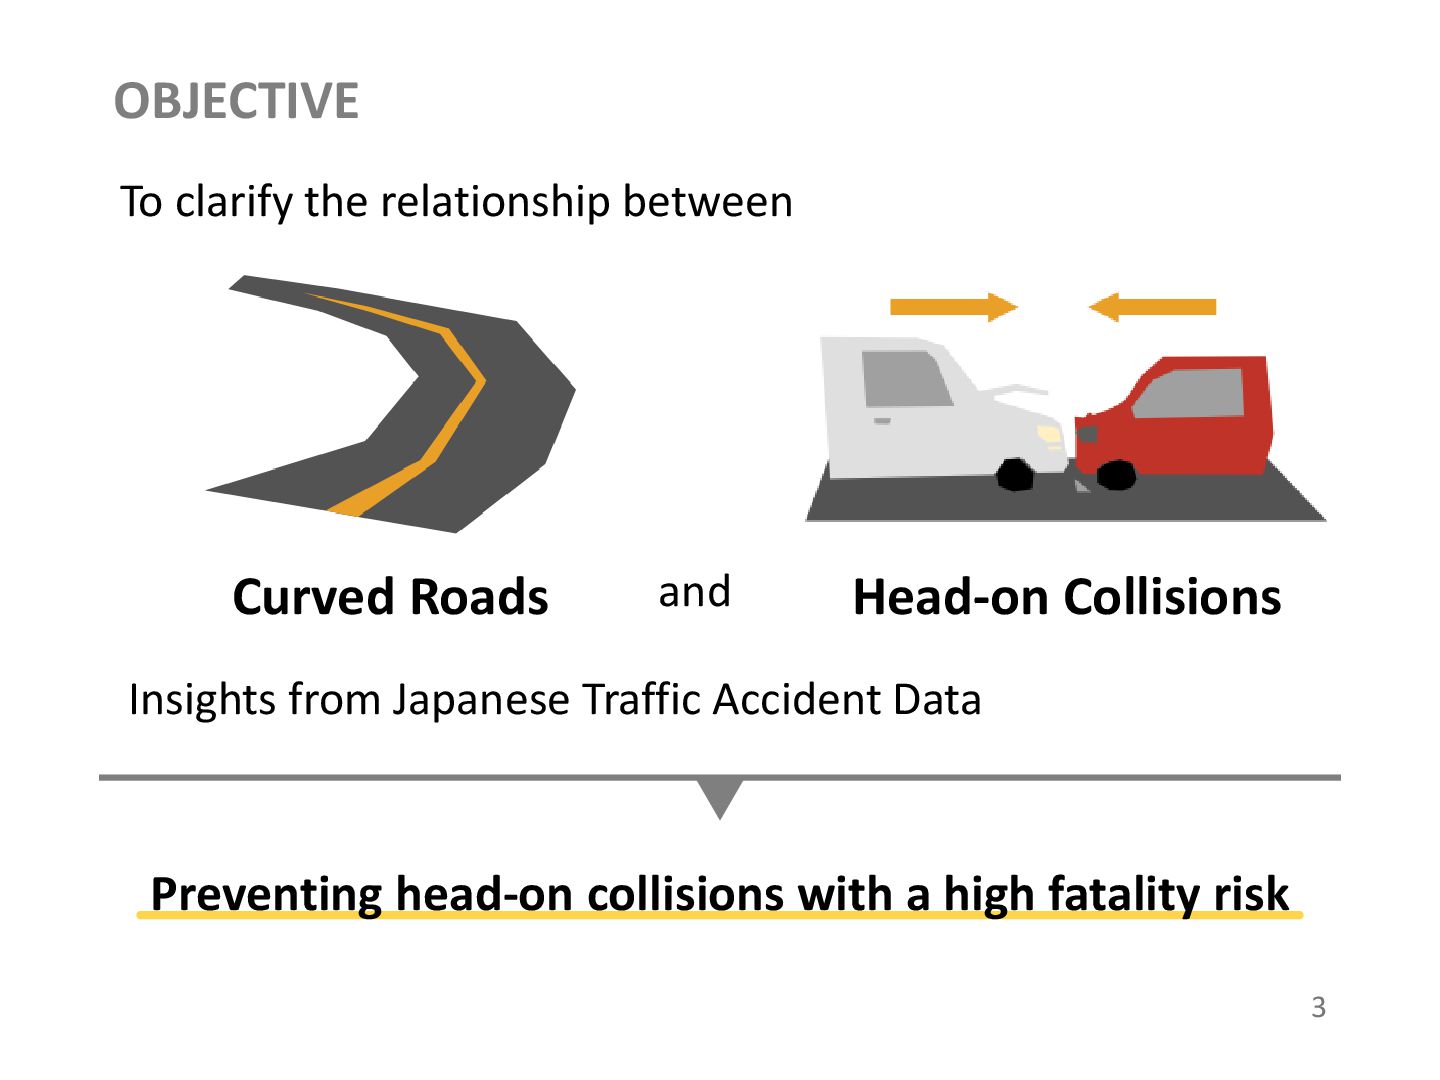
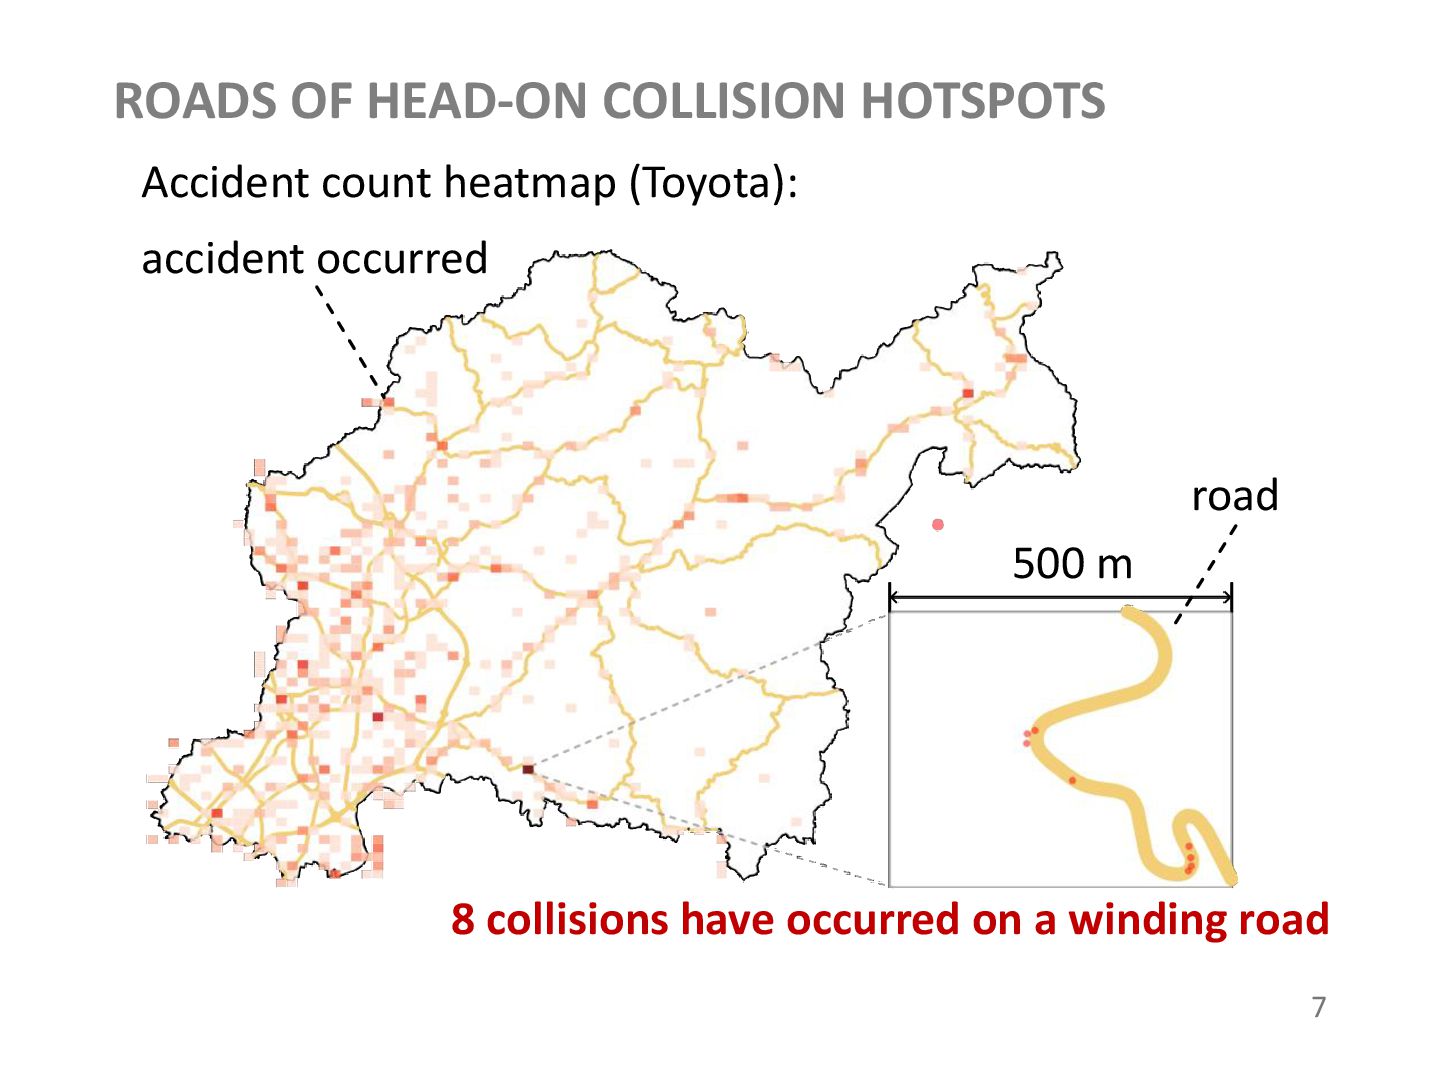
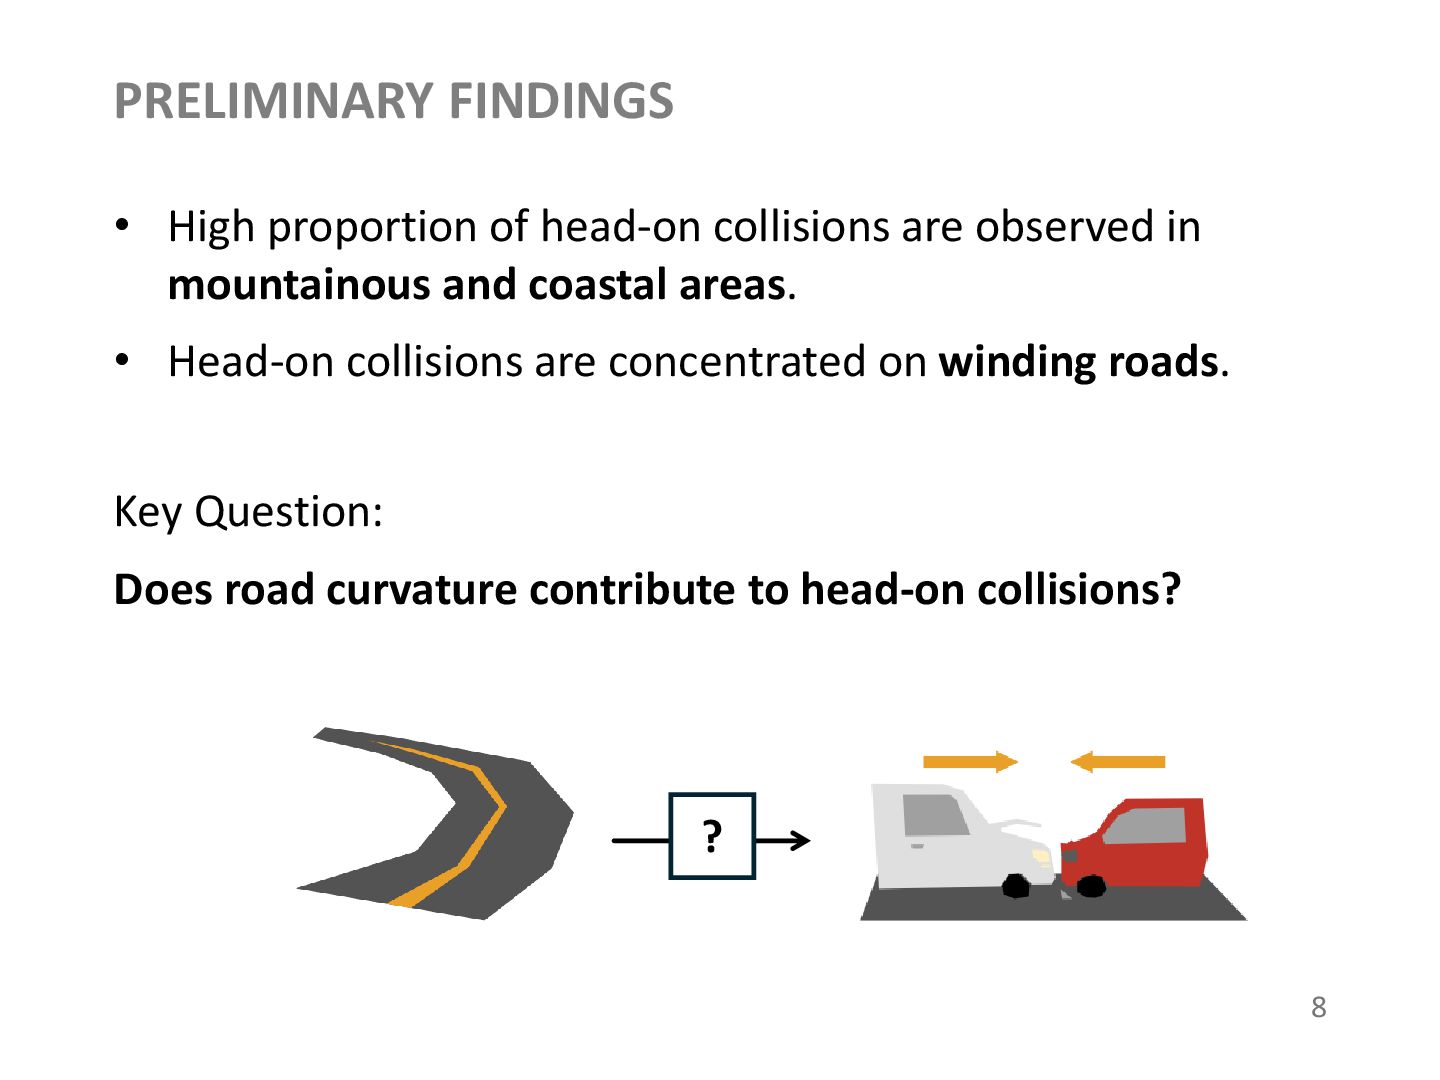
in mountainous and coastal areas. • Head-on collisions are concentrated on winding roads. Does road curvature contribute to head-on collisions? ? Key Question: 8
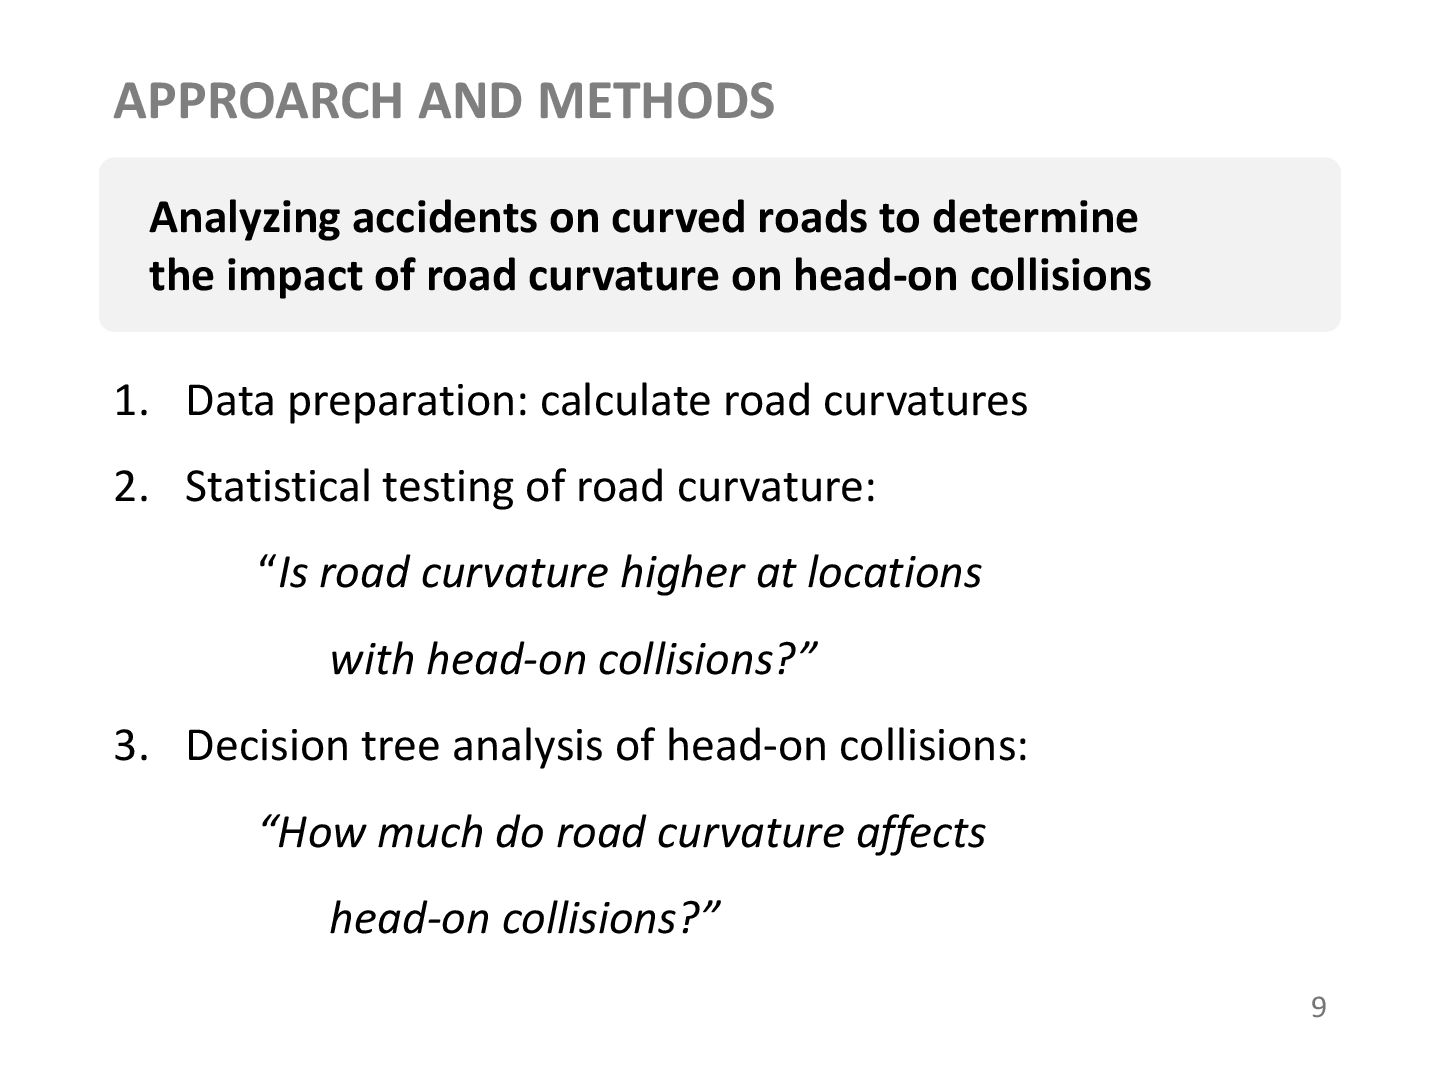
road curvature on head-on collisions APPROARCH AND METHODS 1. Data preparation: calculate road curvatures 2. Statistical testing of road curvature: “Is road curvature higher at locations with head-on collisions?” 3. Decision tree analysis of head-on collisions: “How much do road curvature affects head-on collisions?” 9
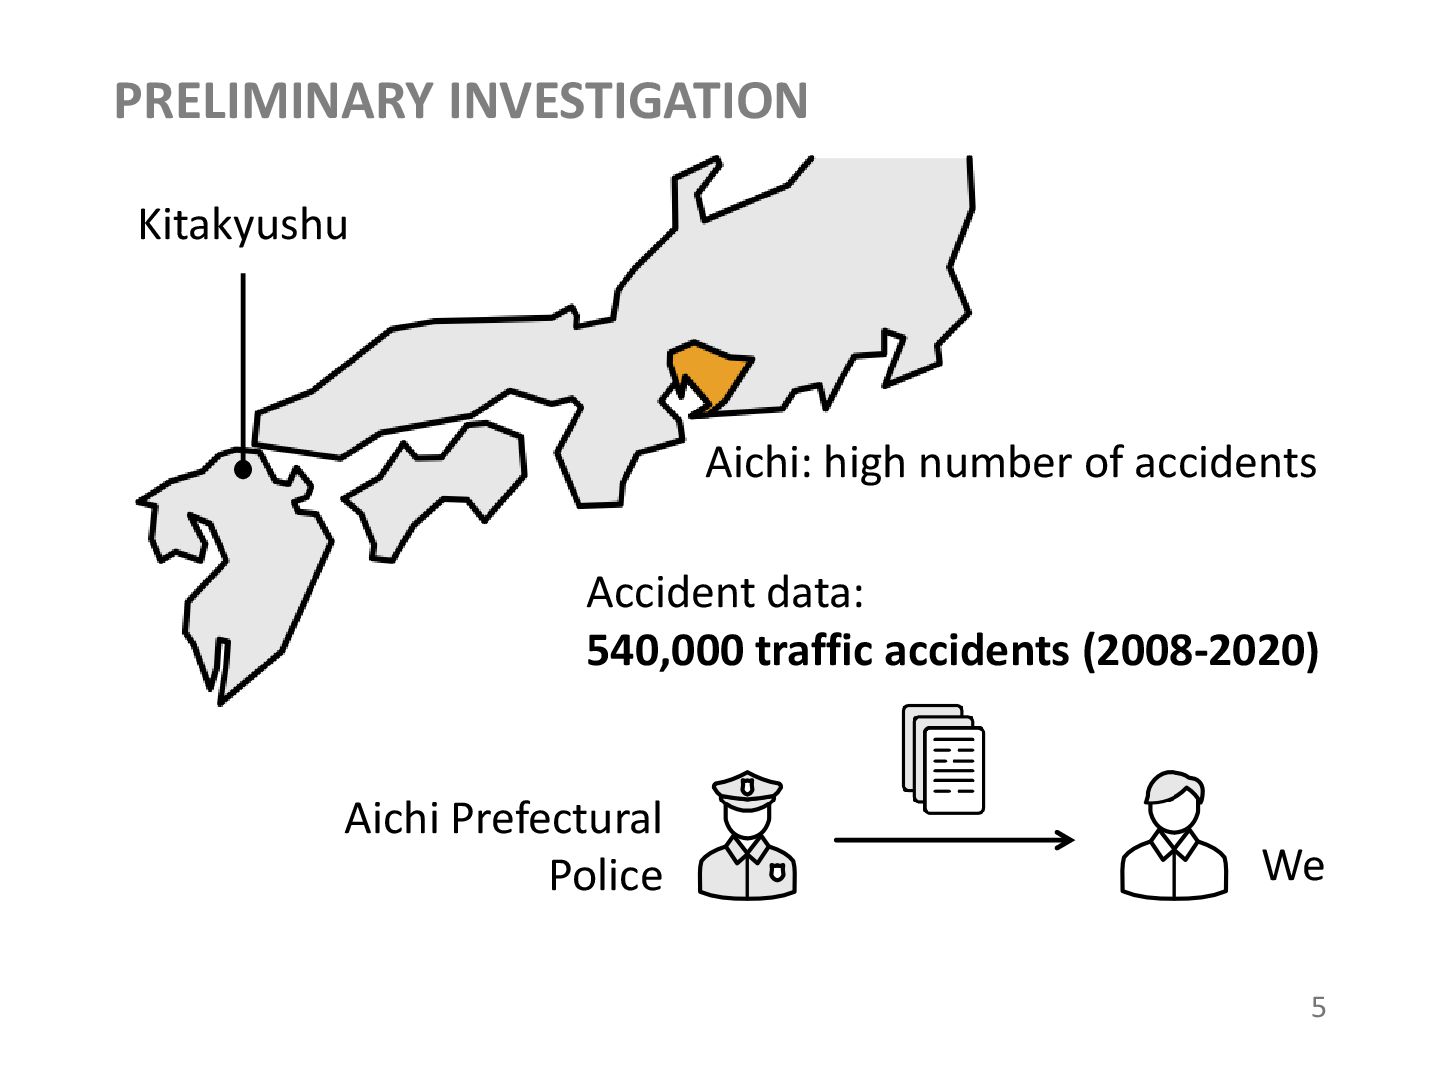
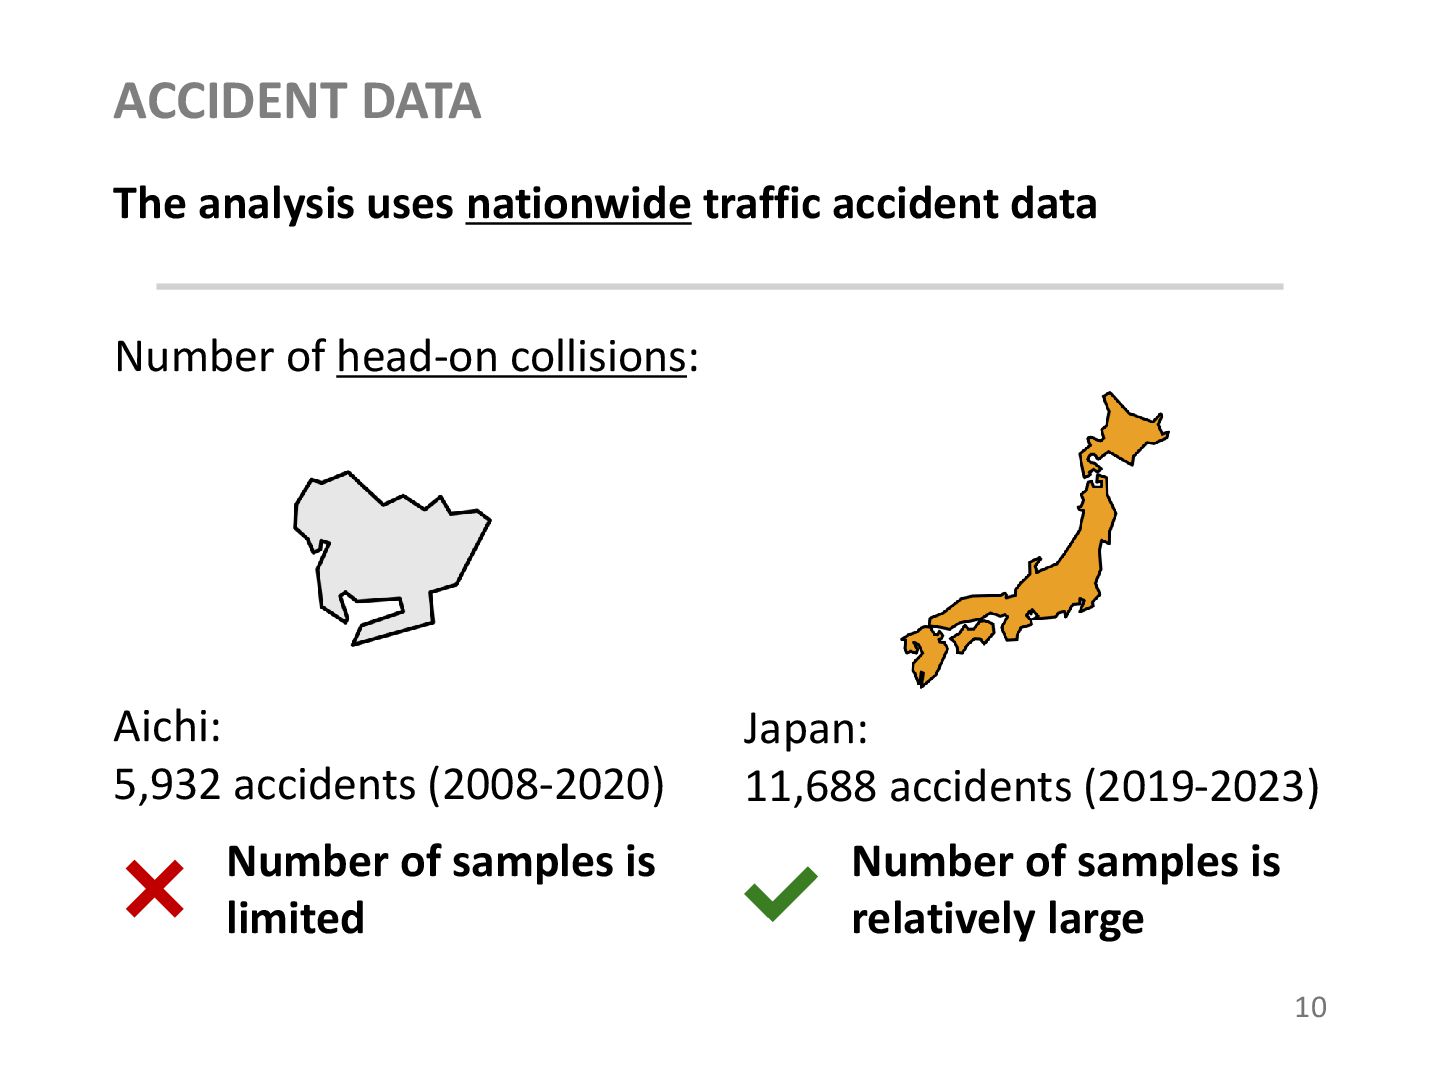
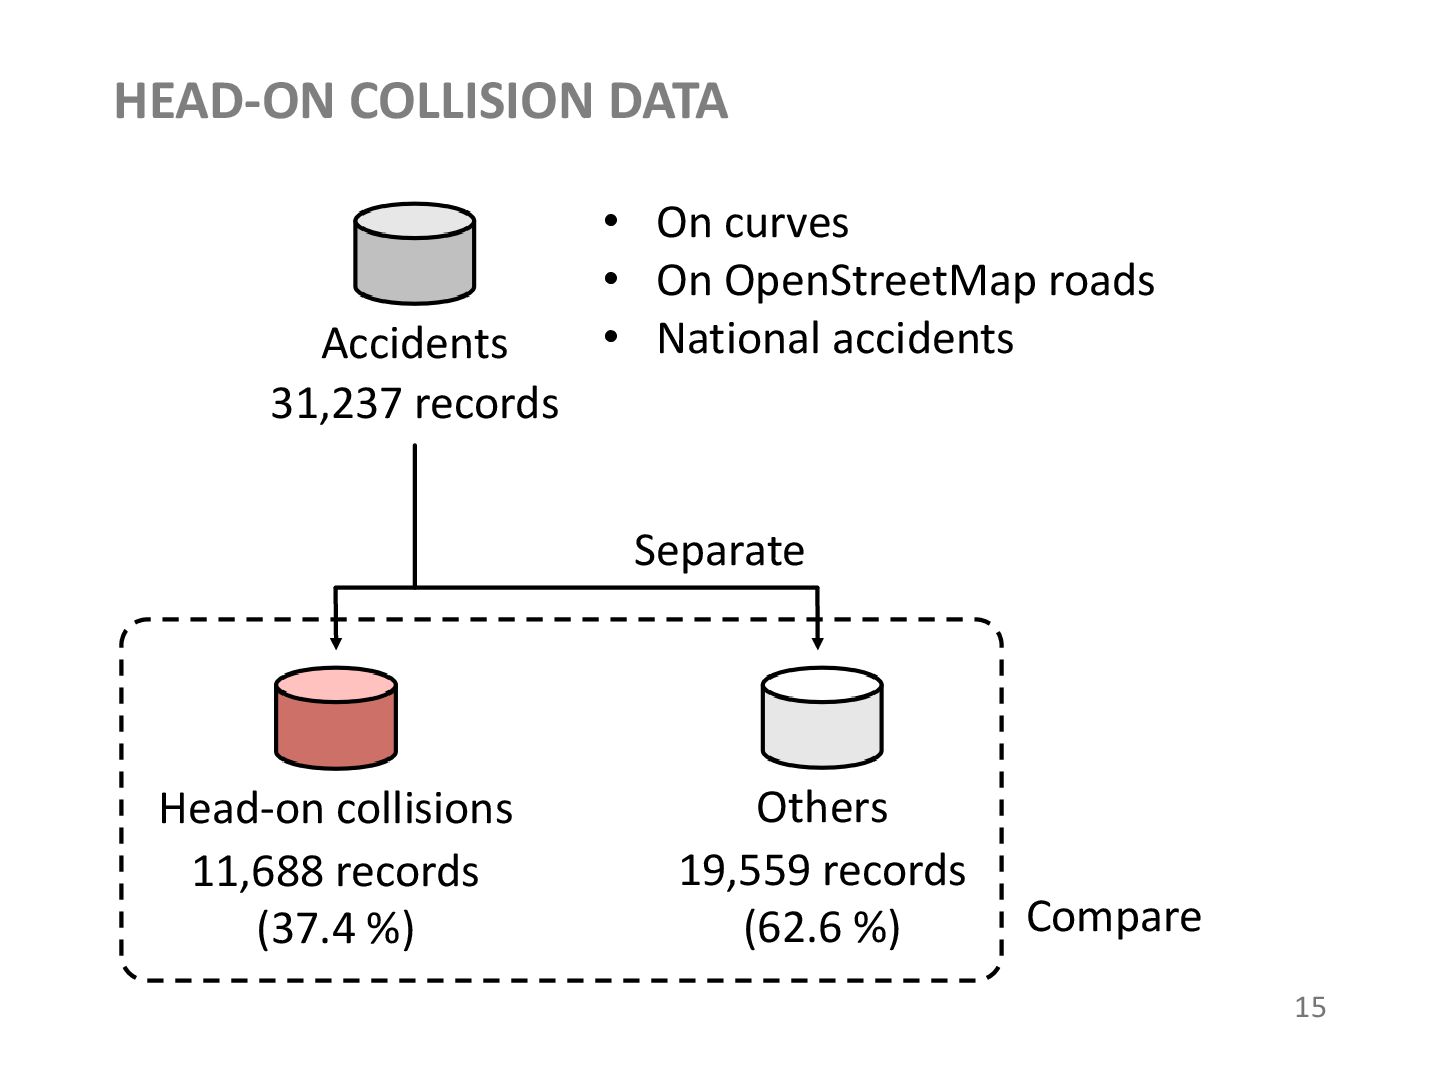
Number of samples is limited Japan: 11,688 accidents (2019-2023) The analysis uses nationwide traffic accident data Number of samples is relatively large 10
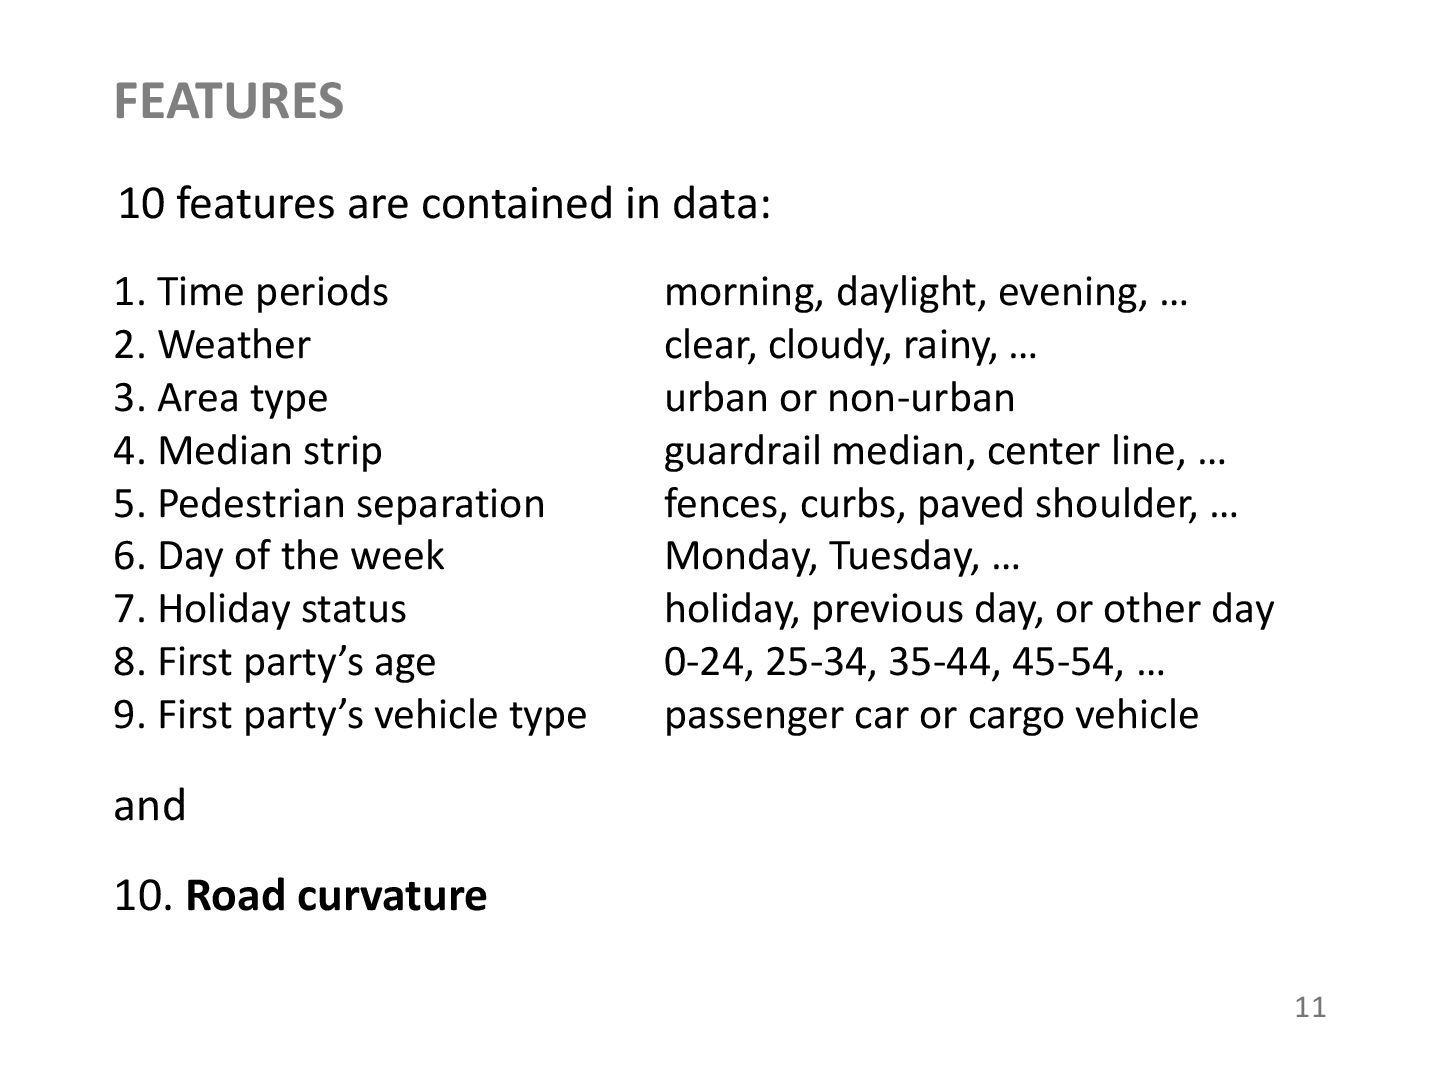
clear, cloudy, rainy, … 3. Area type urban or non-urban 4. Median strip guardrail median, center line, … 5. Pedestrian separation fences, curbs, paved shoulder, … 6. Day of the week Monday, Tuesday, … 7. Holiday status holiday, previous day, or other day 8. First party’s age 0-24, 25-34, 35-44, 45-54, … 9. First party’s vehicle type passenger car or cargo vehicle 11 10 features are contained in data: 10. Road curvature and
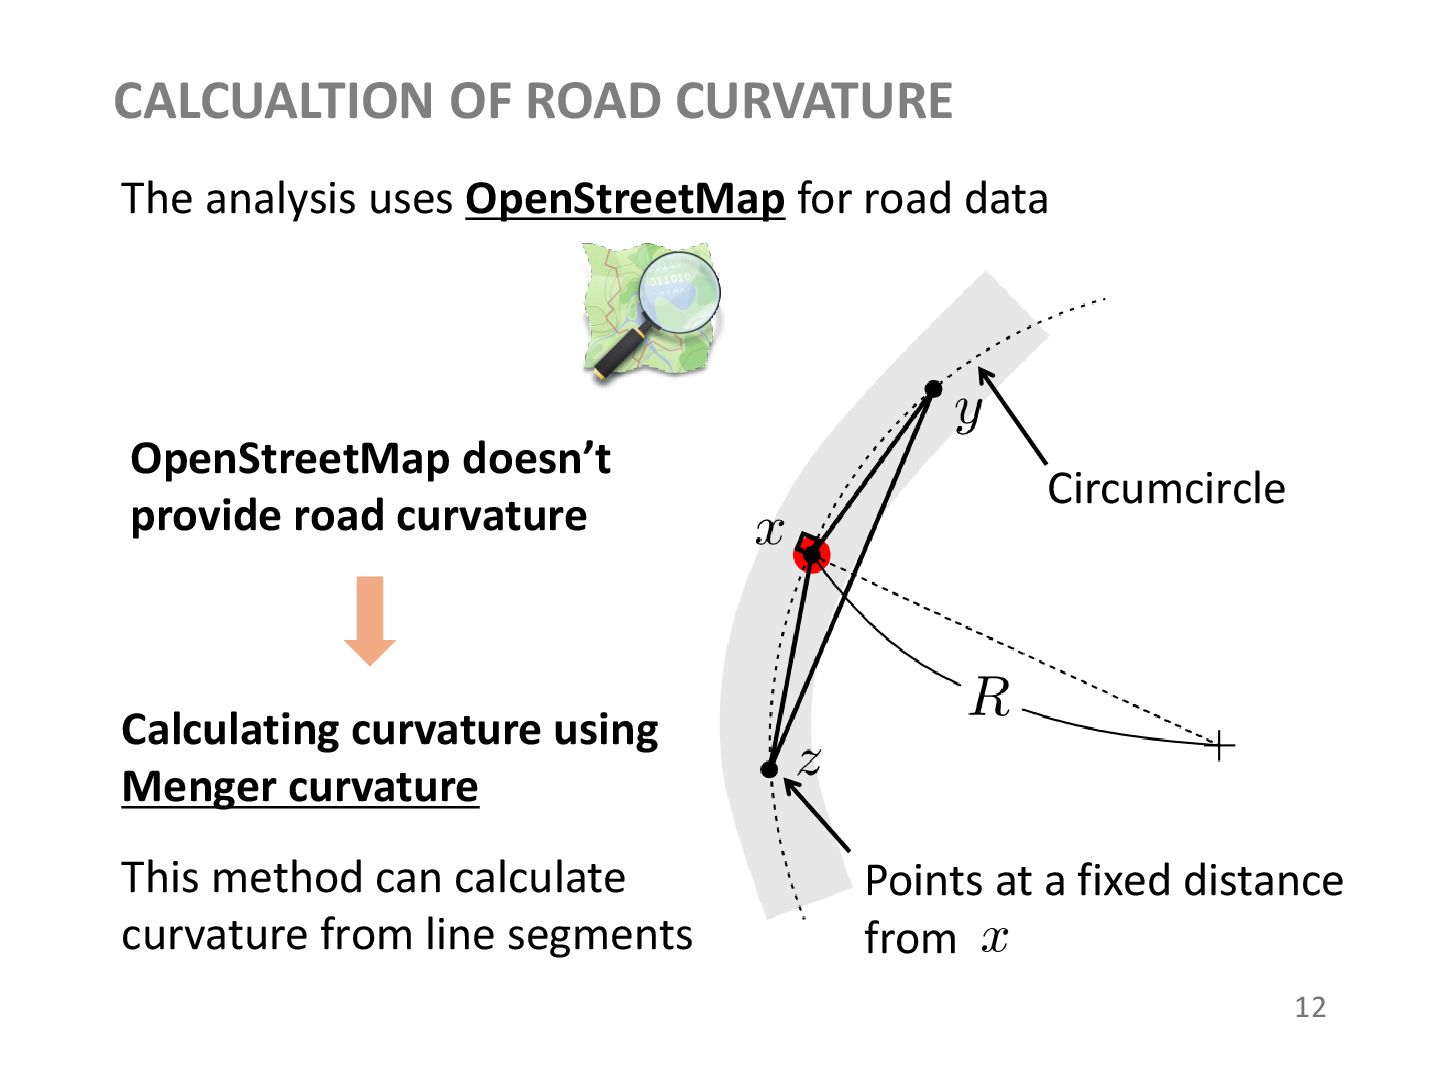
from The analysis uses OpenStreetMap for road data Calculating curvature using Menger curvature This method can calculate curvature from line segments OpenStreetMap doesn’t provide road curvature 12
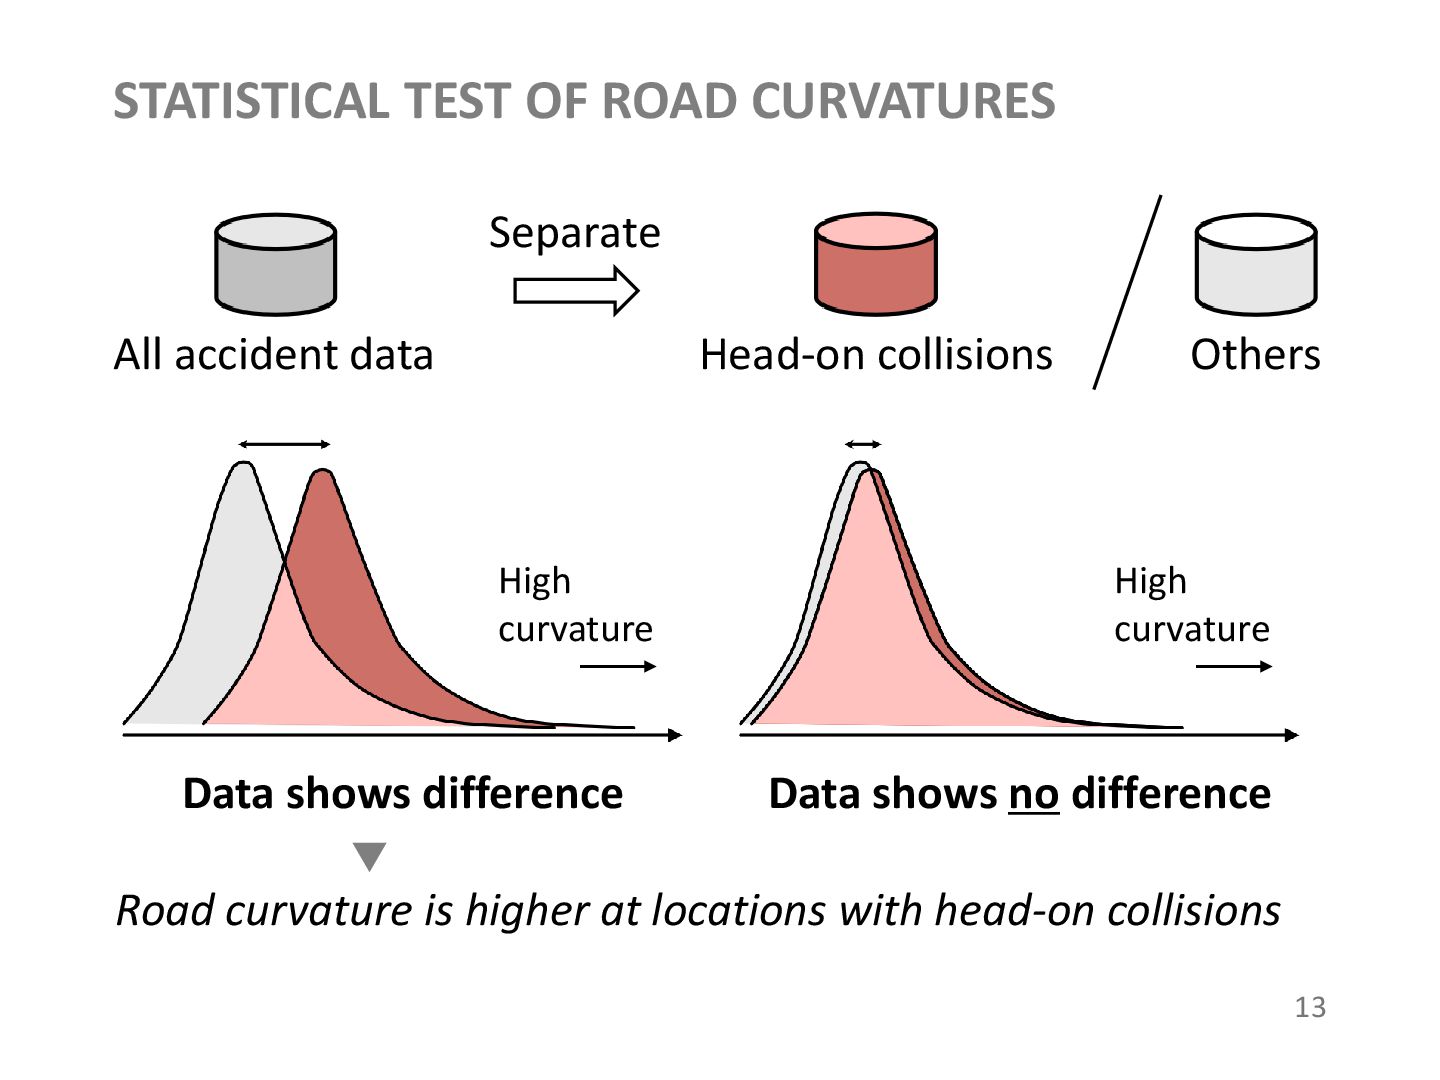
Others Separate Data shows difference Data shows no difference Road curvature is higher at locations with head-on collisions High curvature High curvature 13
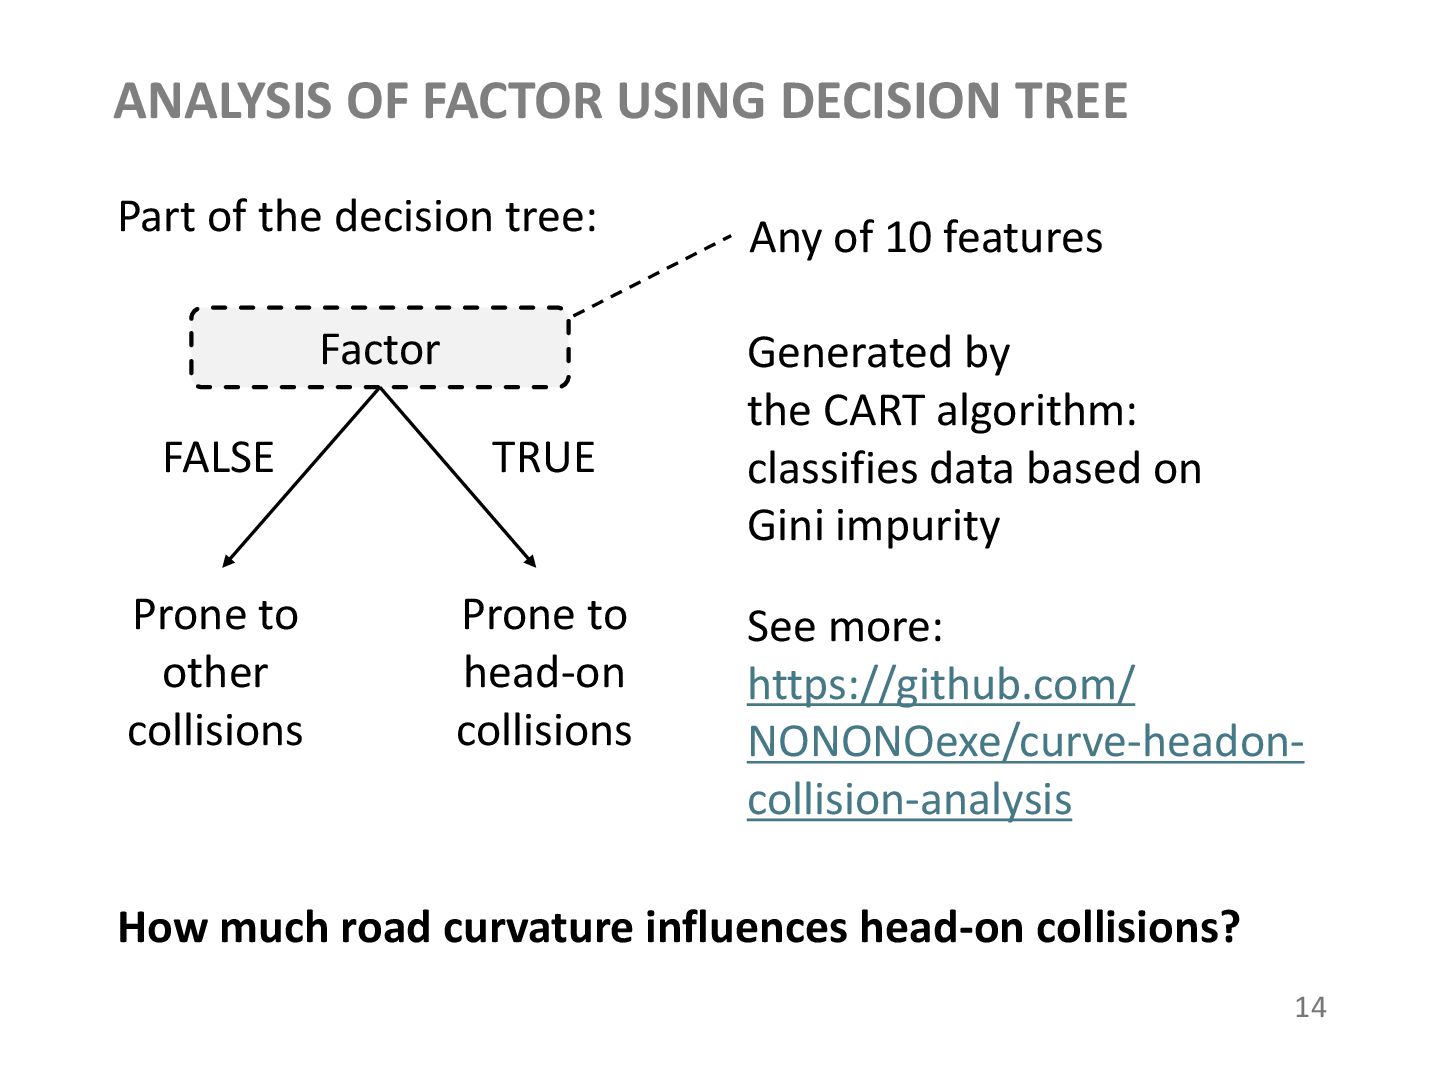
decision tree: How much road curvature influences head-on collisions? TRUE FALSE 14 Any of 10 features Generated by the CART algorithm: classifies data based on Gini impurity See more: https://github.com/ NONONOexe/curve-headon- collision-analysis Prone to other collisions Prone to head-on collisions
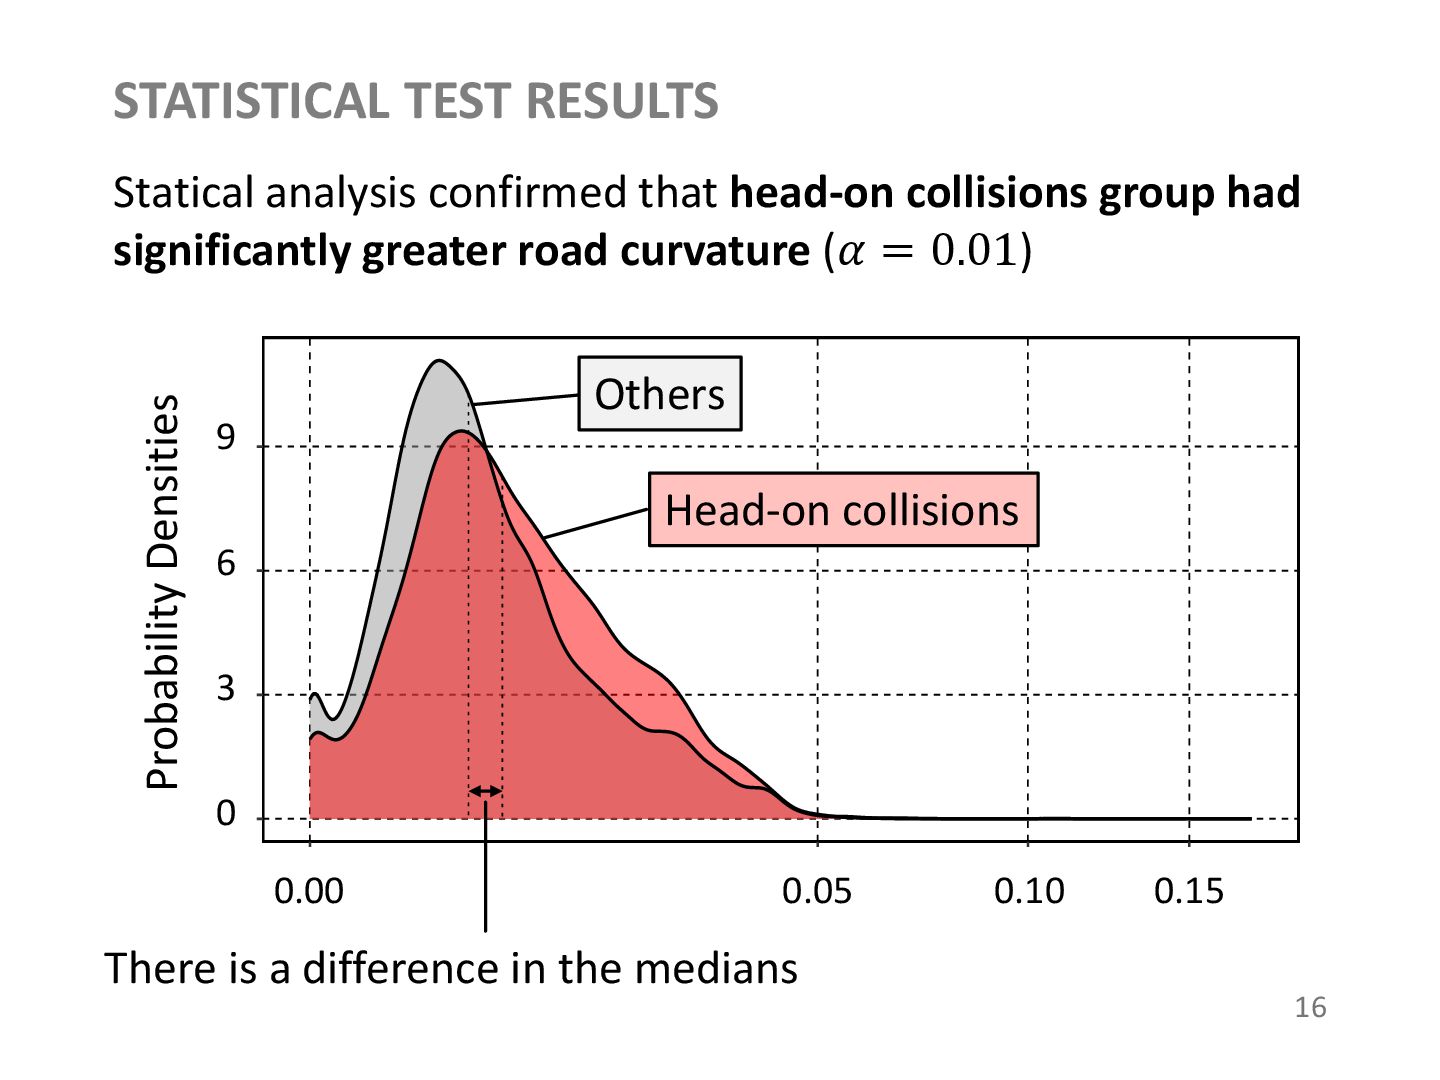
0.05 0.10 0.15 Others Head-on collisions Statical analysis confirmed that head-on collisions group had significantly greater road curvature (𝛼 = 0.01) There is a difference in the medians 16
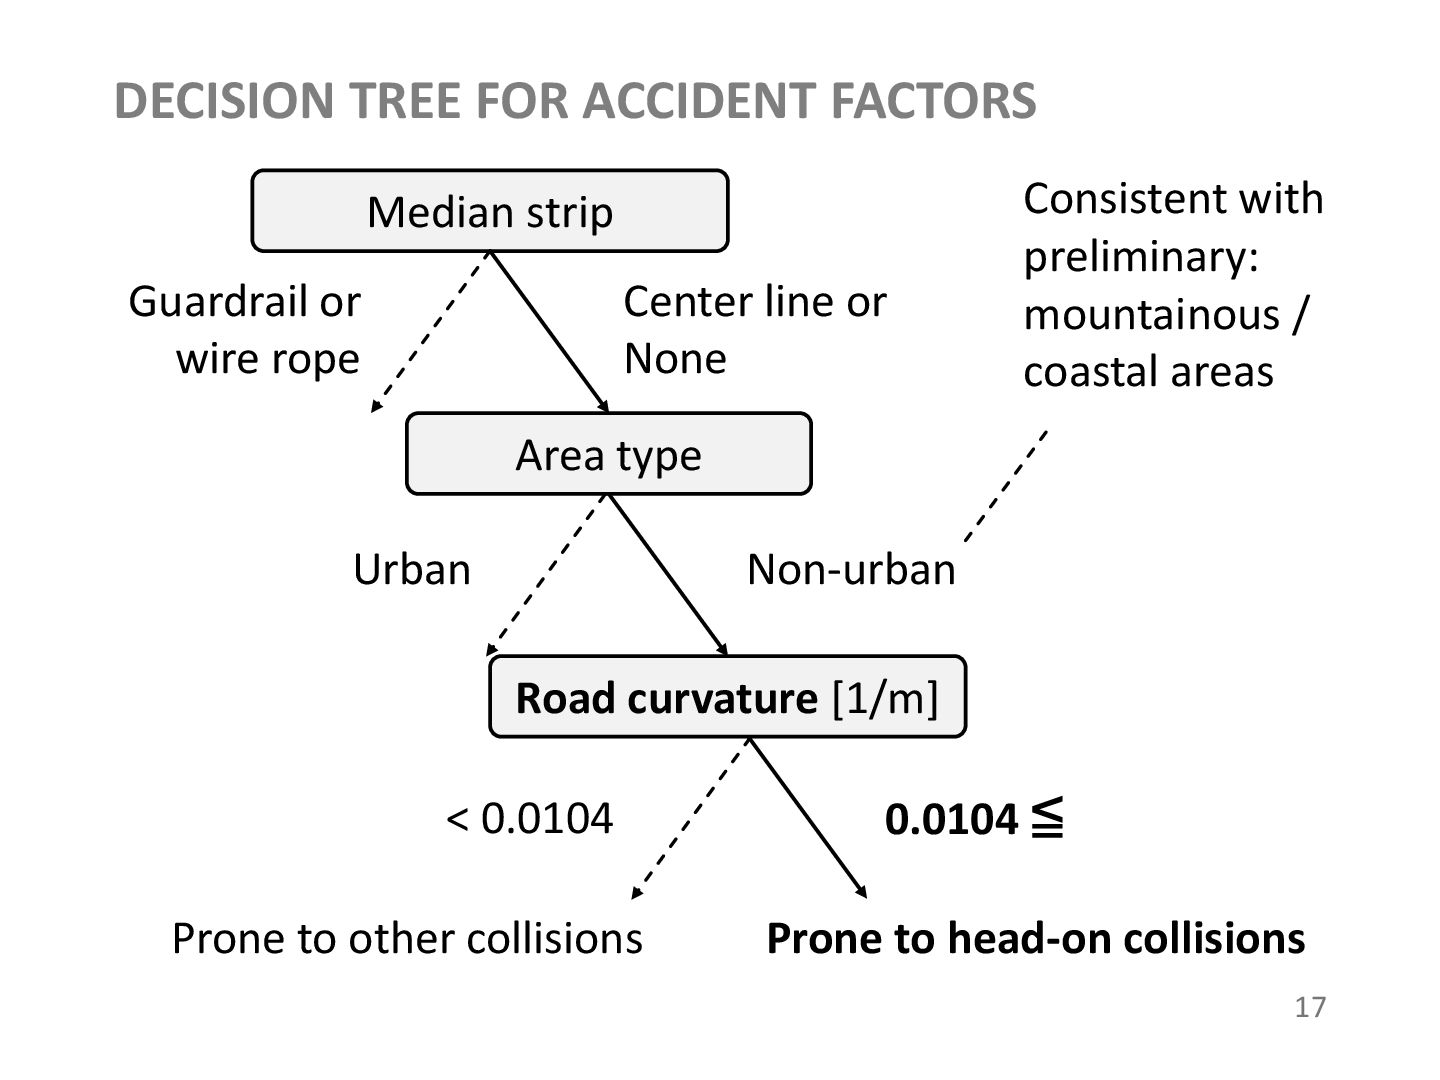
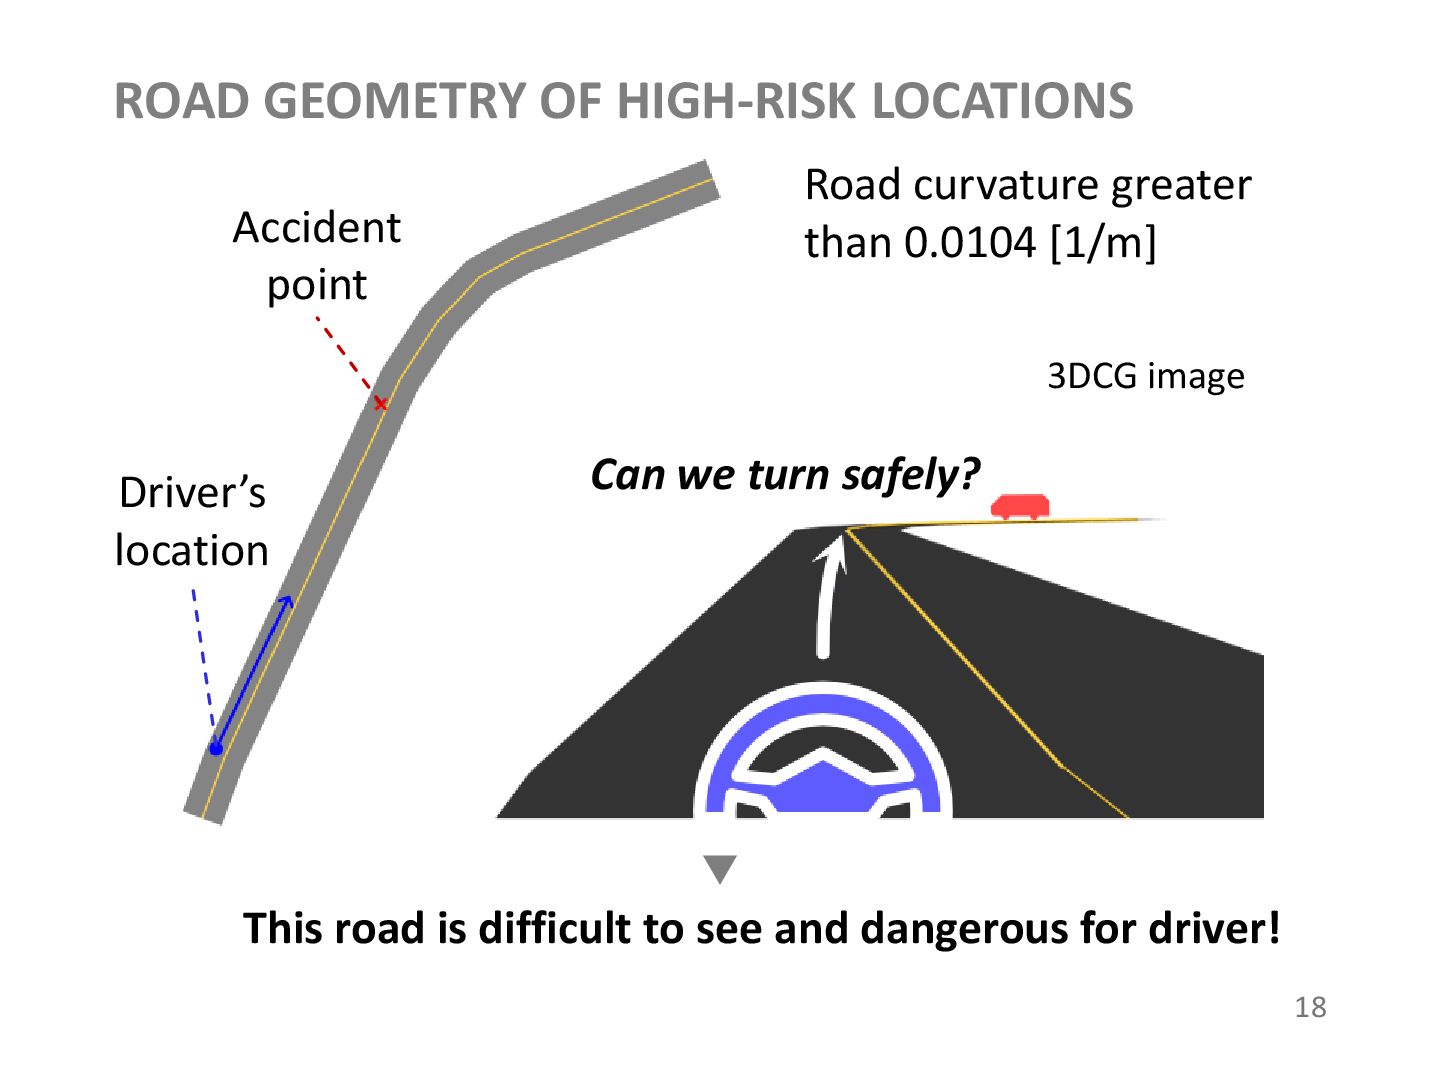
coastal areas Median strip Area type Road curvature [1/m] Center line or None Non-urban Guardrail or wire rope Urban 0.0104 ≦ < 0.0104 Prone to head-on collisions Prone to other collisions 17
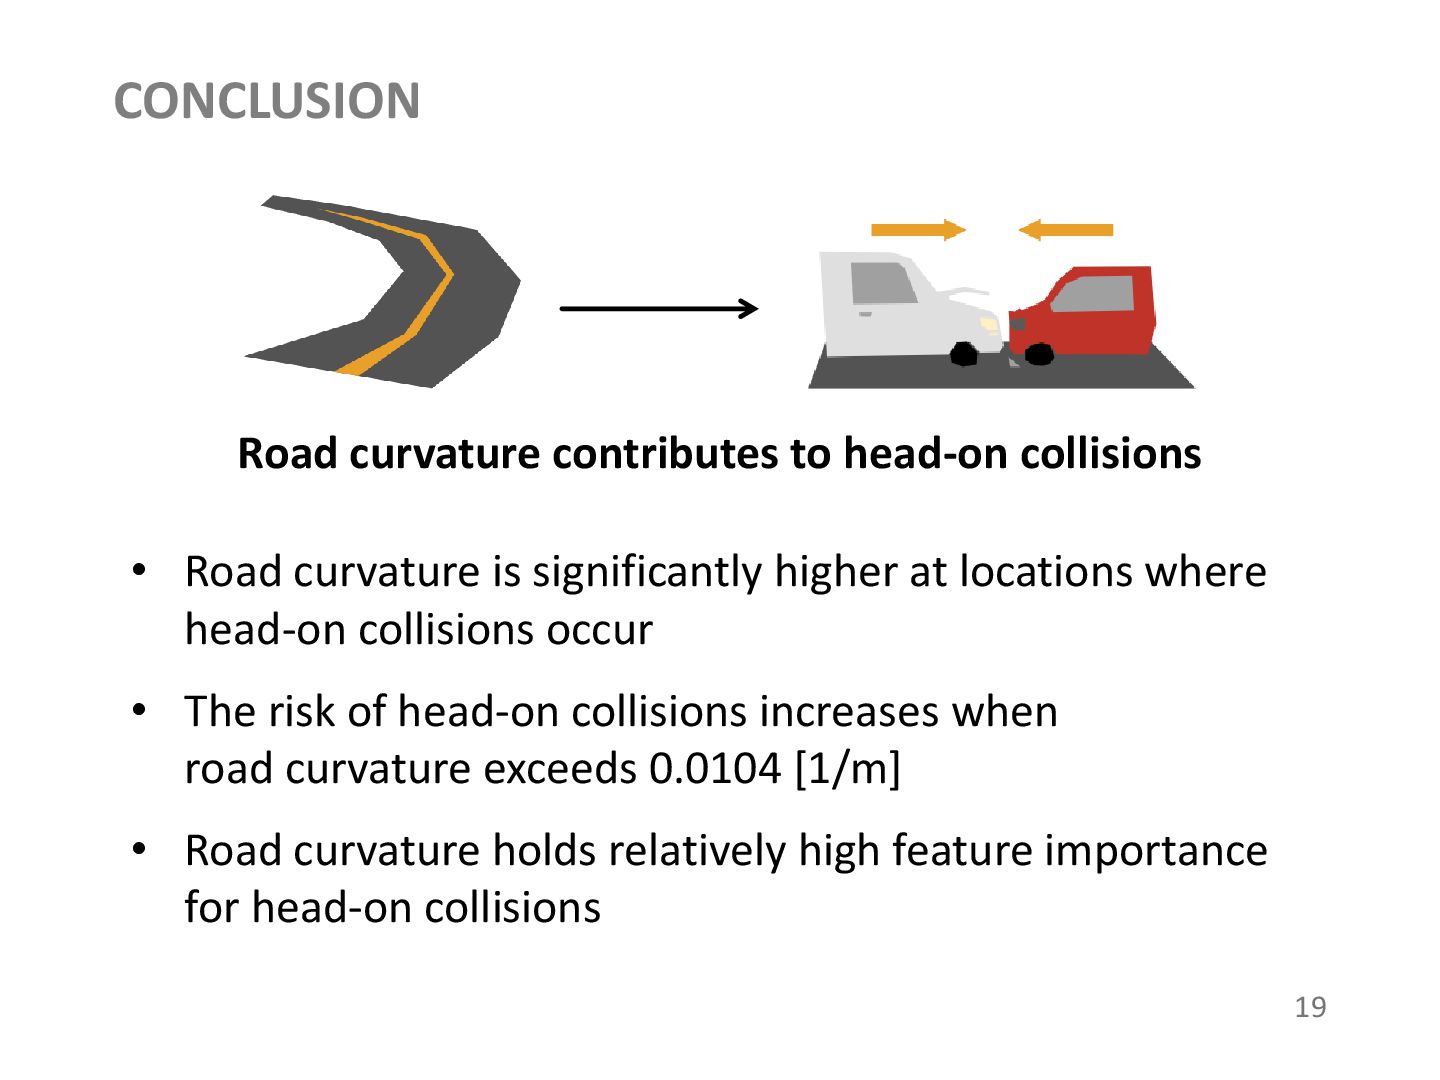
is significantly higher at locations where head-on collisions occur • The risk of head-on collisions increases when road curvature exceeds 0.0104 [1/m] • Road curvature holds relatively high feature importance for head-on collisions 19
and road curvature • Preliminary: Revealed head-on collisions are tended to occur on winding roads in Aichi Prefecture • Investigated the relationship using nationwide Japanese data • Statistical tests confirmed that road curvature is significantly greater at head-on collision locations • Decision tree analysis confirmed that road curvature increases the risk of head-on collisions 20