Upgrade to Pro — share decks privately, control downloads, hide ads and more …

Democratizing Data

Democratizing Data

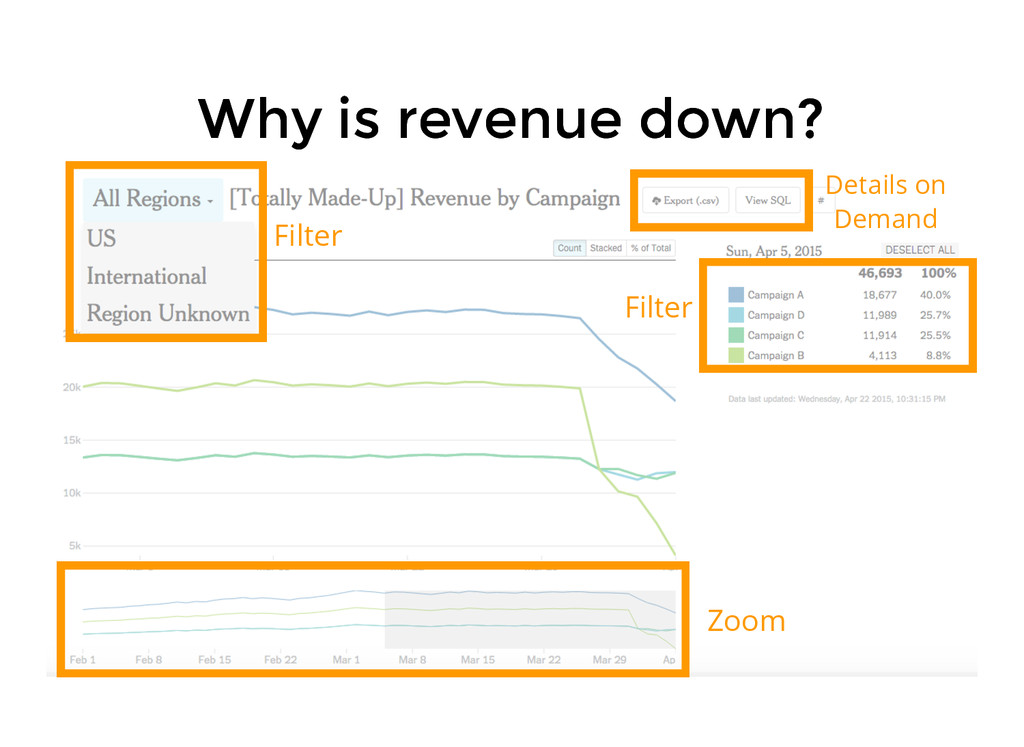
Charles Guthrie, data visualization engineer, talk about making The New York Times more data-driven by expanding access to internal data through simple visualization tools.

(Presented at the Data Visualization Innovation Summit)

More Decks by The New York Times Developers

Other Decks in Design

Transcript

  1. How are we doing? From: Advertising To: Analysts select date,

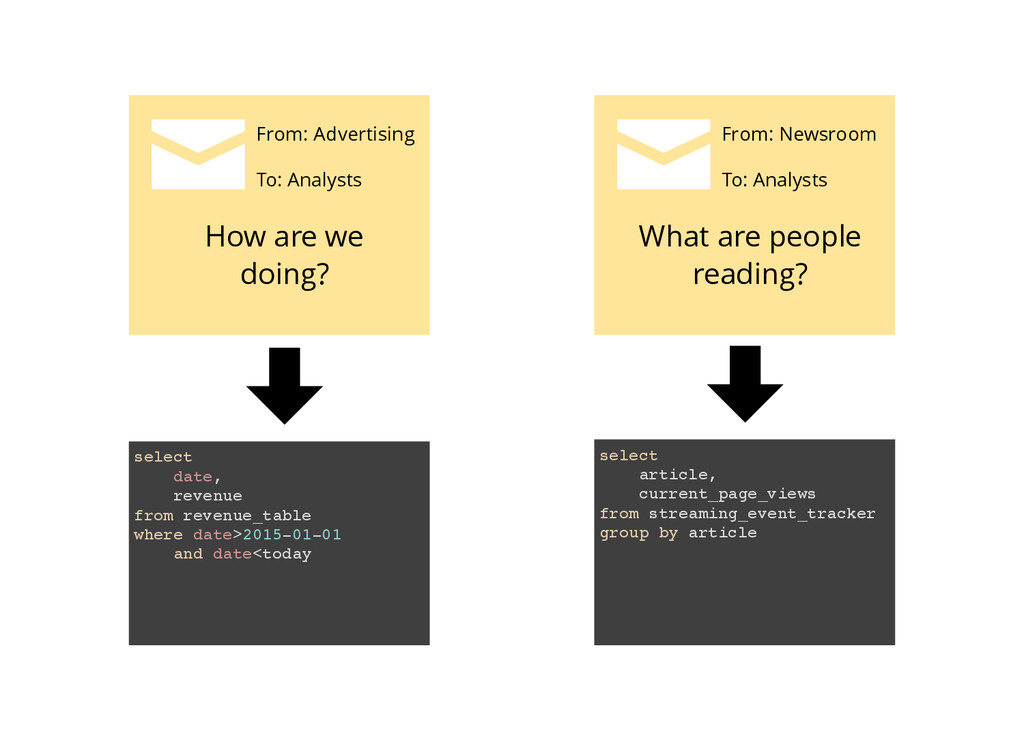
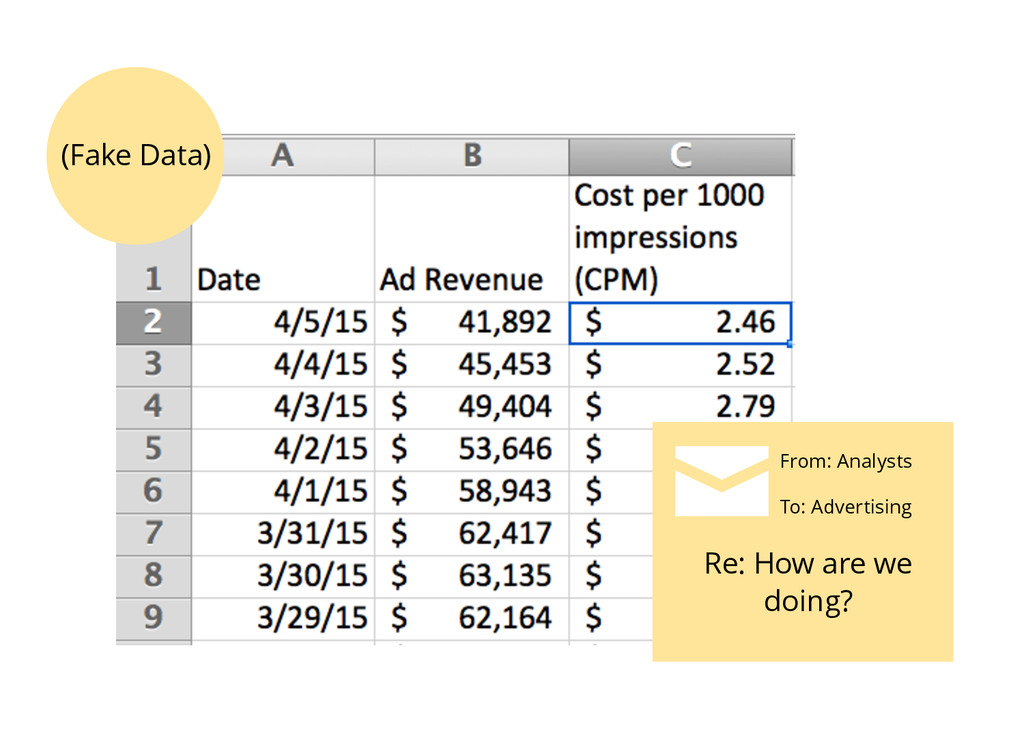
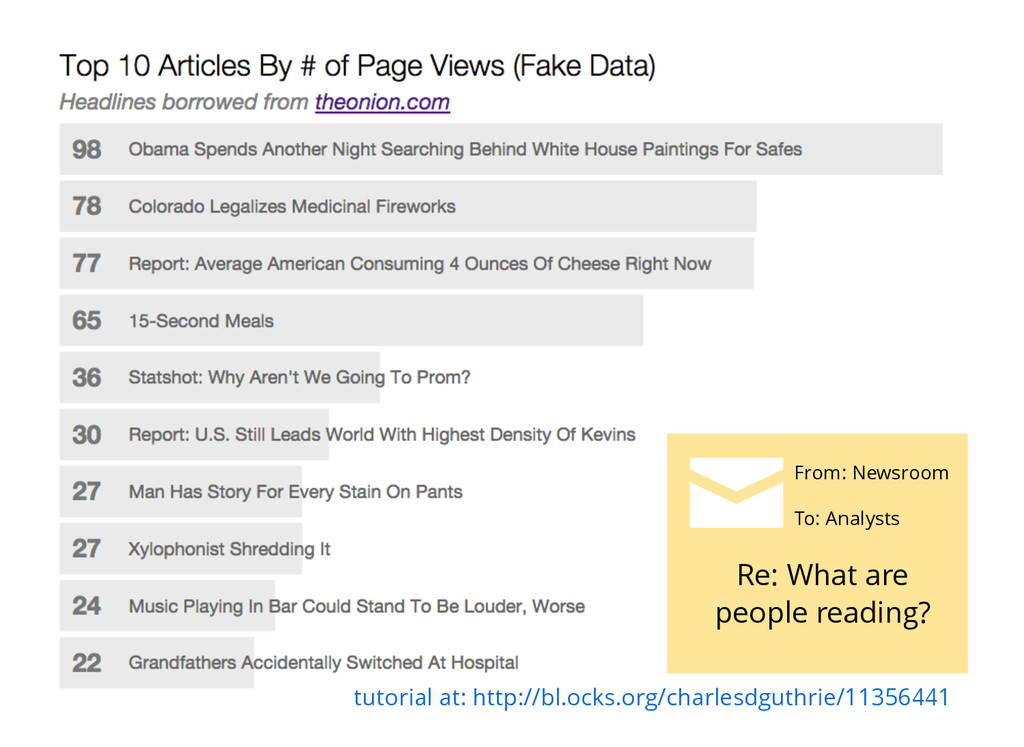
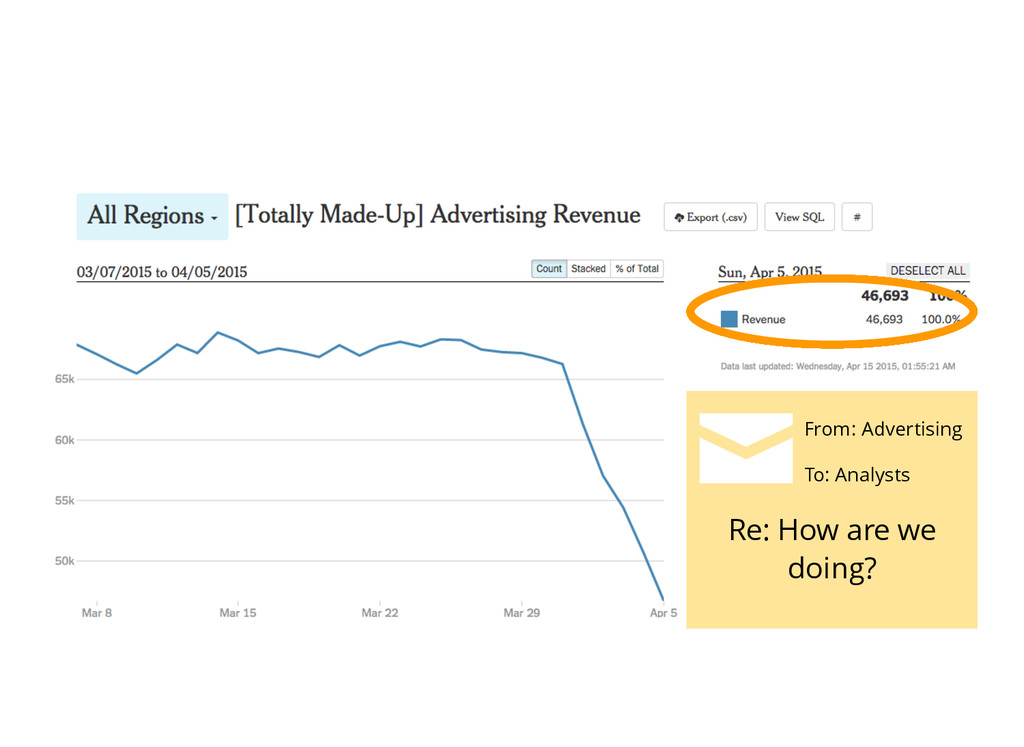
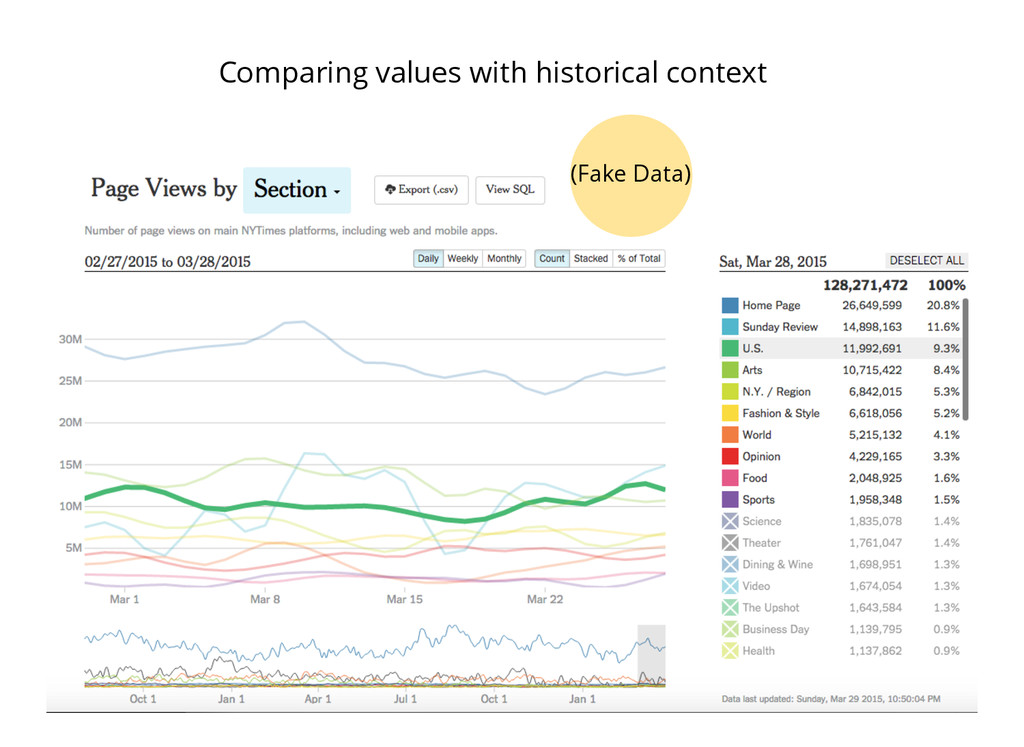
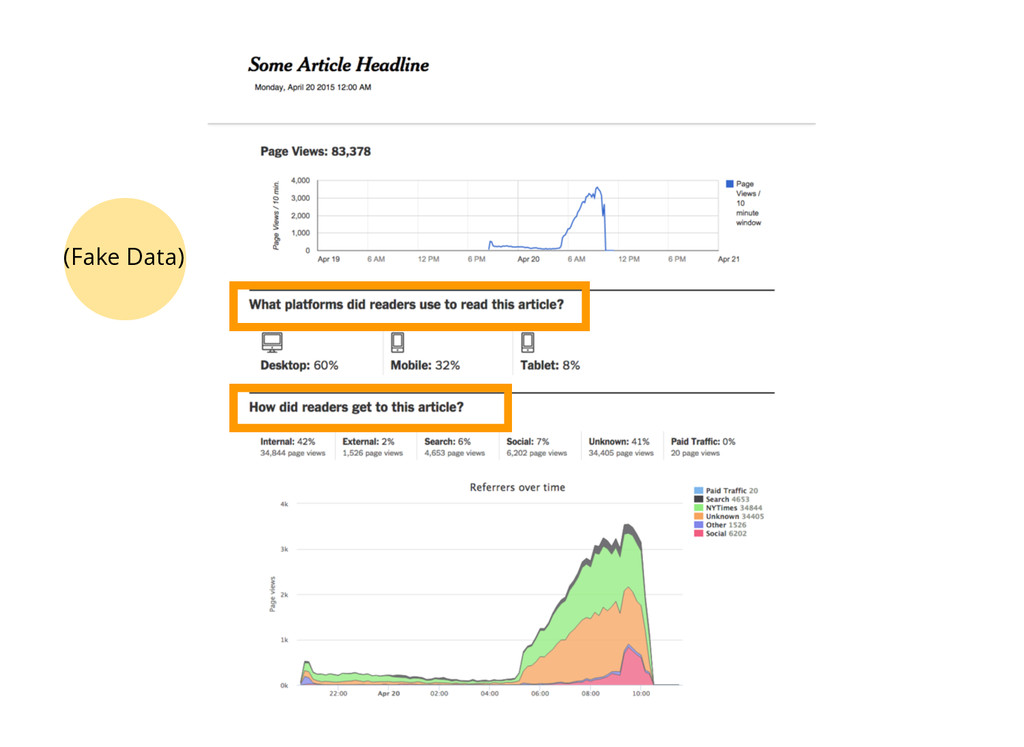
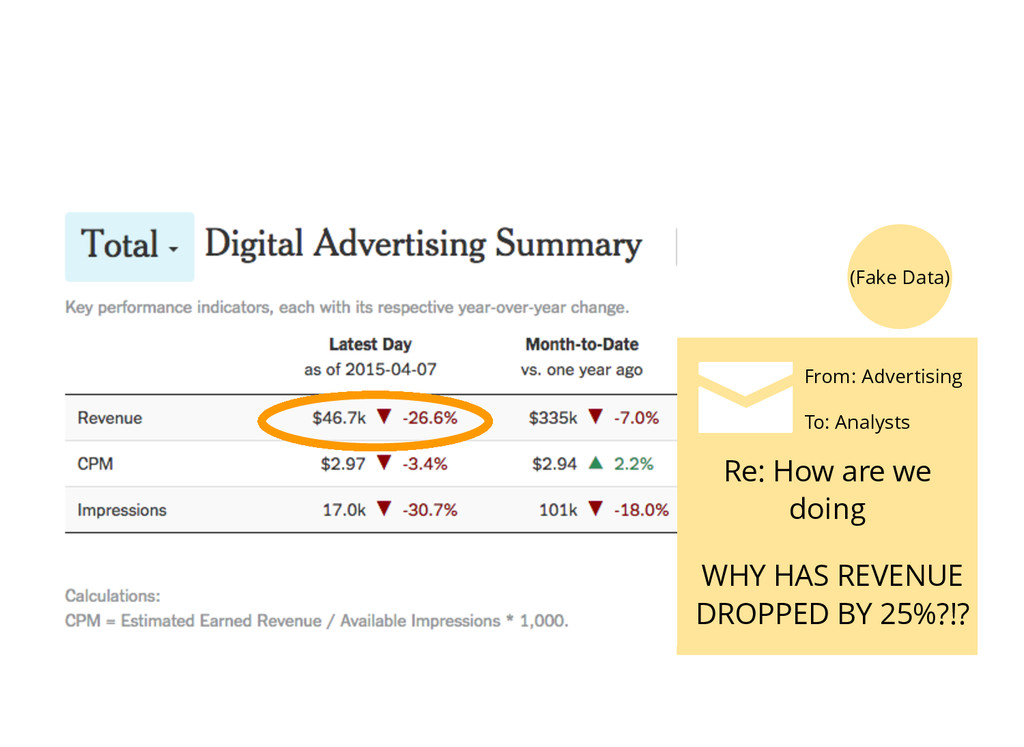
    revenue from revenue_table where date>2015-01-01 and date<today What are people reading? From: Newsroom To: Analysts select article, current_page_views from streaming_event_tracker group by article
  2. Meeting Agenda Meeting Agenda "Get on same page" Read every

    bullet on slides out loud Review stuff we already know Tangential conversation with one person
  3. Re: What are people reading? From: Newsroom To: Analysts tutorial

    at: http://bl.ocks.org/charlesdguthrie/11356441
  4. How are we doing? From: Advertising To: Analysts Do I

    need to be worried? How are we doing?
  5. relationships between two variables trends and changes; historical context simple

    comparisons comparisons with historical context Multi-Line Chart Multi-Line Chart
  6. Nothing to tell Nothing to tell Do I need to

    be worried? From: Advertising To: Analysts
  7. Overview first, Overview first, zoom and filter, zoom and filter,

    then details-on-demand then details-on-demand - Ben Shneiderman - Ben Shneiderman
  8. Election: How close is it? Election: How close is it?

    http://elections.nytimes.com/2014/results/senate?utm_source=top_nav&utm_medium=web&utm_campaign=election-2014
  9. Data, Democratized Data, Democratized Page Views Visitors Homepage stats Products

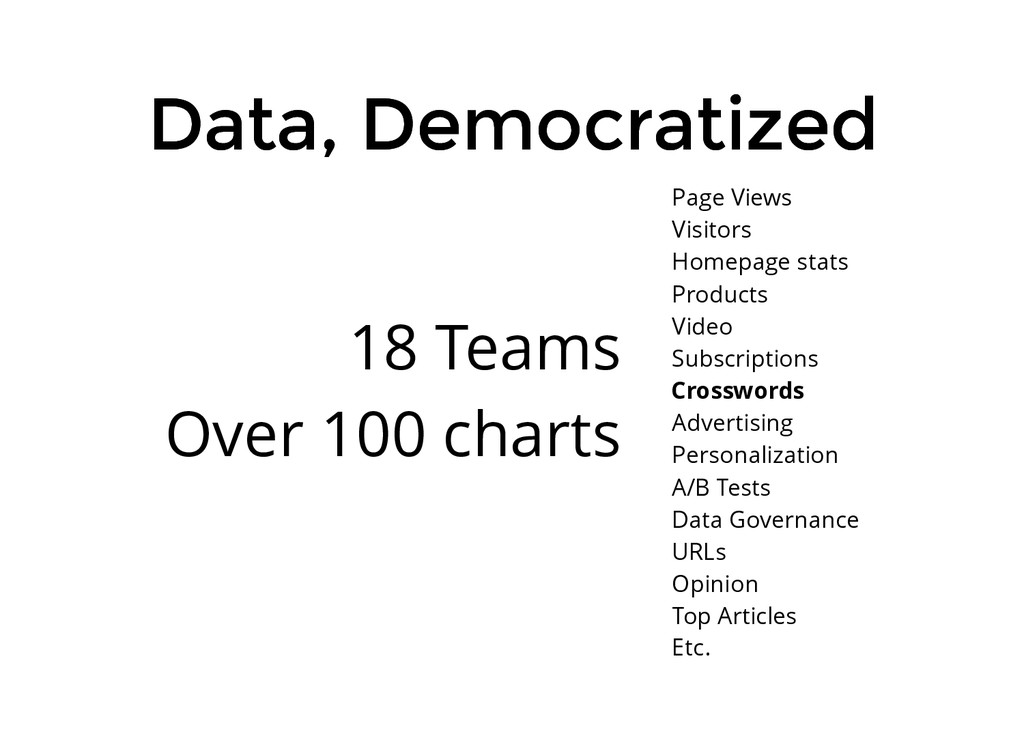
    Video Subscriptions Crosswords Advertising Personalization A/B Tests Data Governance URLs Opinion Top Articles Etc. 18 Teams Over 100 charts Crosswords
  10. Freed up for more advanced problems Building out more tools

    Use data rather than intuition More insightful questions Analysts Stakeholders
  11. Things we Learned Things we Learned Answer the main question

    first Pick the right chart - or no chart Zoom and filter for followup questions