A look at the history of open source monitoring tools, an attempt at fixing our vocabulary within monitoring, and a proposal for the "event stream model" as the future of open source tooling.
a Glimpse Into Our Future The State of Open Source Monitoring: Friday, October 5, 12 John Willis says he’s never seen the asshole element at DevOpsDays. Coincidentally, this is my first visit to DevOpsDays. Who here thinks monitoring sucks? Ok, this talk is not for you. I want to talk to people who love monitoring and want to make it better. After the end of this talk today I hope that we’ve started a new discussion around monitoring and the guys who come after me need to update their slides.
I live in Westminster MD in the USA. It’s in the middle of the country. You can drive out of our street and take the wrong turn and end up in a cornfield. But that’s ok because we have a Chipotle in town. Does everyone know what Chipotle is?
a hard-core UNIX SysAdmin like a lot of you, but I found that I’m really passionate about monitoring and visualization. So that’s what I specialize in these days. I’ve coined the term "VizOps", which is basically what I do to try and improve the state of visualization in Web Operations.
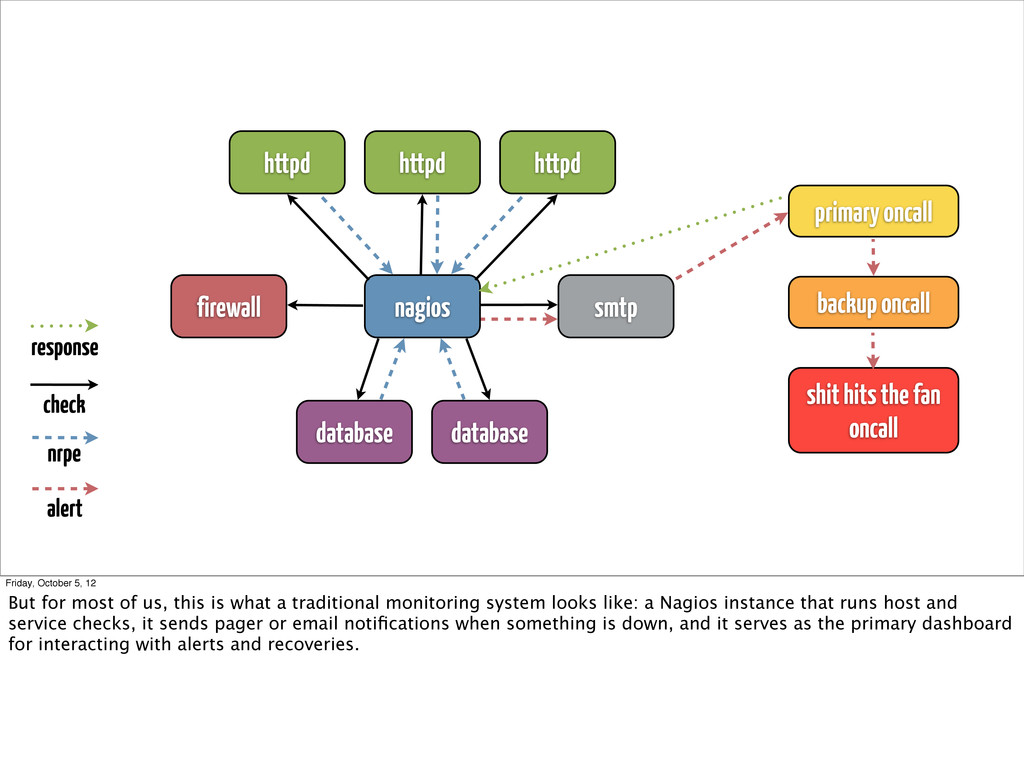
alert primary oncall backup oncall shit hits the fan oncall response Friday, October 5, 12 But for most of us, this is what a traditional monitoring system looks like: a Nagios instance that runs host and service checks, it sends pager or email notifications when something is down, and it serves as the primary dashboard for interacting with alerts and recoveries.
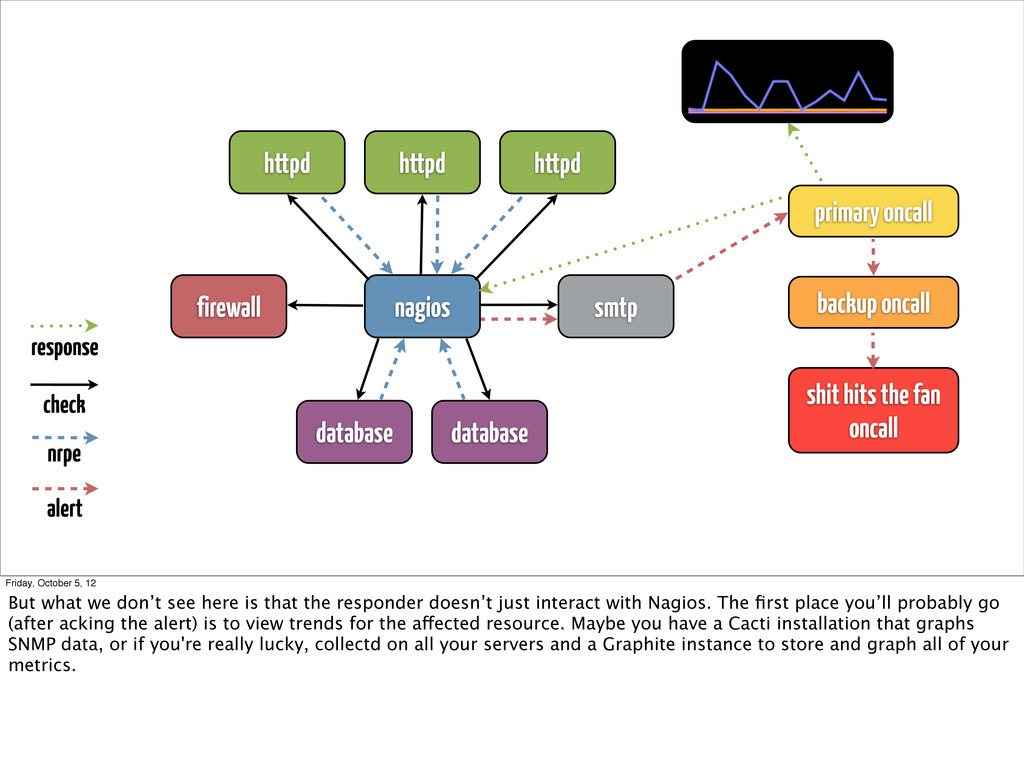
alert primary oncall backup oncall shit hits the fan oncall response Friday, October 5, 12 But what we don’t see here is that the responder doesn’t just interact with Nagios. The first place you’ll probably go (after acking the alert) is to view trends for the affected resource. Maybe you have a Cacti installation that graphs SNMP data, or if you're really lucky, collectd on all your servers and a Graphite instance to store and graph all of your metrics.
a lot to generalize about the different features and components that make up our monitoring and trending systems. I think when most people use it though they're generally referring to fault detection and notifications, but I've also heard it used to describe metrics collection, trending, capacity planning, and even business analytics.
“monitoring” used a lot to generalize about the different features and components that make up our monitoring and trending systems. I think when most people use it though they're generally referring to fault detection and notifications, but I've also heard it used to describe metrics collection, trending, capacity planning, and even business analytics.
the term “monitoring” used a lot to generalize about the different features and components that make up our monitoring and trending systems. I think when most people use it though they're generally referring to fault detection and notifications, but I've also heard it used to describe metrics collection, trending, capacity planning, and even business analytics.
hear the term “monitoring” used a lot to generalize about the different features and components that make up our monitoring and trending systems. I think when most people use it though they're generally referring to fault detection and notifications, but I've also heard it used to describe metrics collection, trending, capacity planning, and even business analytics.
12 I hear the term “monitoring” used a lot to generalize about the different features and components that make up our monitoring and trending systems. I think when most people use it though they're generally referring to fault detection and notifications, but I've also heard it used to describe metrics collection, trending, capacity planning, and even business analytics.
5, 12 I hear the term “monitoring” used a lot to generalize about the different features and components that make up our monitoring and trending systems. I think when most people use it though they're generally referring to fault detection and notifications, but I've also heard it used to describe metrics collection, trending, capacity planning, and even business analytics.
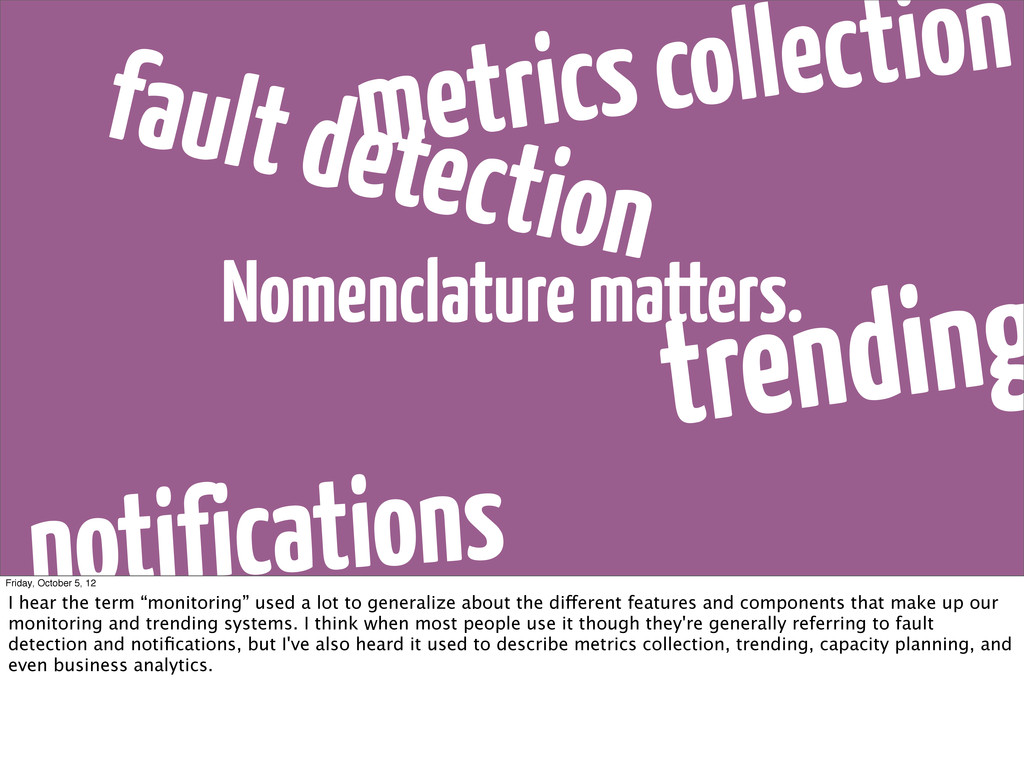
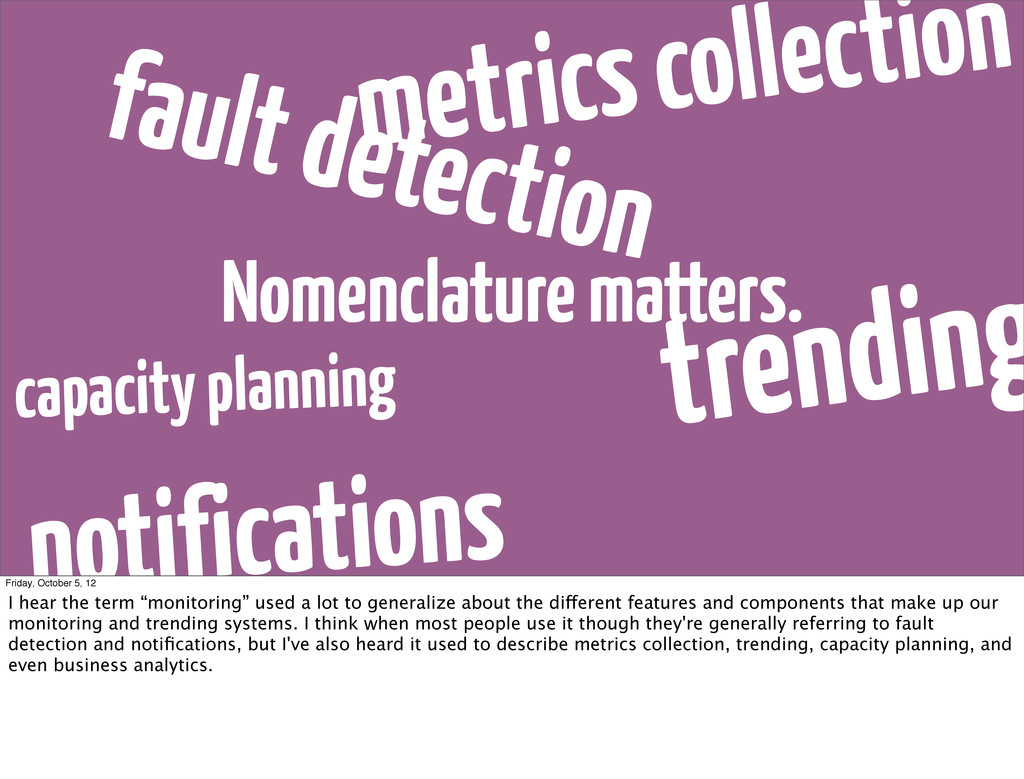
Friday, October 5, 12 I hear the term “monitoring” used a lot to generalize about the different features and components that make up our monitoring and trending systems. I think when most people use it though they're generally referring to fault detection and notifications, but I've also heard it used to describe metrics collection, trending, capacity planning, and even business analytics.
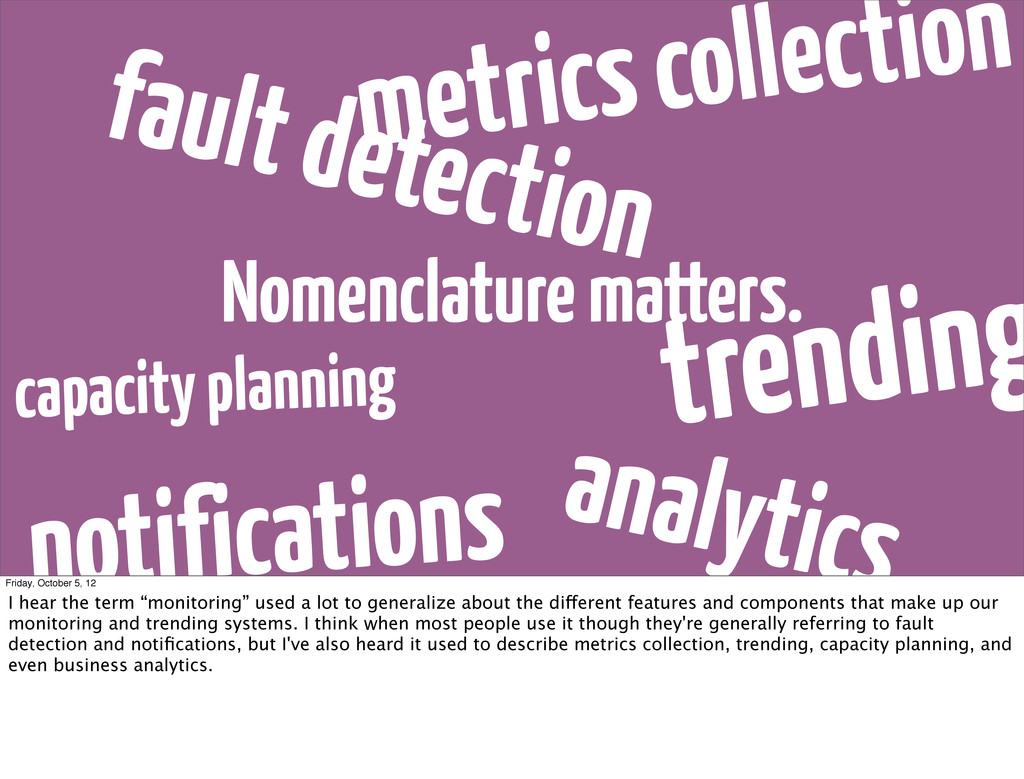
analytics Friday, October 5, 12 I hear the term “monitoring” used a lot to generalize about the different features and components that make up our monitoring and trending systems. I think when most people use it though they're generally referring to fault detection and notifications, but I've also heard it used to describe metrics collection, trending, capacity planning, and even business analytics.
I think it’s important that we identify what we mean by monitoring. What are the different functions it provides? Are these already available as distinct services, or can they be in the future? Once we identify all of these we can begin to see what a modern monitoring architecture might look like.
but we rarely think about it when planning our architecture, other than as a by-product of fault detection, or separately as what powers our trending graphs. Especially with tools like Nagios that throw out the data after informing us as to what’s going on RIGHT NOW.
basic Nagios check like check-host-alive that tells us whether a host is up or down. But what is it really telling us? That we received a ping response to our ping request. But what does THAT really mean? That there’s a server out there somewhere, with at least the capacity to listen for ICMP requests and respond in kind.
tell us? Still not much. We have no idea whether that network host is operating as intended. We’ve all seen servers that respond on the network even after a kernel panic. So what do we do? We start checking operating system-level metrics that help us ascertain the true state of the system. Metrics like CPU jiffies and load level that tell us how the system is behaving, but they don't really explain how it got there.
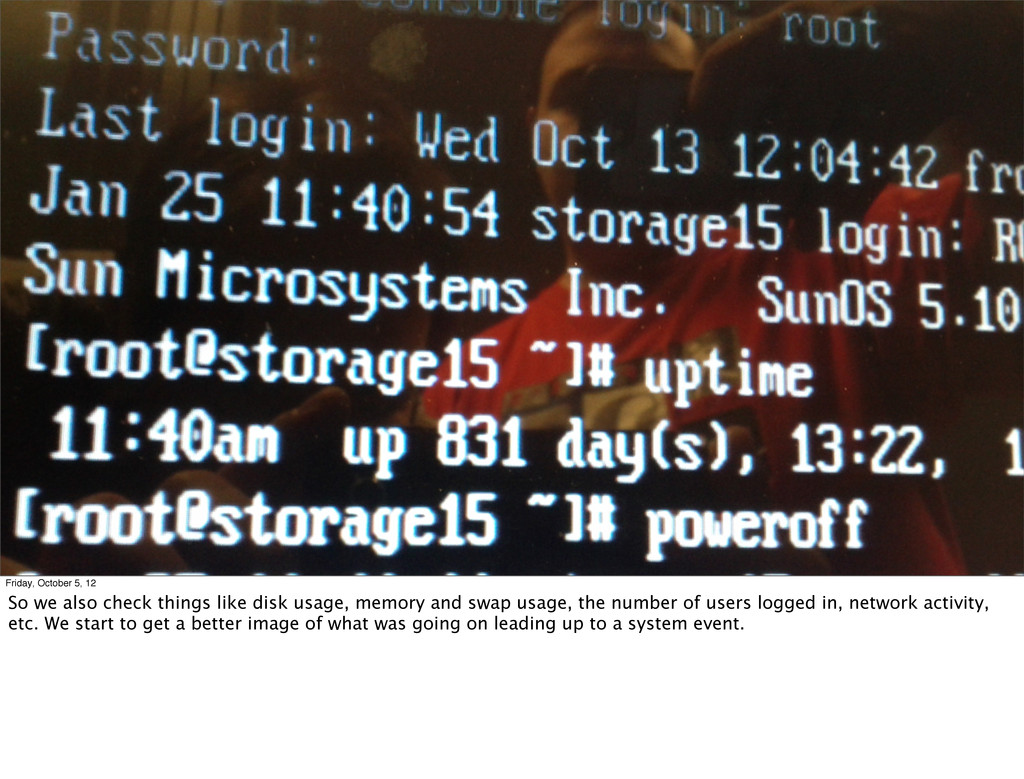
disk usage, memory and swap usage, the number of users logged in, network activity, etc. We start to get a better image of what was going on leading up to a system event.
servers for the sake of running the operating system. So we need to gather more information on the services on this host. If it's a database server maybe we'll check the number of connections, the number of long- running queries, replication state, etc. And yet, even after all of this, we still might not have all of the data we'll need to troubleshoot an event or plan for capacity upgrades.
is in perfect working order, but we suffer a transient event on the network, and our database clients start timing out? So we start checking the database connection from a remote host. We monitor the time to connect, time to first byte, total latency, etc.
I'm trying to make is that we need to place more emphasis on what metrics collection is, and why it's arguably THE MOST IMPORTANT part of the monitoring workflow. Historically this has been something we've only considered as part of Fault Detection, i.e. host and service checks. We have to start treating our metrics as first-class data, with plans for long-term data storage and recovery.
data that we'll use going forward to plan for future growth and strategic architectural changes. We should plan to collect as much data as possible, as granular as possible, and store it for as long as possible.
job. We have to be able to, ideally in real-time, track changes within the metrics we've collected about that entity, and determine when that change goes beyond an acceptable threshold.
on simple boolean checks, i.e. does it respond, or to a greater extent, does the data we've collected fall within a predetermined range, i.e. latency. Because these are static configurations, they're highly inflexible, and frequently incorrect as your systems evolve and scale. As I'm sure many of you would attest to at 3 in the morning.
are designed to work based on what they know about the target right now, we're (for the most part) unable to take advantage of long-term historical trending or forecasting algorithms.
what we have at our disposal. Traditional open-source Fault Detection systems will identify when a target's state has changed will fire off some sort of notification event to let us know that things are broken.
generally hard to fuck up. In principal. But there can be a lot of complexity in what is otherwise a very simple premise: delivering an alert from the monitoring system to the responsible party. Let's step back for a moment and review a notification might look like.
system determines that something has failed. It knows which host and service (or application) triggered the alert. It knows what the previous state was. It knows the current state. It knows when this happened and hopefully has some additional metadata, maybe a link to the online documentation, that it wants to include for your convenience. Ok, now what to do with this information?
shop, we whip up an email or pager message and fire it off to someone with the skills to fix the problem. But as we grow, how do we account for pager rotations or escalation policies? Fortunately these days we have services like PagerDuty to deal with this pain.
came along there really was no easy way of handling this. If we were lazy we'd just change the email alias to the new on-call person at every shift change. If we were REALLY lazy we'd have a script that hits a database or Google Calendar to see who's on-call and then update the email alias programmatically.
if I said I wasn't a little nervous about placing so much of our collective trust in a single company. I love the team at PagerDuty but I think it would be nice to see some small, sharp, open-source tools developed around notifications and scheduling. Unfortunately they've made this mostly a solved problem and I don't see anyone wanting to deal with this pain until they do something stupid that makes us want to leave.
and Notifications to enable first response to any outages or unknown states. But long-term trending of our data is what empowers us to make intelligent decisions about how to resolve ongoing problems or plan for future change. It provides empirical evidence so that we don't have to operate purely on short- term spikes, conjecture or "educated guesses".
historically been used by SysAdmins for visualizing network traffic and server load. The Multi Router Traffic Grapher (MRTG) was the first popular graphing toolkit. As its name suggests, it was commonly used to graph SNMP metrics from routers and switches.
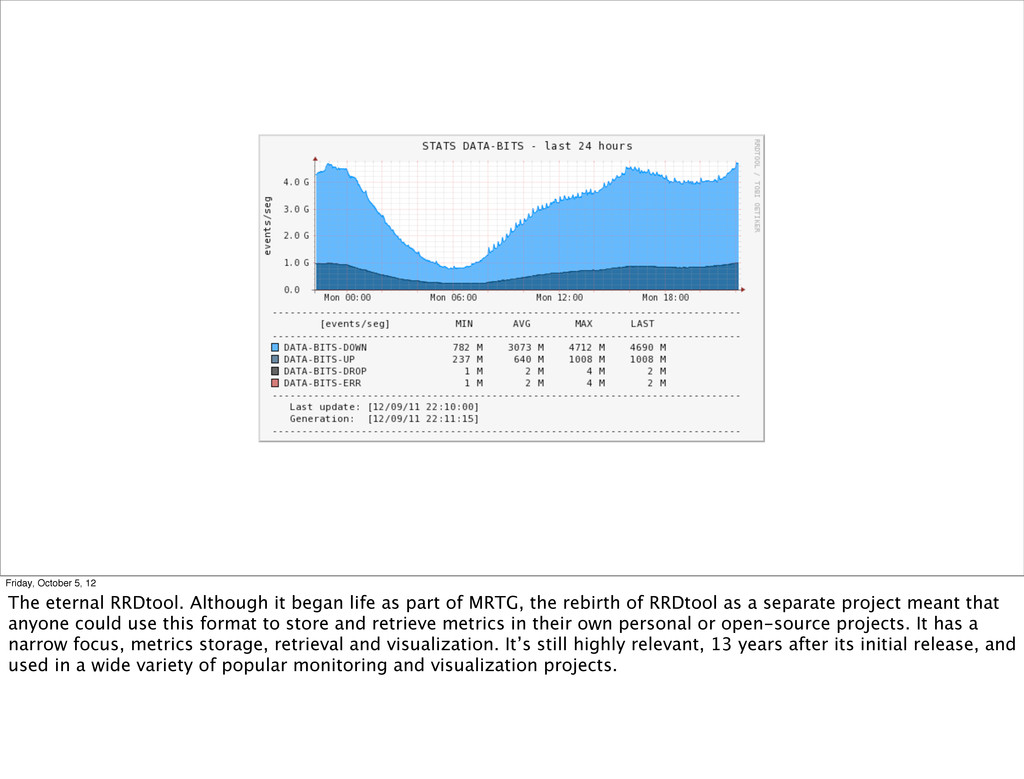
MRTG was eventually rewritten externally as RRDtool, a new version of the TSDB that was faster, more portable, and used a sparse file that wouldn't grow over time.
awkward to work with, it made it easy enough that the average Systems Administrator could start trending all of their hosts and services with a minimum of pain.
days we've got a huge variety of trending toolkits to work with. Most commercial vendors tend to focus on specific use cases, e.g. Front-End Performance, Transactional Profiling and Business Intelligence Analytics.
tend to focus on providing a scalable storage backend and graphing toolkits or an API. More and more we’re seeing an entire ecosystem of dashboard projects built up around these as well.
variety of transforms and filters, allowing us to do things like: aggregate or average our metrics, calculate the 99th percentile, standard deviation, adjust scales, or simply help us forecast for growth. As the algorithms become more sophisticated and our datasets mature, it makes even more sense to start looking to our trending systems as the "source of truth" for Fault Detection.
quick stroll through some of the more important open-source monitoring tools through modern history. I’m going to make a case as to why I think each of these tools are good, bad or really awful. You might disagree and that’s ok, this is just my list with my own personal criteria for judging them.
life as part of MRTG, the rebirth of RRDtool as a separate project meant that anyone could use this format to store and retrieve metrics in their own personal or open-source projects. It has a narrow focus, metrics storage, retrieval and visualization. It’s still highly relevant, 13 years after its initial release, and used in a wide variety of popular monitoring and visualization projects.
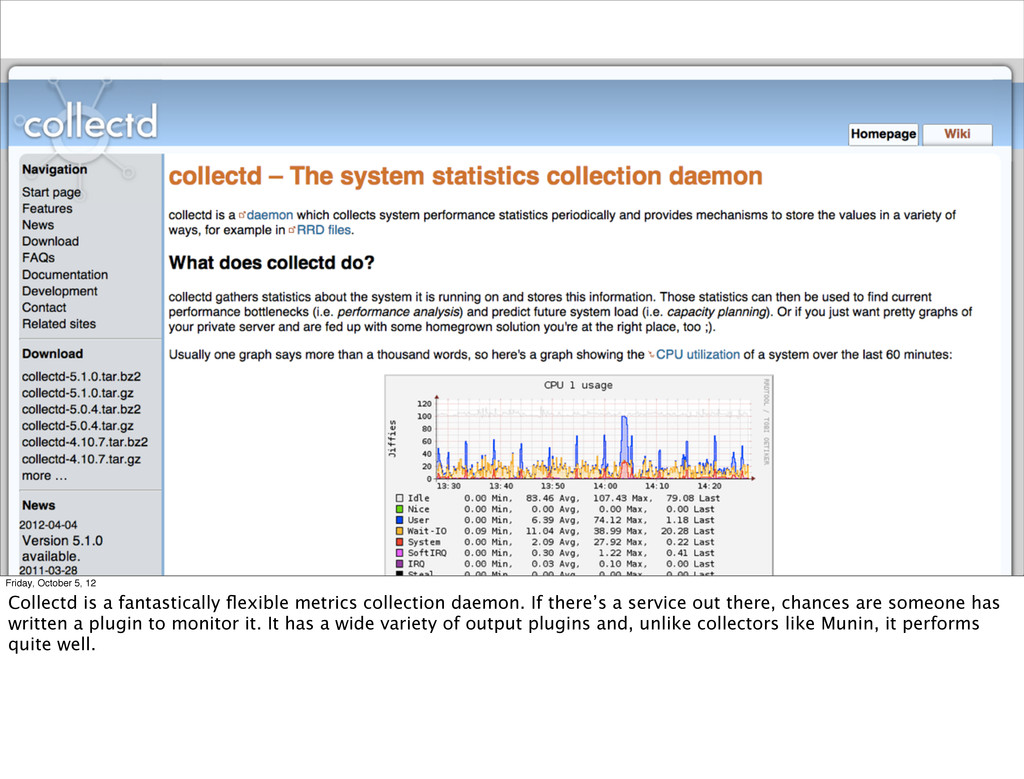
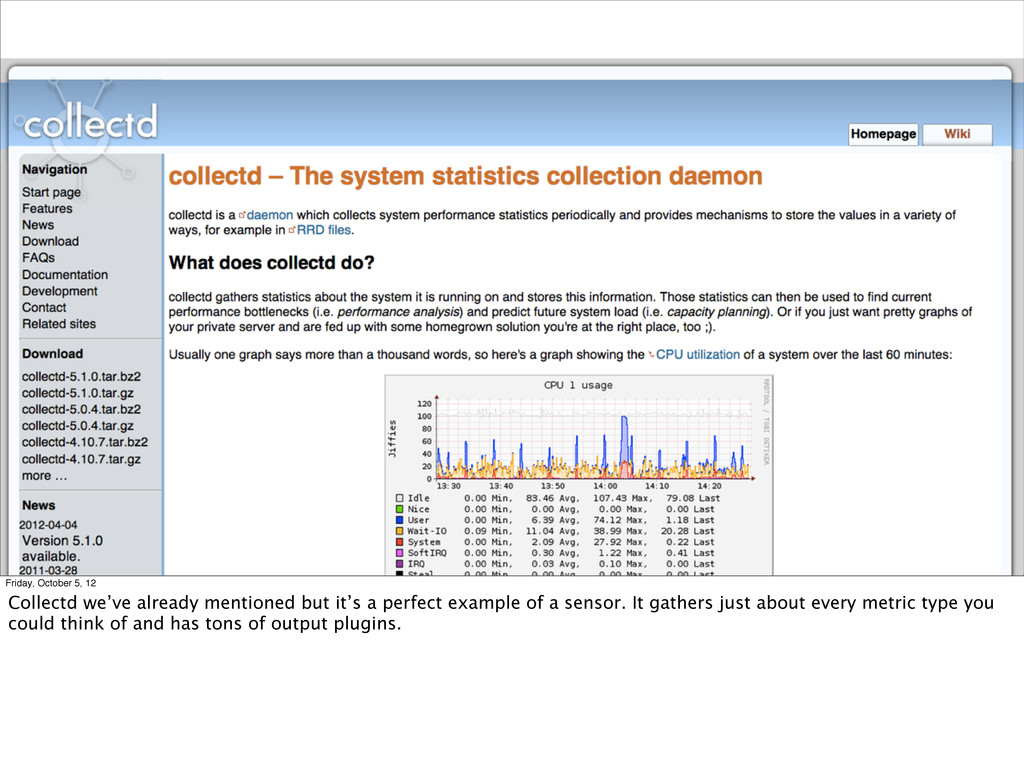
collection daemon. If there’s a service out there, chances are someone has written a plugin to monitor it. It has a wide variety of output plugins and, unlike collectors like Munin, it performs quite well.
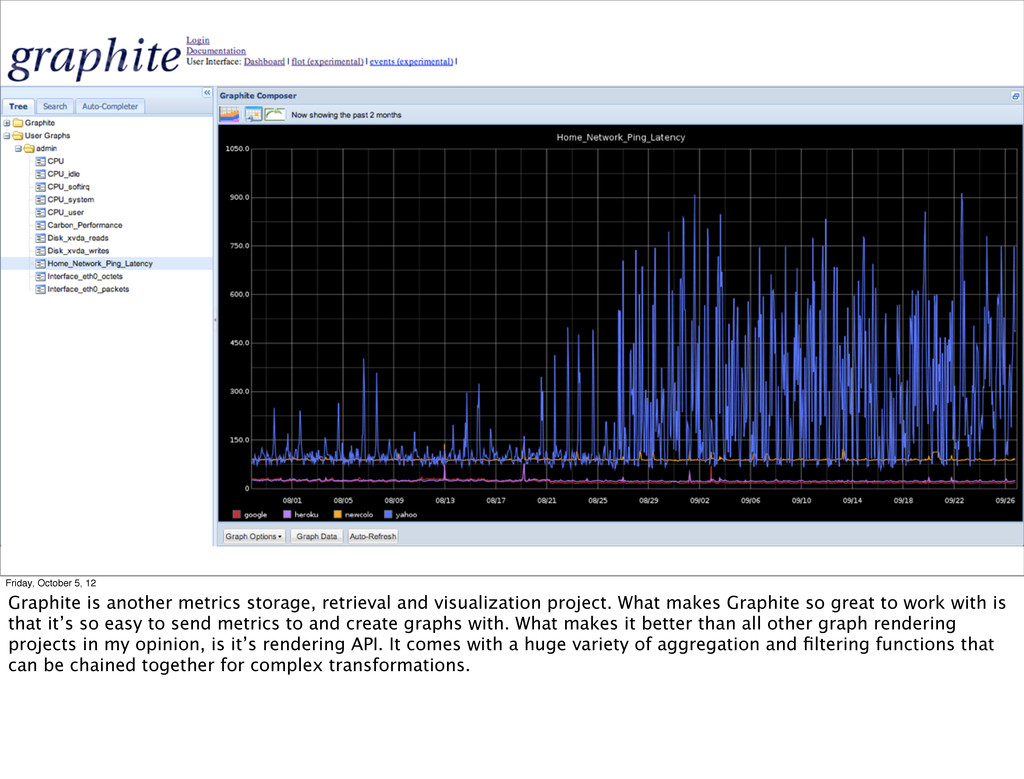
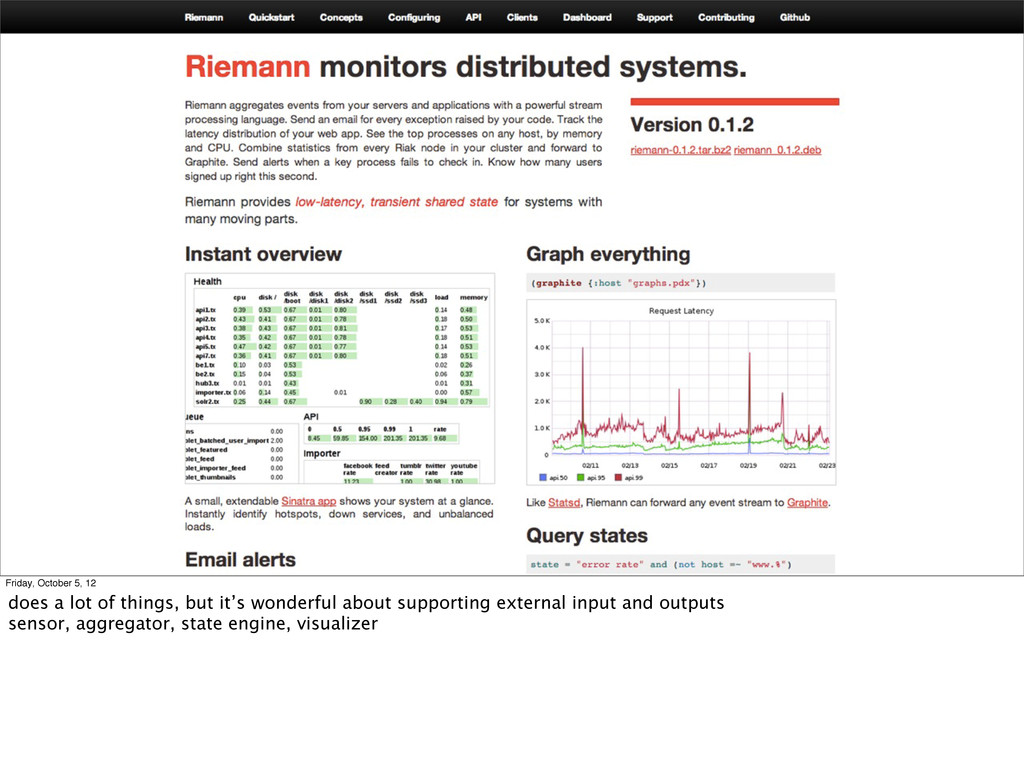
and visualization project. What makes Graphite so great to work with is that it’s so easy to send metrics to and create graphs with. What makes it better than all other graph rendering projects in my opinion, is it’s rendering API. It comes with a huge variety of aggregation and filtering functions that can be chained together for complex transformations.
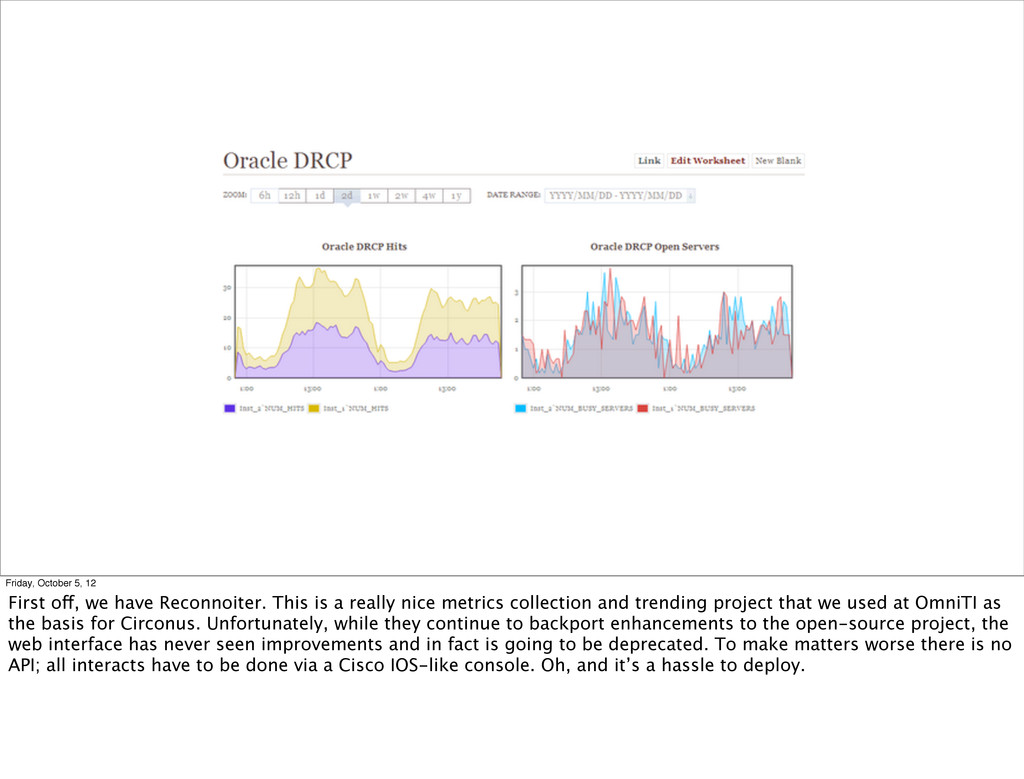
is a really nice metrics collection and trending project that we used at OmniTI as the basis for Circonus. Unfortunately, while they continue to backport enhancements to the open-source project, the web interface has never seen improvements and in fact is going to be deprecated. To make matters worse there is no API; all interacts have to be done via a Cisco IOS-like console. Oh, and it’s a hassle to deploy.
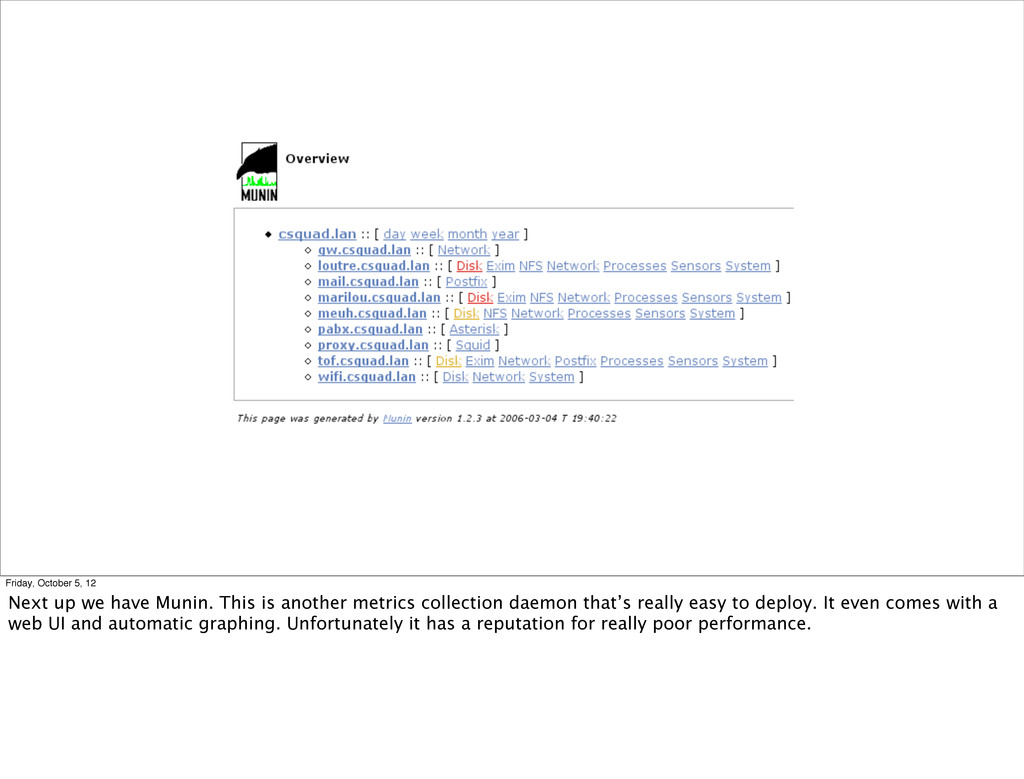
is another metrics collection daemon that’s really easy to deploy. It even comes with a web UI and automatic graphing. Unfortunately it has a reputation for really poor performance.
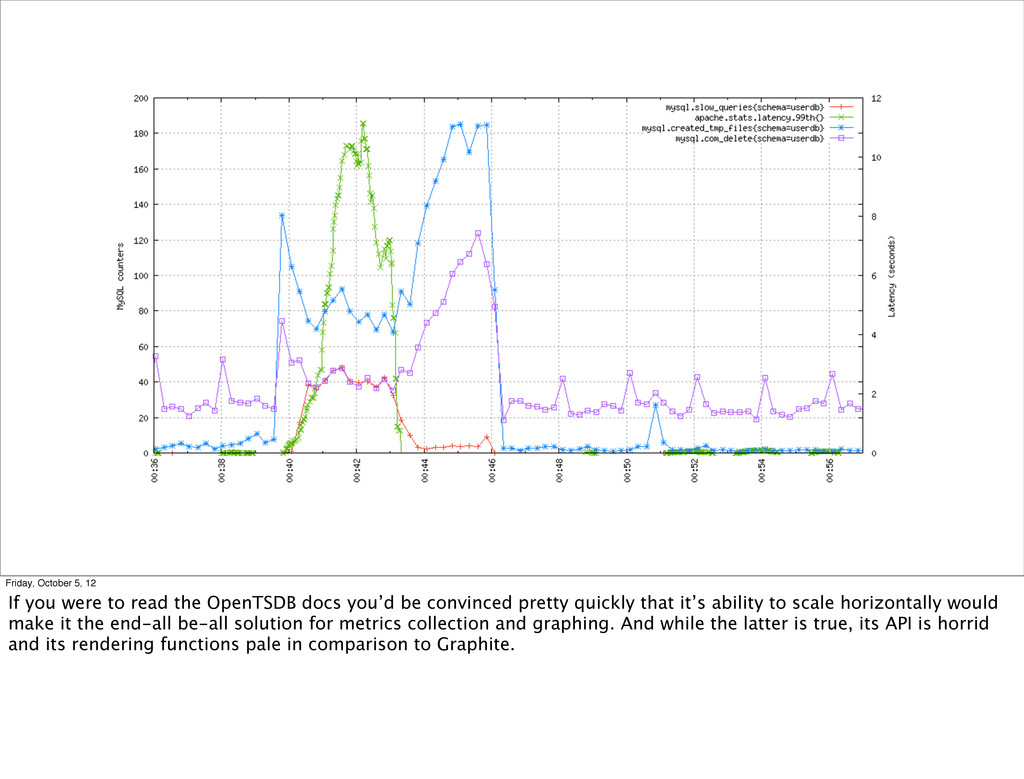
OpenTSDB docs you’d be convinced pretty quickly that it’s ability to scale horizontally would make it the end-all be-all solution for metrics collection and graphing. And while the latter is true, its API is horrid and its rendering functions pale in comparison to Graphite.
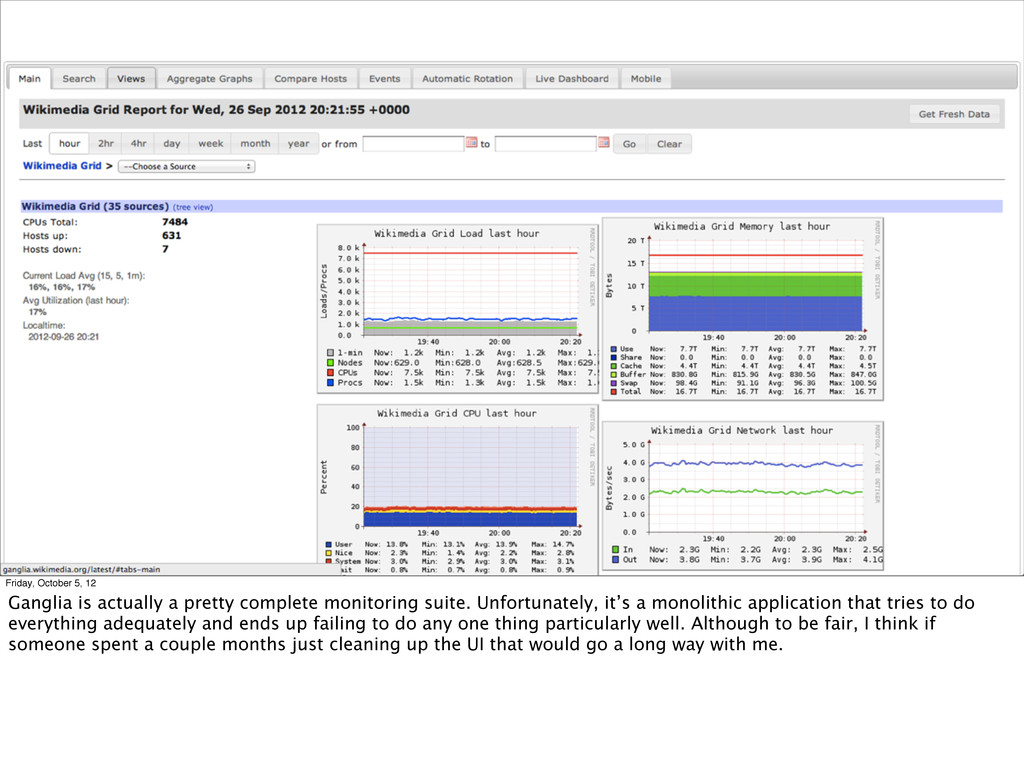
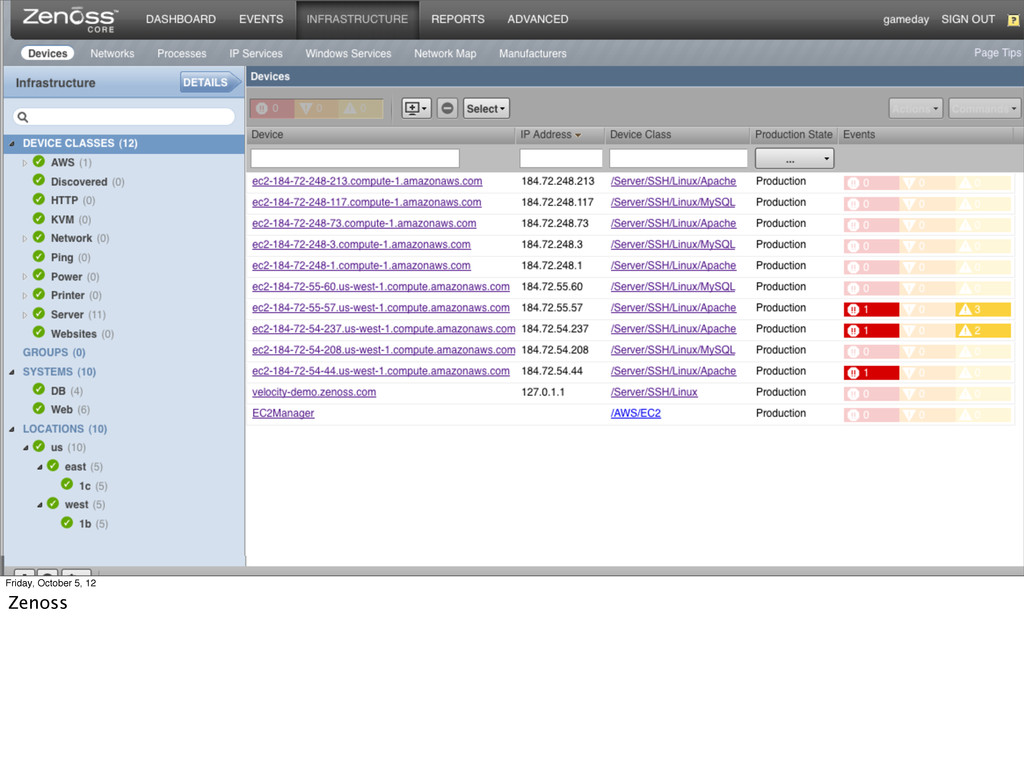
monitoring suite. Unfortunately, it’s a monolithic application that tries to do everything adequately and ends up failing to do any one thing particularly well. Although to be fair, I think if someone spent a couple months just cleaning up the UI that would go a long way with me.
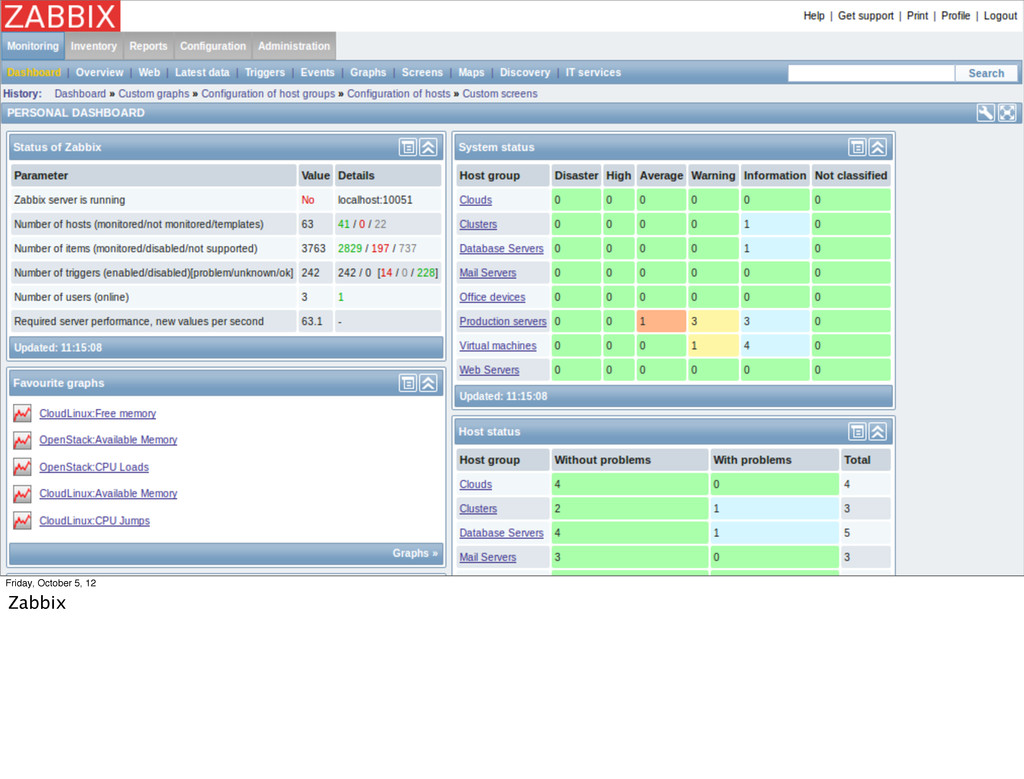
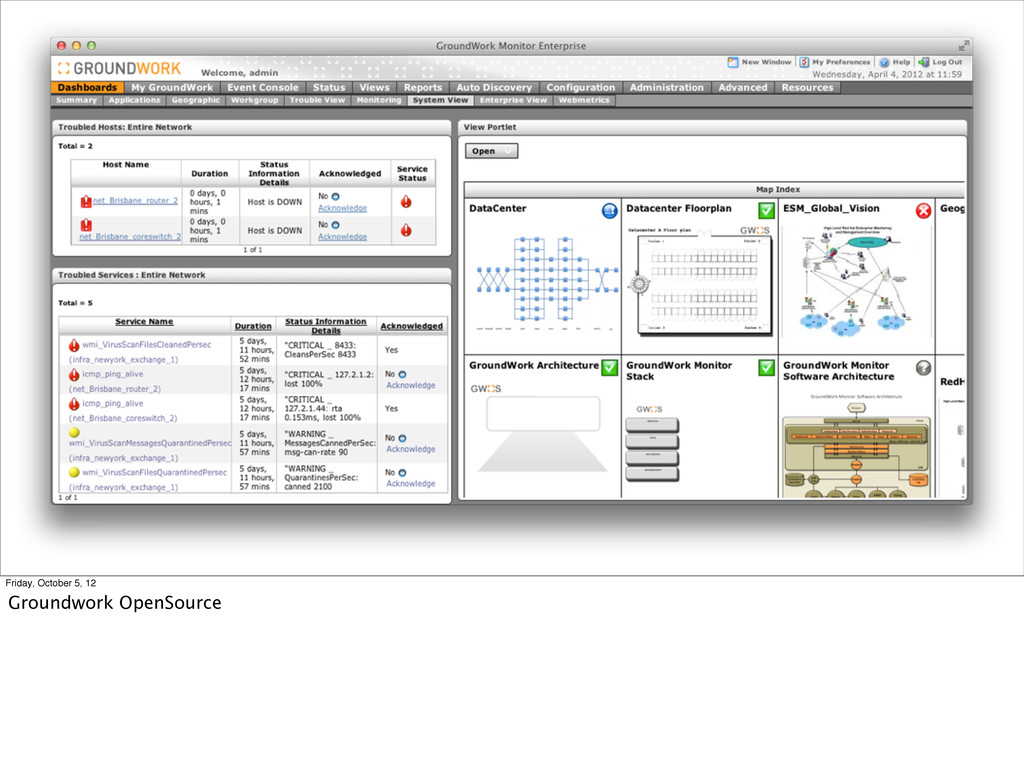
bad list have a lot in common. They’re all developed by commercial companies that offer an open-source or free version. They all emphasize automatic discovery over integration with configuration management. They’re all targeted to Enterprise customers. And in my opinion, they always end up looking like a prettier version of Nagios.
these “fucking terrible” with a bit of tongue-in-cheek. These projects are clearly successful and in some cases, ubiquitous for the market they were designed for. Unfortunately, they are mostly good enough that nobody has been motivated to really improve upon them, so we’ve been stuck with these for a really long time.
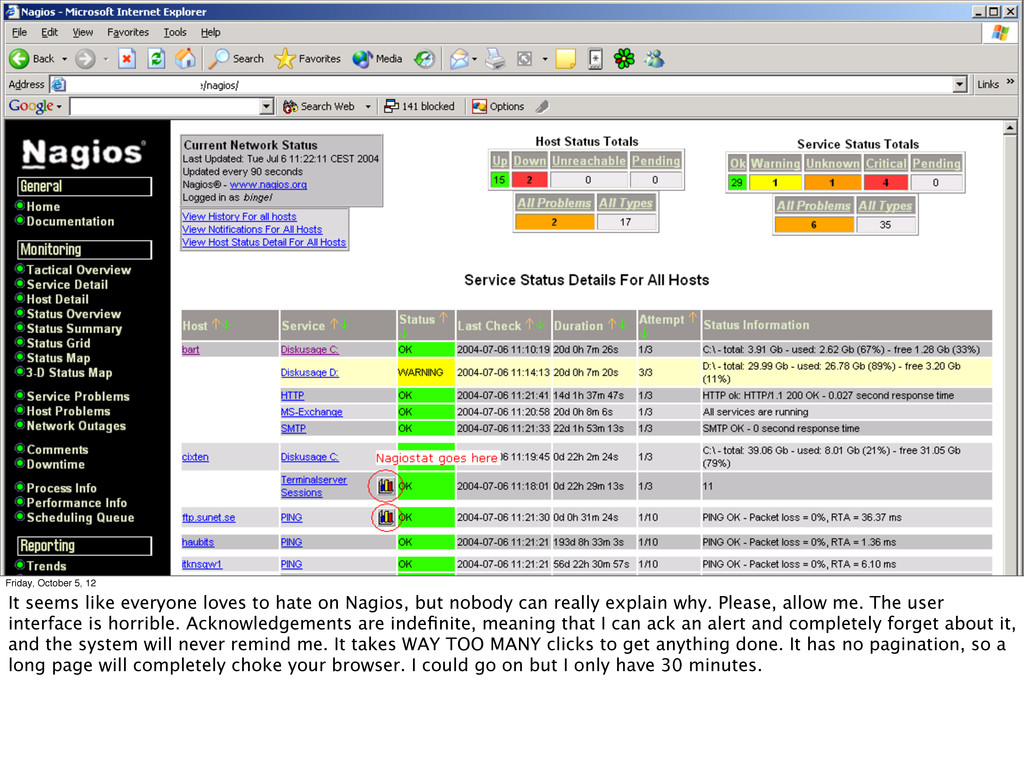
hate on Nagios, but nobody can really explain why. Please, allow me. The user interface is horrible. Acknowledgements are indefinite, meaning that I can ack an alert and completely forget about it, and the system will never remind me. It takes WAY TOO MANY clicks to get anything done. It has no pagination, so a long page will completely choke your browser. I could go on but I only have 30 minutes.
could do much worse than Cacti. It’s really good for adding network metrics, but it favors configuration over convention and doesn’t attempt to hide many of the rarely used options. Graphs are reasonably easy to create, but their data, host and graph templates are really difficult to master.
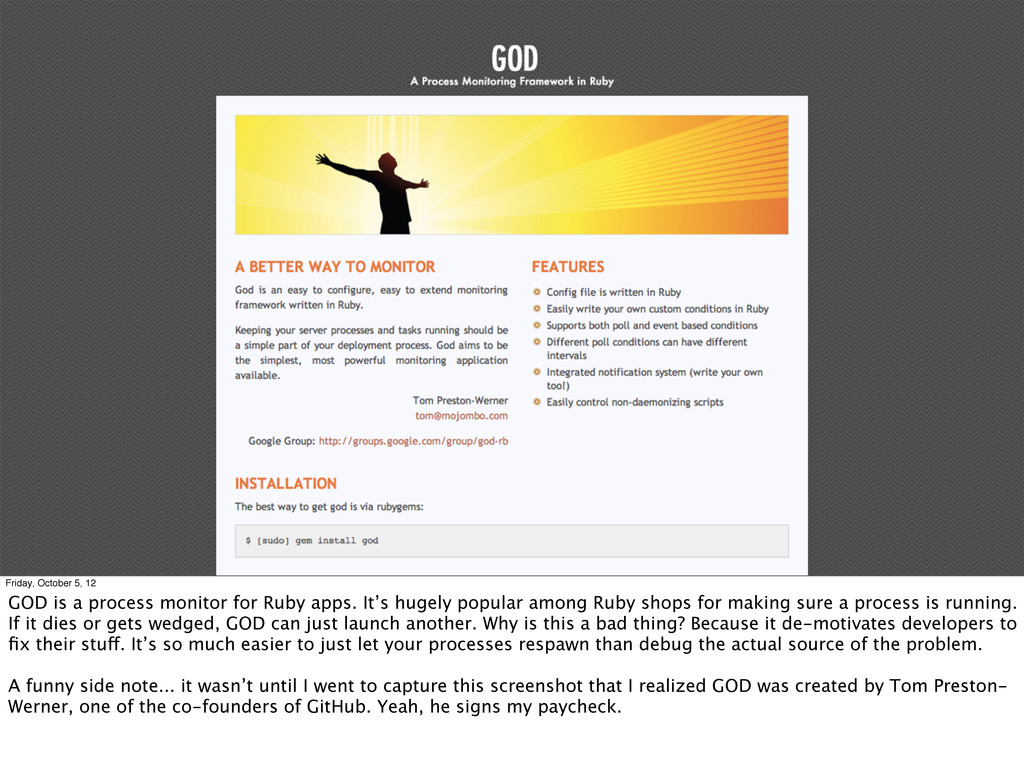
Ruby apps. It’s hugely popular among Ruby shops for making sure a process is running. If it dies or gets wedged, GOD can just launch another. Why is this a bad thing? Because it de-motivates developers to fix their stuff. It’s so much easier to just let your processes respawn than debug the actual source of the problem. A funny side note... it wasn’t until I went to capture this screenshot that I realized GOD was created by Tom Preston- Werner, one of the co-founders of GitHub. Yeah, he signs my paycheck.
ton of open-source and commercial monitoring tools available, so why does monitoring suck so bad? What makes us love a particular tool that only does one thing, but despise another that would seem to have everything we want?
that hard to understand. We're a finicky bunch. We prefer our systems built from small, sharp tools. We don't want the hassle of commercial software. Put it simply, we prefer the UNIX way.
there’s a reason why Pingdom and PagerDuty are so popular among technically competent businesses. Cost is only a small part of the picture. We understand implicitly that combining small, sharp tools into a cohesive system is a helluva lot easier than breaking apart an Enterprise monitoring suite and forcing it to meet our specific needs.
choose the “monolithic” Enterprise offering? A lot of times it’s for convenience. The illusion that one product will meet all of our needs. Other times it’s because we don’t make the choice at all. Your decision-makers are completely out of touch with the realities of day-to-day operations and end up shopping from a checklist rather than experience.
aren’t going away anytime soon. And for Enterprise customers who can afford to make these mistakes and start over, that’s fine. But their model does NOT fit how we need to think about open- source tools. For the majority of us, we don't use open-source software because it's "free". We use it because it fits our needs, or because we can modify it to do so. It offers us choice. Because we understand how it fits together. How it makes our job easier. And how it makes our business run smoother.
general themes to draw on when we’re talking about good-vs-bad software. But what are the specific characteristics of the next generation of open-source monitoring tools?
It doesn't require root access or an Ops member to deploy. Developers should be able to submit metrics and craft alerts without help or impedance from anyone else.
12 It's correlative. It's able to implicitly model relationships between services. We can use it to look at seemingly unrelated metrics within the same interface.
5, 12 Last but not least, it's beautiful. It's a pleasure to use. It removes impedance from the user experience and rewards us simply by using it. What do we end up with?
the characteristics of a composable monitoring system we can start to look at what we already have and start classifying each of these units, and by extension, their interfaces. There’s a good chance that both current and future projects will overlap functionality, but that’s ok; the most important thing is that we start to define the formats and interfaces that make these components INTERCHANGEABLE.
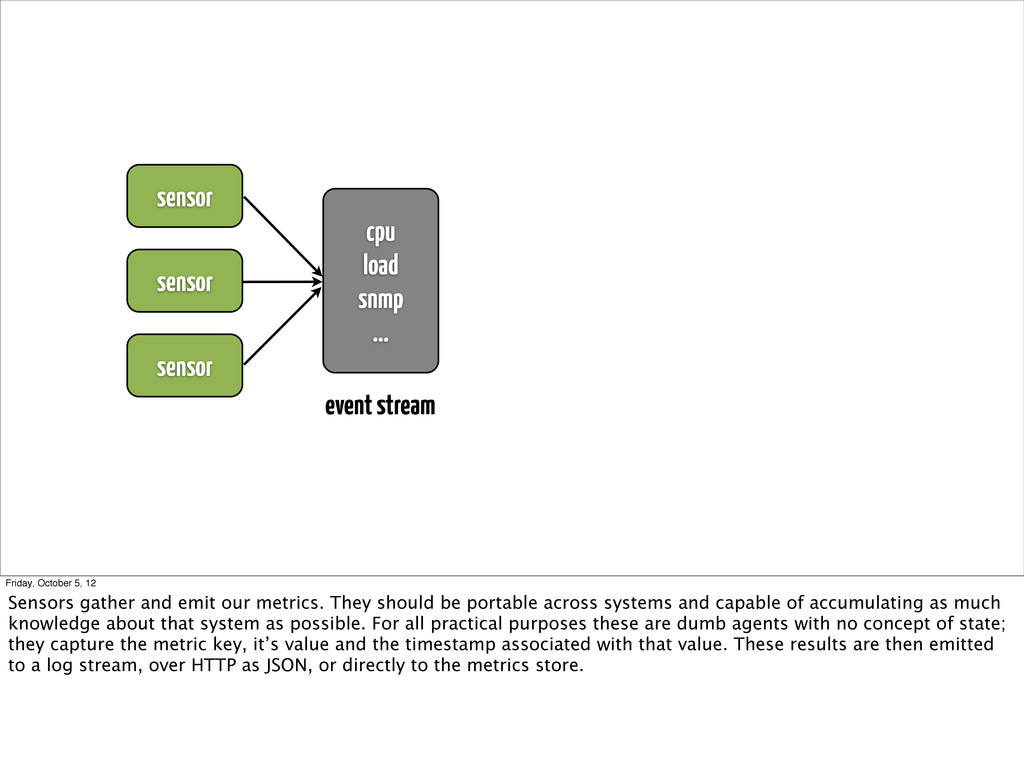
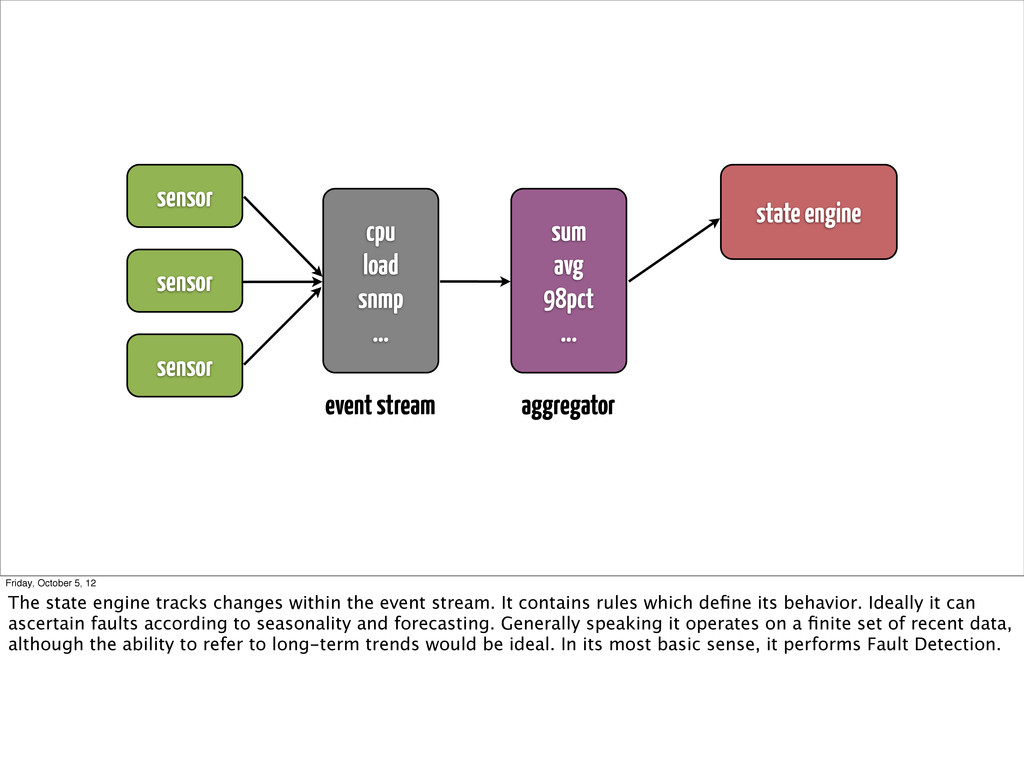
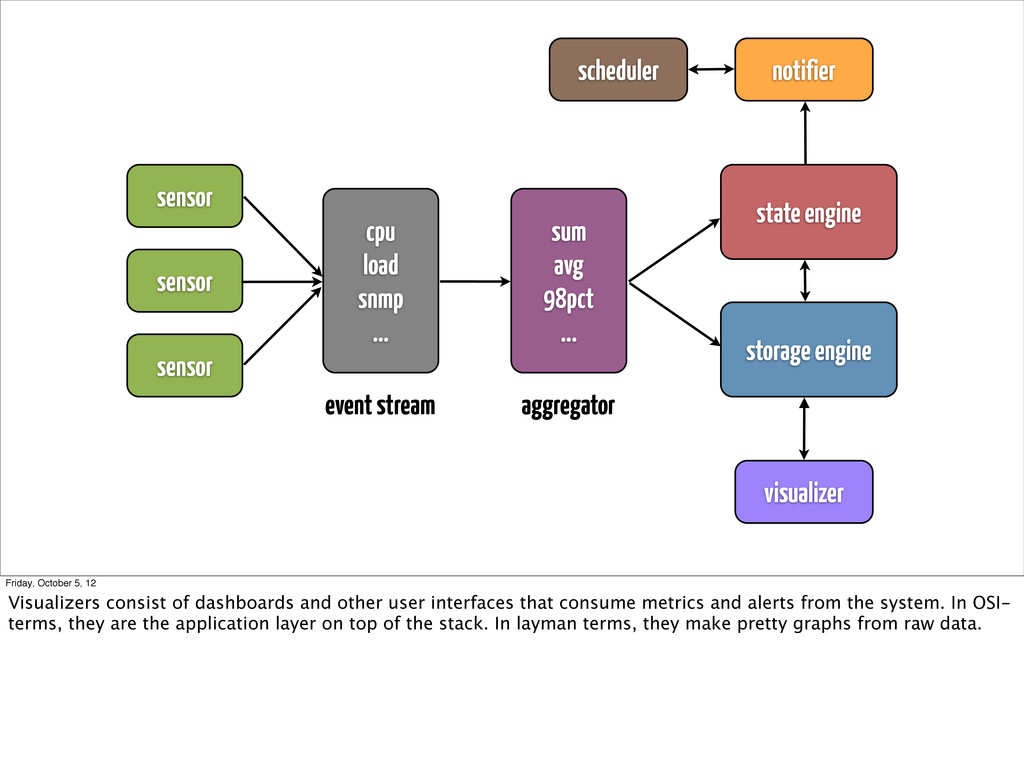
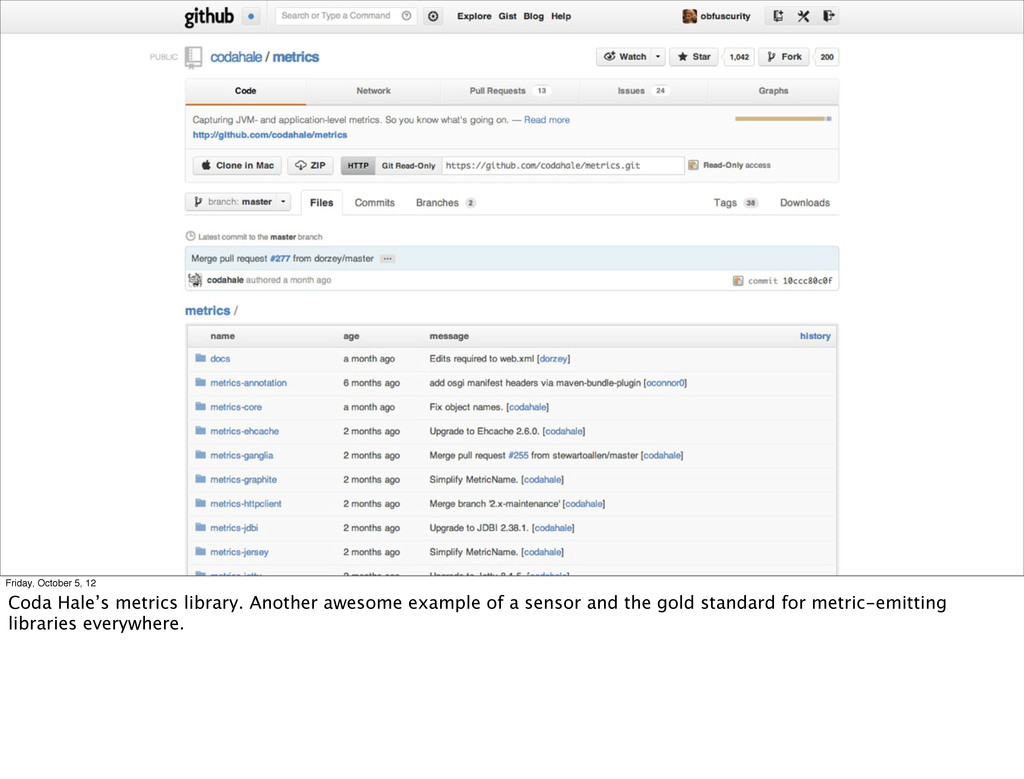
October 5, 12 Sensors gather and emit our metrics. They should be portable across systems and capable of accumulating as much knowledge about that system as possible. For all practical purposes these are dumb agents with no concept of state; they capture the metric key, it’s value and the timestamp associated with that value. These results are then emitted to a log stream, over HTTP as JSON, or directly to the metrics store.
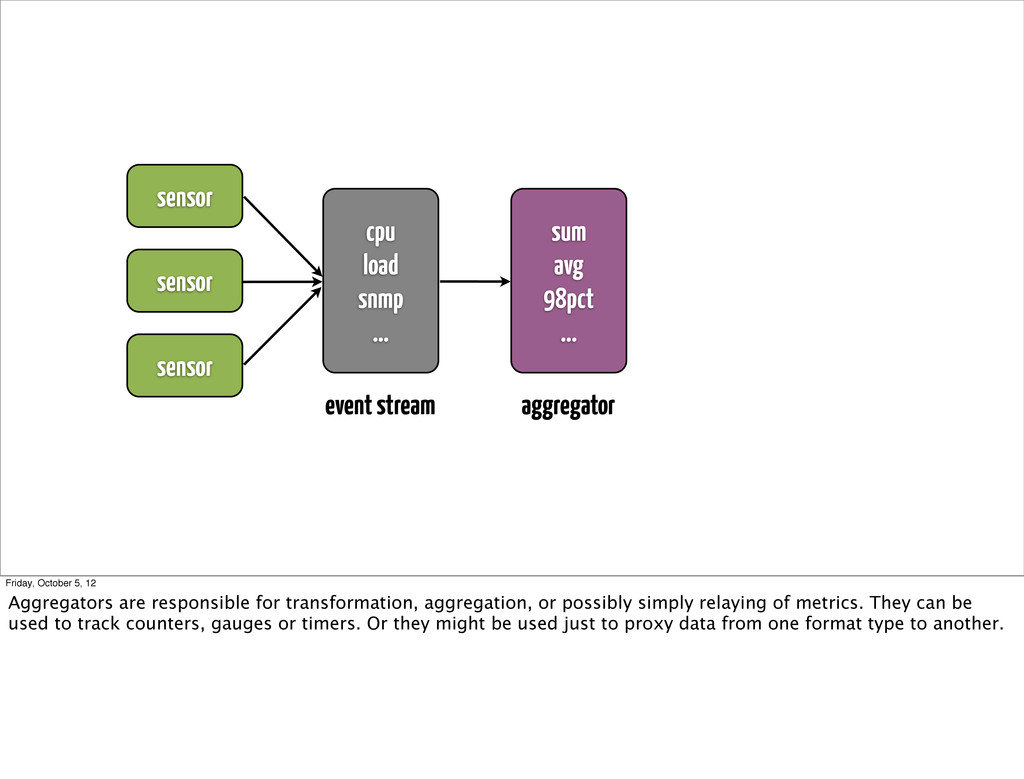
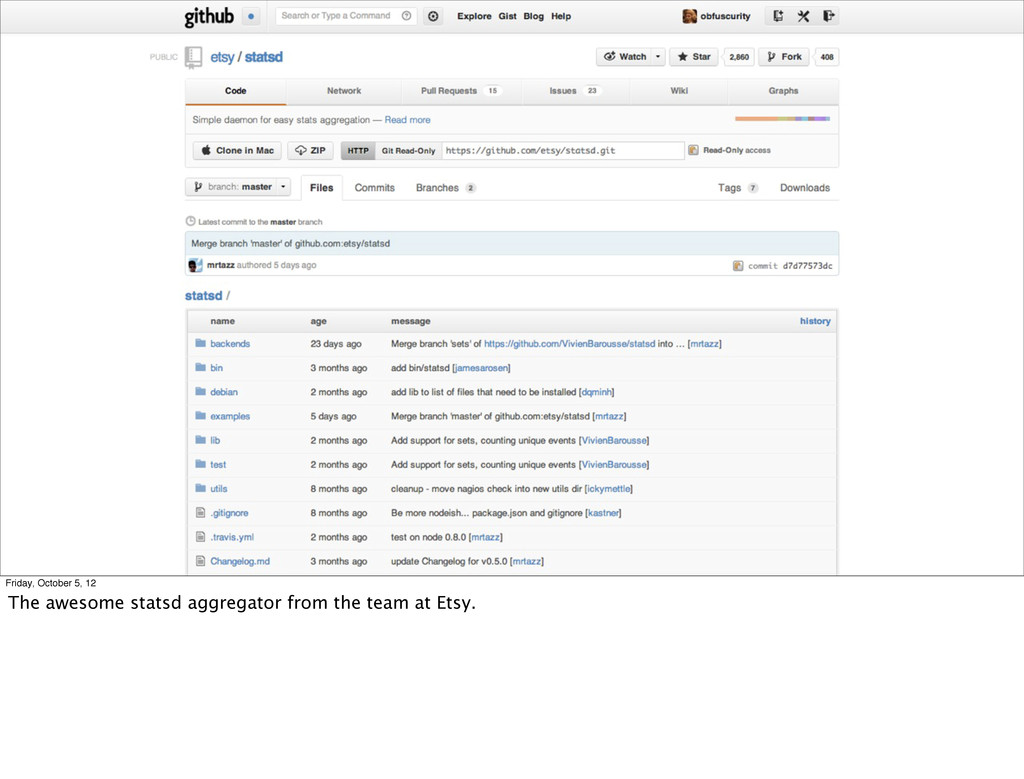
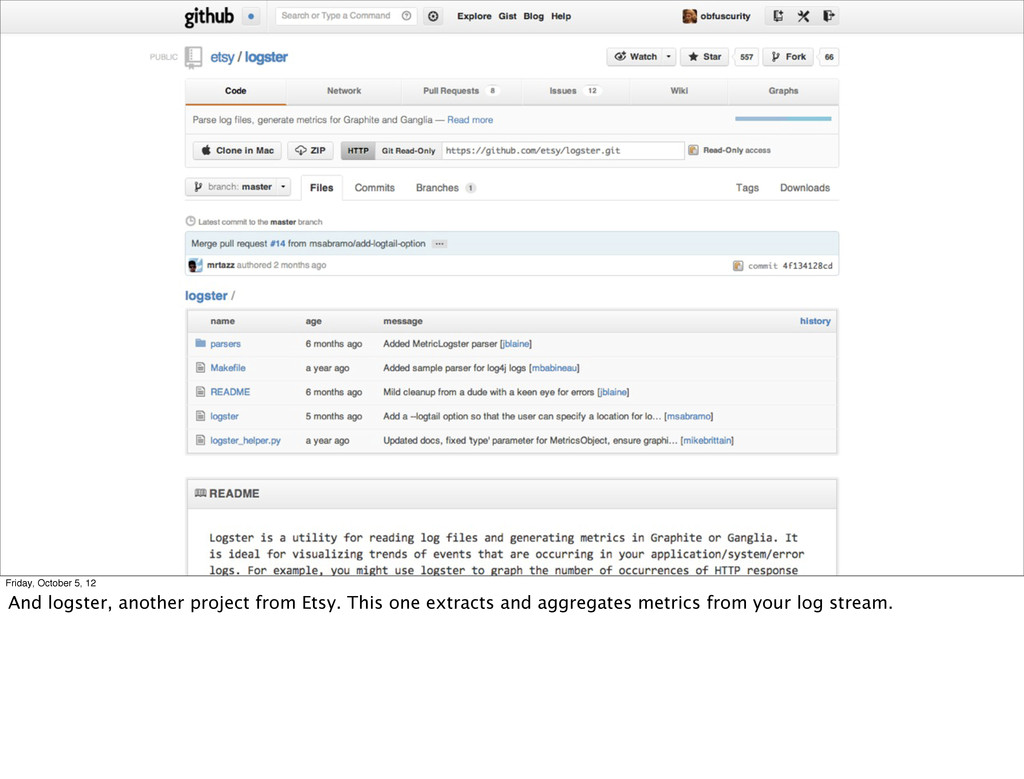
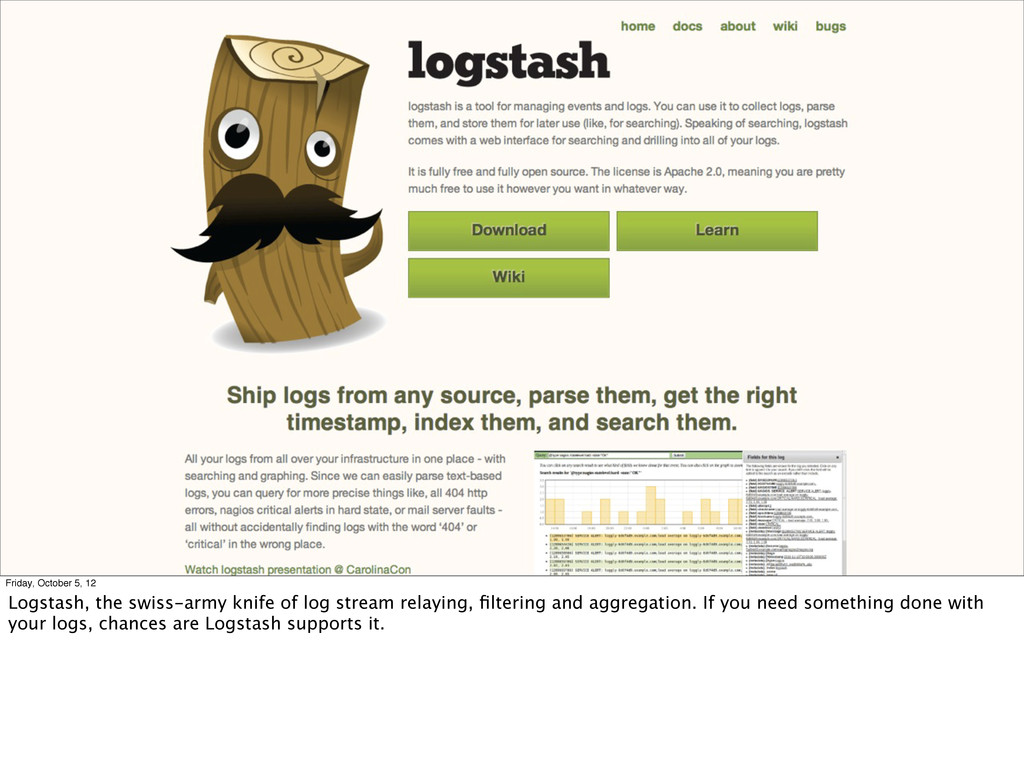
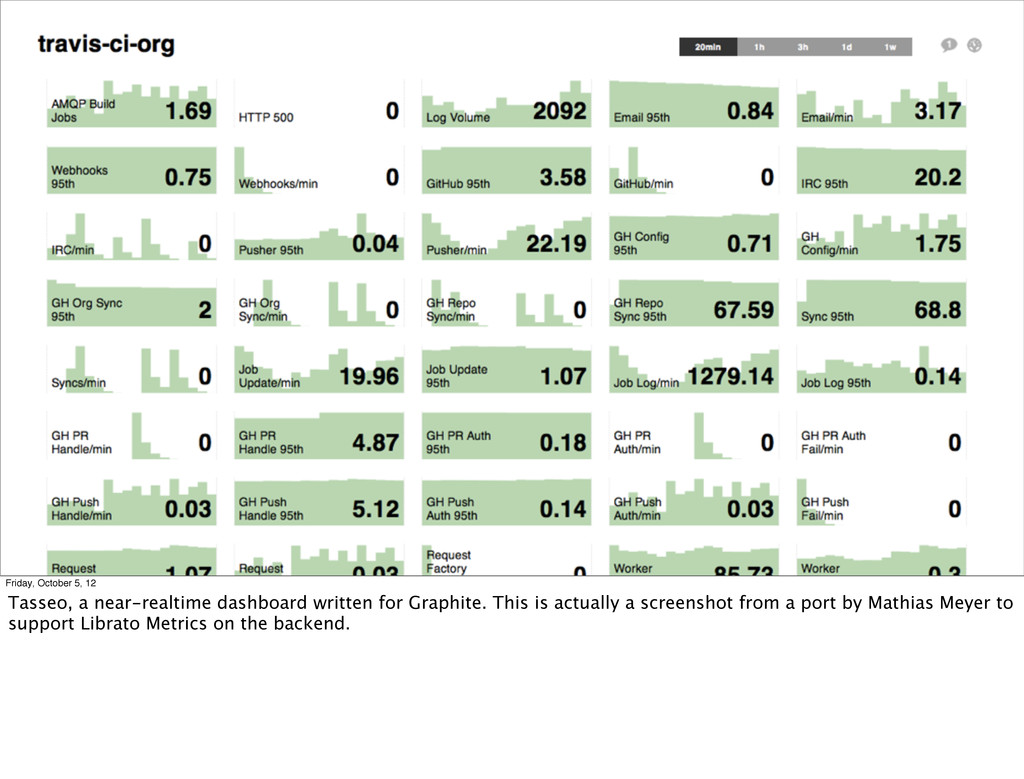
... event stream aggregator Friday, October 5, 12 Aggregators are responsible for transformation, aggregation, or possibly simply relaying of metrics. They can be used to track counters, gauges or timers. Or they might be used just to proxy data from one format type to another.
... state engine event stream aggregator Friday, October 5, 12 The state engine tracks changes within the event stream. It contains rules which define its behavior. Ideally it can ascertain faults according to seasonality and forecasting. Generally speaking it operates on a finite set of recent data, although the ability to refer to long-term trends would be ideal. In its most basic sense, it performs Fault Detection.
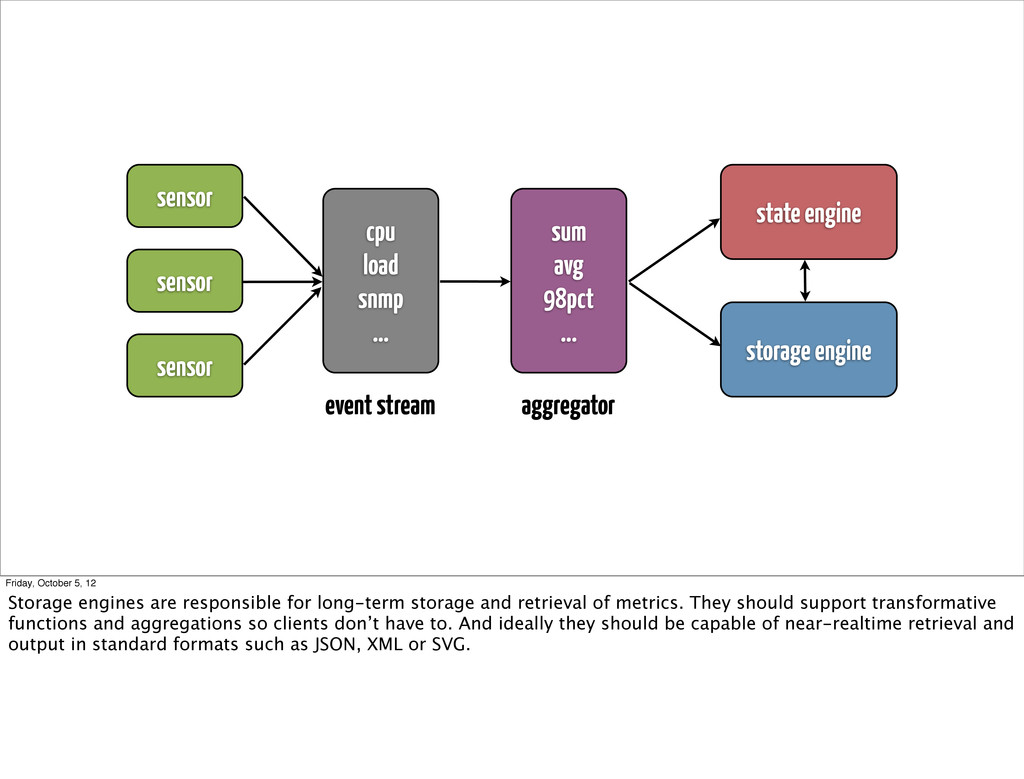
... state engine storage engine event stream aggregator Friday, October 5, 12 Storage engines are responsible for long-term storage and retrieval of metrics. They should support transformative functions and aggregations so clients don’t have to. And ideally they should be capable of near-realtime retrieval and output in standard formats such as JSON, XML or SVG.
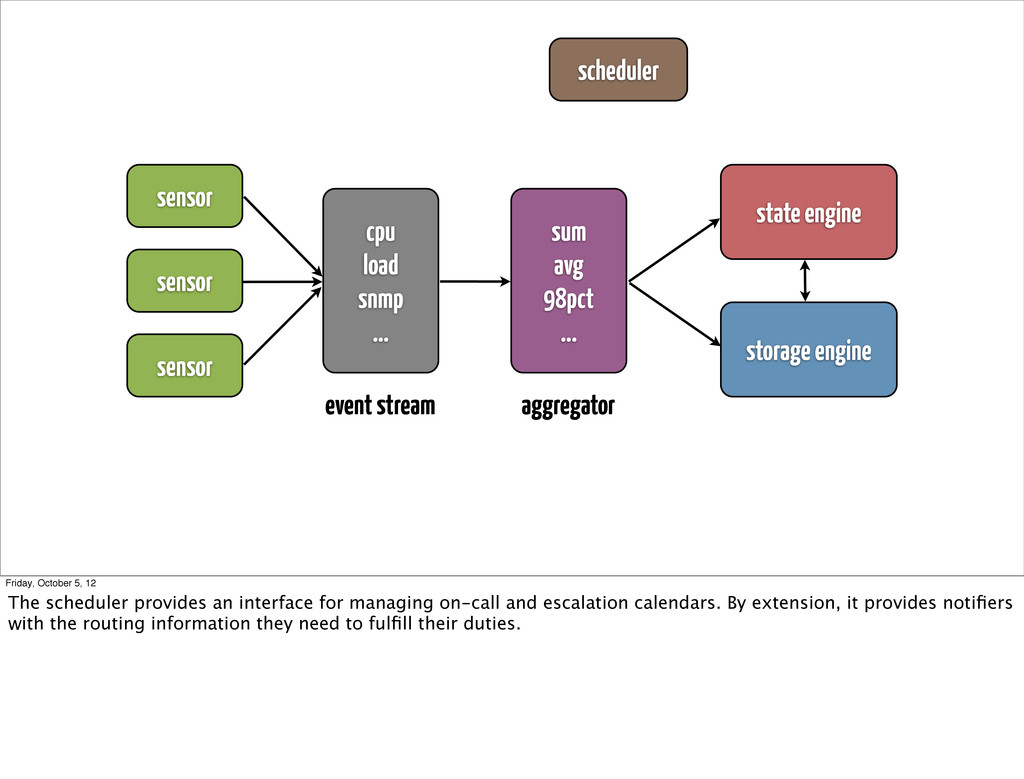
... state engine storage engine event stream aggregator scheduler Friday, October 5, 12 The scheduler provides an interface for managing on-call and escalation calendars. By extension, it provides notifiers with the routing information they need to fulfill their duties.
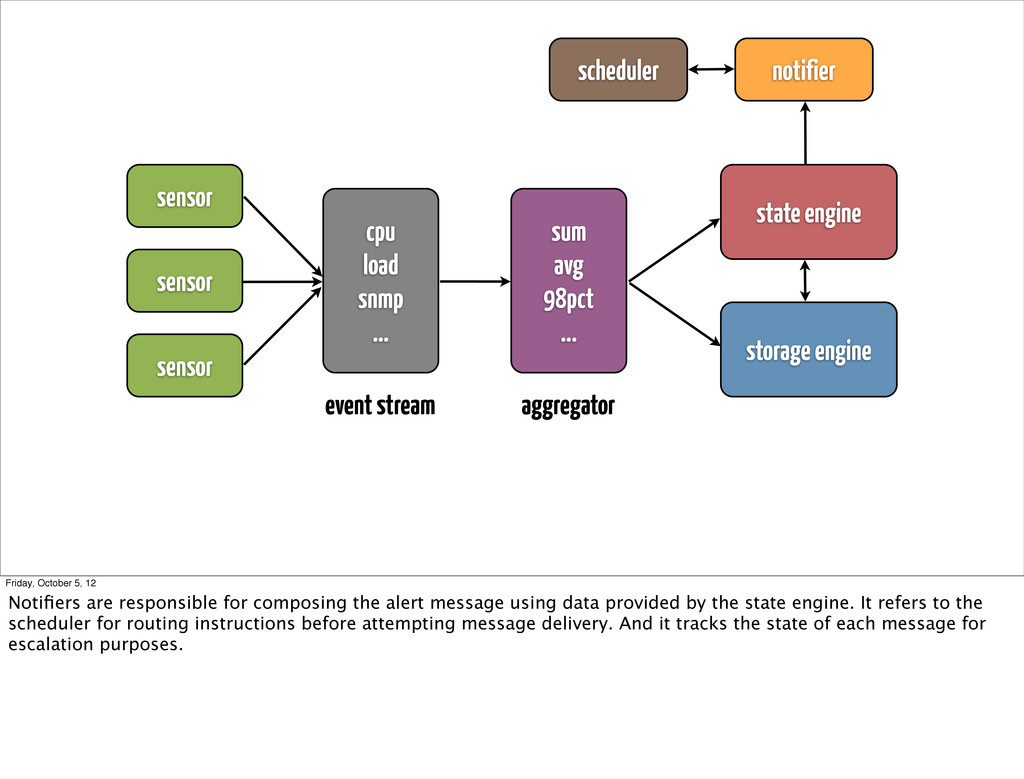
... state engine storage engine event stream aggregator scheduler notifier Friday, October 5, 12 Notifiers are responsible for composing the alert message using data provided by the state engine. It refers to the scheduler for routing instructions before attempting message delivery. And it tracks the state of each message for escalation purposes.
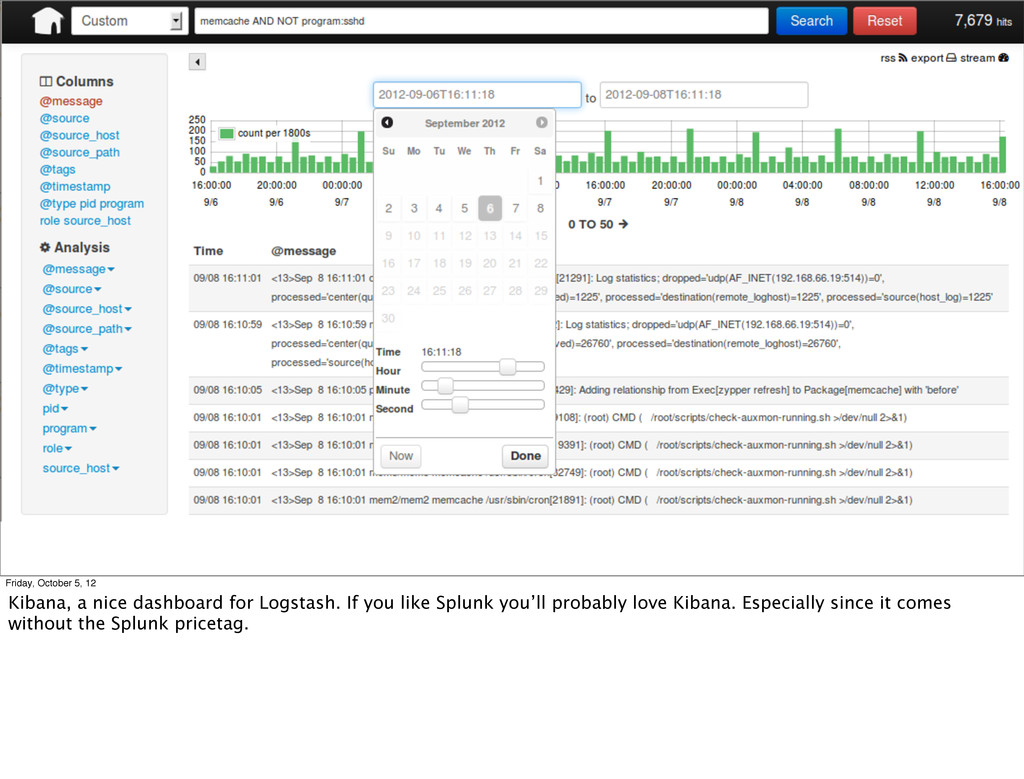
... state engine storage engine event stream aggregator scheduler notifier visualizer Friday, October 5, 12 Visualizers consist of dashboards and other user interfaces that consume metrics and alerts from the system. In OSI- terms, they are the application layer on top of the stack. In layman terms, they make pretty graphs from raw data.
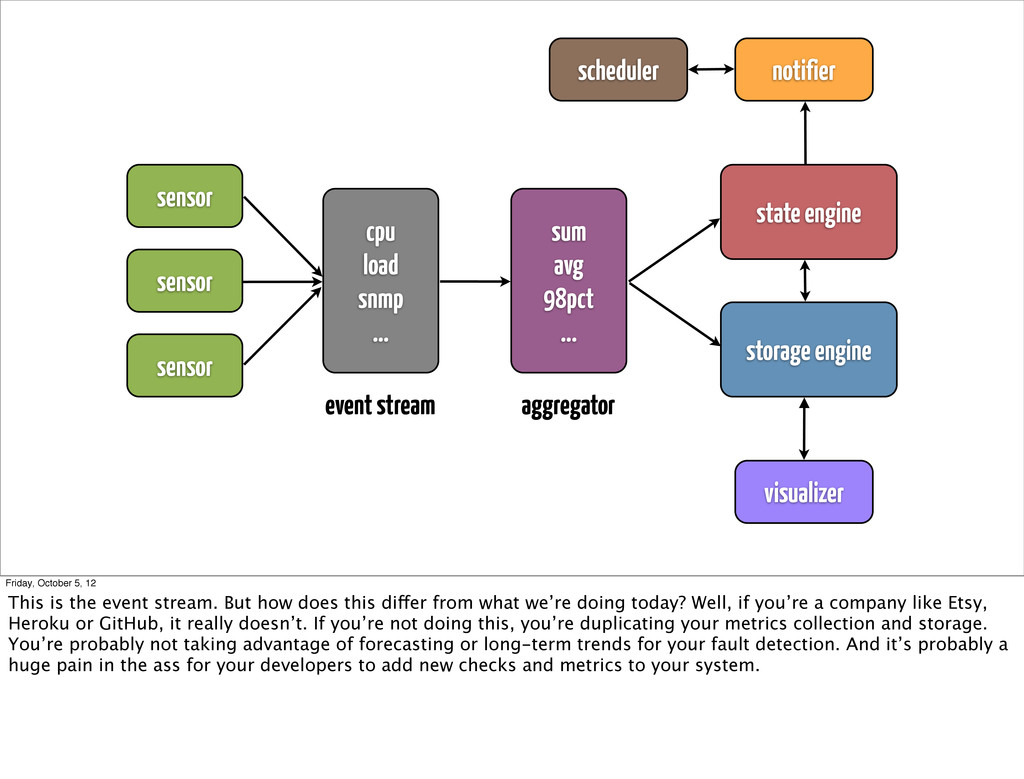
... state engine storage engine event stream aggregator scheduler notifier visualizer Friday, October 5, 12 This is the event stream. But how does this differ from what we’re doing today? Well, if you’re a company like Etsy, Heroku or GitHub, it really doesn’t. If you’re not doing this, you’re duplicating your metrics collection and storage. You’re probably not taking advantage of forecasting or long-term trends for your fault detection. And it’s probably a huge pain in the ass for your developers to add new checks and metrics to your system.
You’re thinking “ok I’m convinced, what can I do now!” Here are some tools that already fit into the event stream model. You’re probably already using some of them, at least if you’re cool like me. ;-)
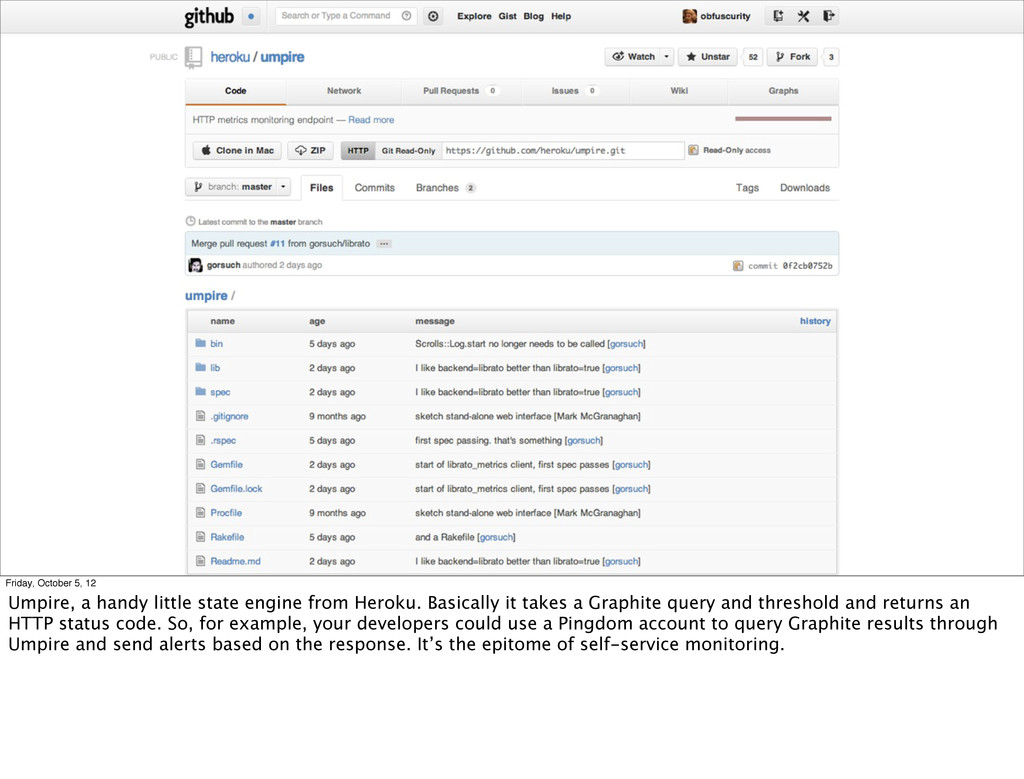
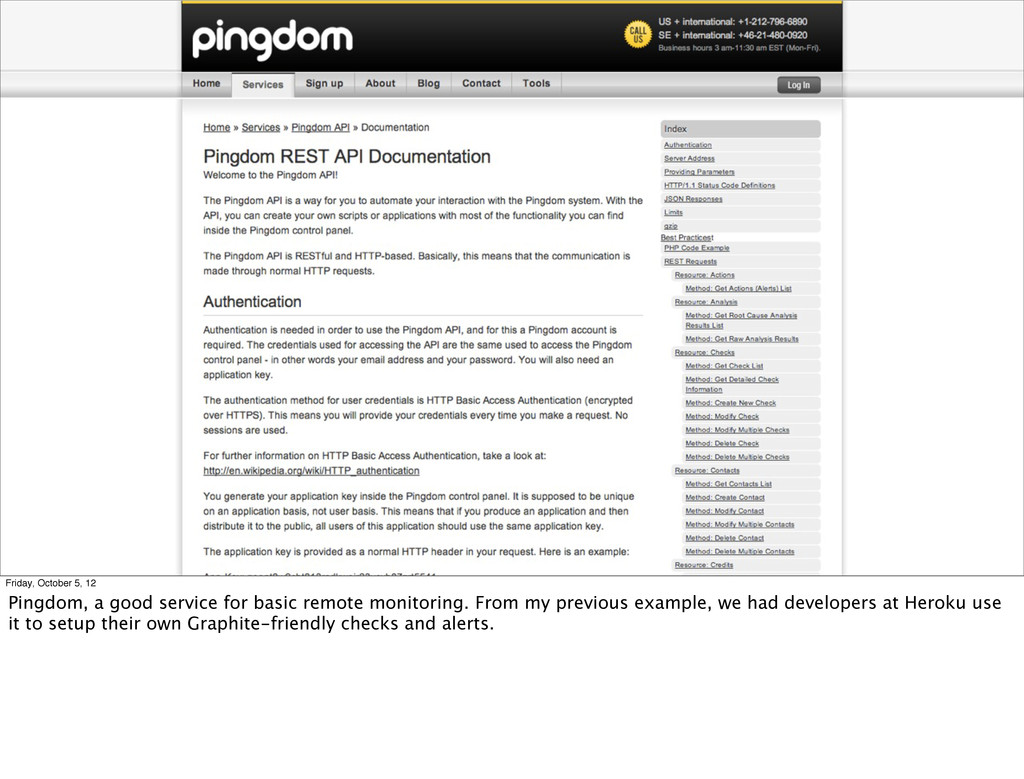
from Heroku. Basically it takes a Graphite query and threshold and returns an HTTP status code. So, for example, your developers could use a Pingdom account to query Graphite results through Umpire and send alerts based on the response. It’s the epitome of self-service monitoring.
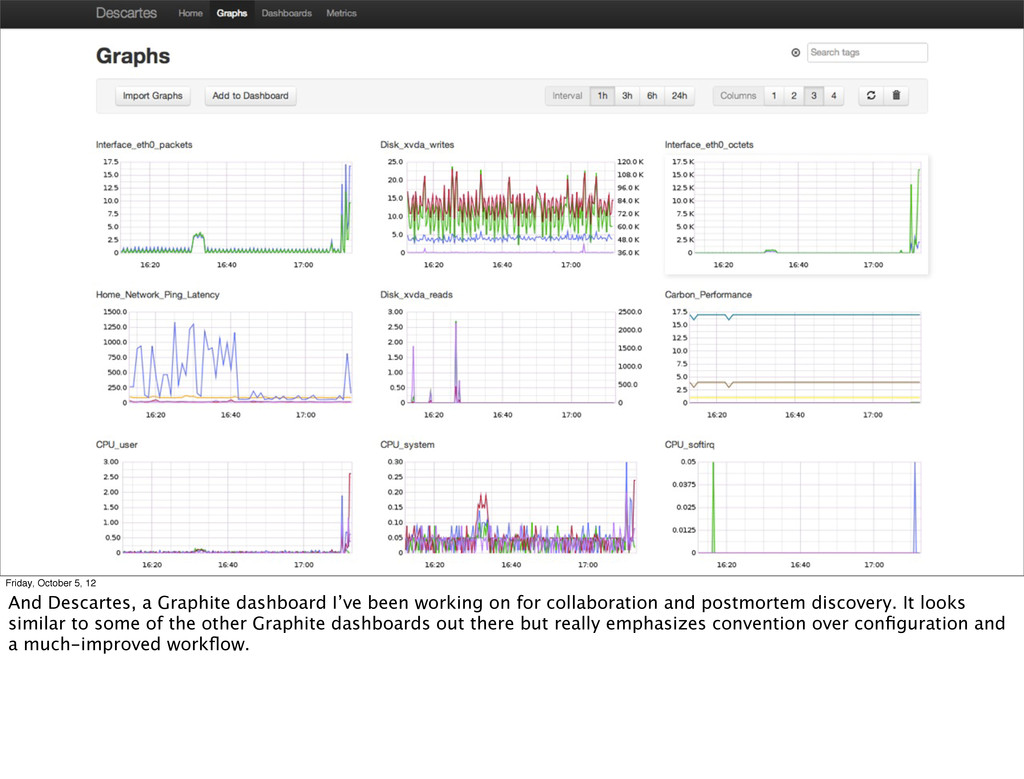
been working on for collaboration and postmortem discovery. It looks similar to some of the other Graphite dashboards out there but really emphasizes convention over configuration and a much-improved workflow.
to briefly mention some commercial services that, while they’re not open-source, they are open-source friendly. In particular they all have decent APIs that make it really easy to send data in, and AT LEAST POSSIBLE to pull data out of.
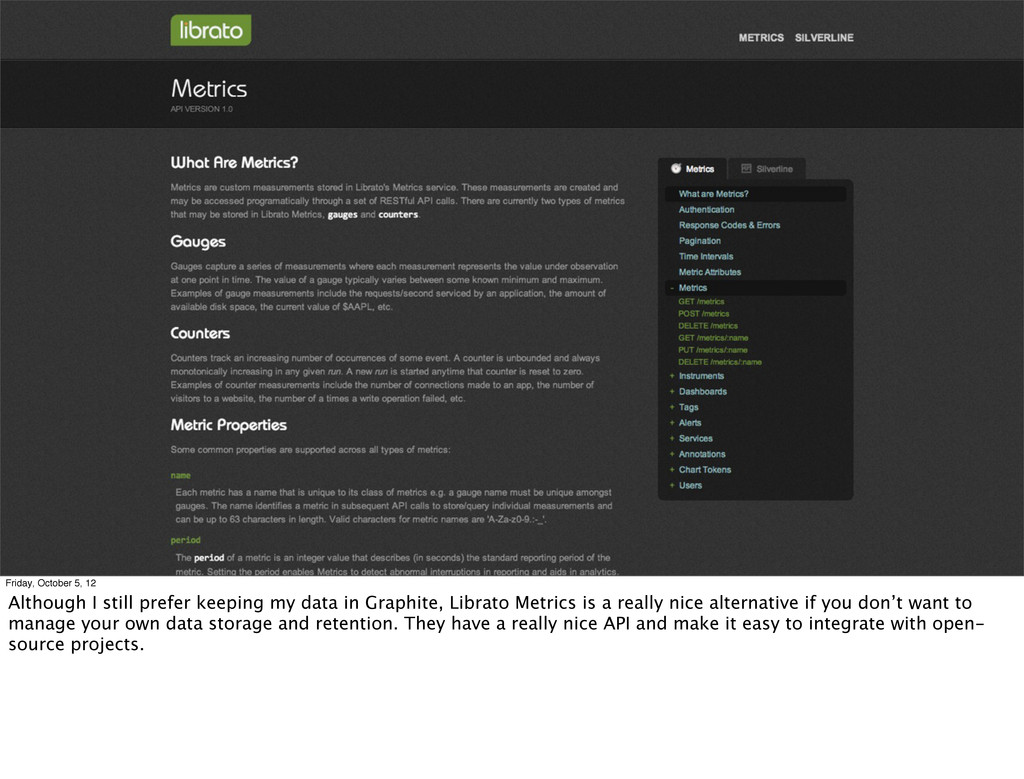
data in Graphite, Librato Metrics is a really nice alternative if you don’t want to manage your own data storage and retention. They have a really nice API and make it easy to integrate with open- source projects.
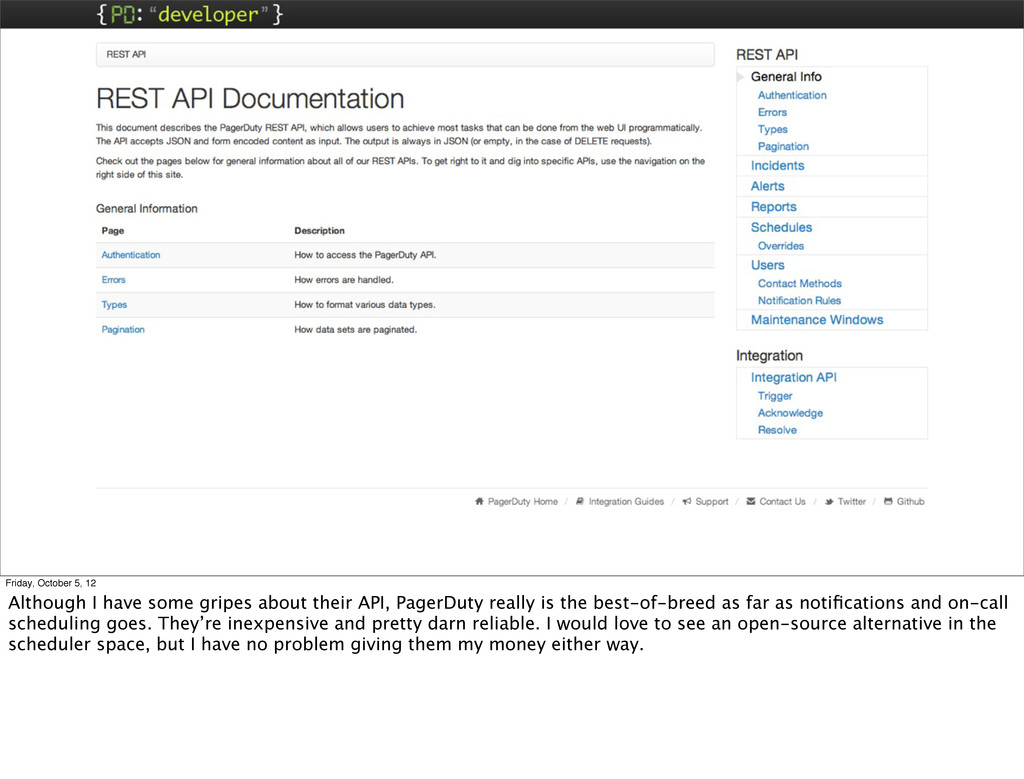
their API, PagerDuty really is the best-of-breed as far as notifications and on-call scheduling goes. They’re inexpensive and pretty darn reliable. I would love to see an open-source alternative in the scheduler space, but I have no problem giving them my money either way.
short, I’d love to see open-source monitoring move towards the composable event stream model. Having a defined set of functions and interfaces will improve the reliability and scalability of our toolset. If you have any questions or ideas, please see me later today. If you think I’m crazy, well, thanks for listening anyways.